. 2025 Jul 31:16:1618012.
doi: 10.3389/fimmu.2025.1618012. eCollection 2025.

CRIF1 gene therapy ameliorates inflammatory bowel disease by suppressing TH17 cells and fibrosis through mitochondrial function regulation

Affiliations

CRIF1 gene therapy ameliorates inflammatory bowel disease by suppressing TH17 cells and fibrosis through mitochondrial function regulation

Jin-Sil Park et al. Front Immunol. .

Abstract

Background: CR6-interacting factor 1 (CRIF1) is a nuclear transcriptional regulator and a mitochondrial inner membrane protein. Although serious modifications of the tissue architecture of the small intestine have been reported in CRIF1-deficient mice, how this may affect the development of inflammatory bowel disease (IBD) remains unclear. We investigated the effects of CRIF1 on mice with colitis.

Methods: In DSS-induced colitis mice administered p3XFLAG-CMV-10-CRIF1, clinical symptoms were evaluated. Mitochondrial morphology in the intestinal tissues of colitis mice and UC patients was observed by electron microscopy. Level of CRIF1 in the splenic mitochondria of colitis mice or human PBMCs were investigated by western blot or real-time PCR, and the amount of IL-17 in the supernatant of healthy PBMCs co-cultured with CRIF1-overexpressing mitochondria was investigated by ELISA.

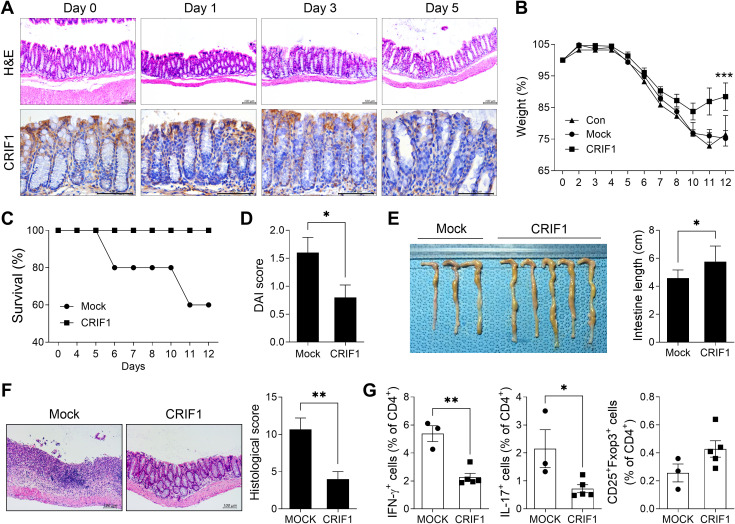
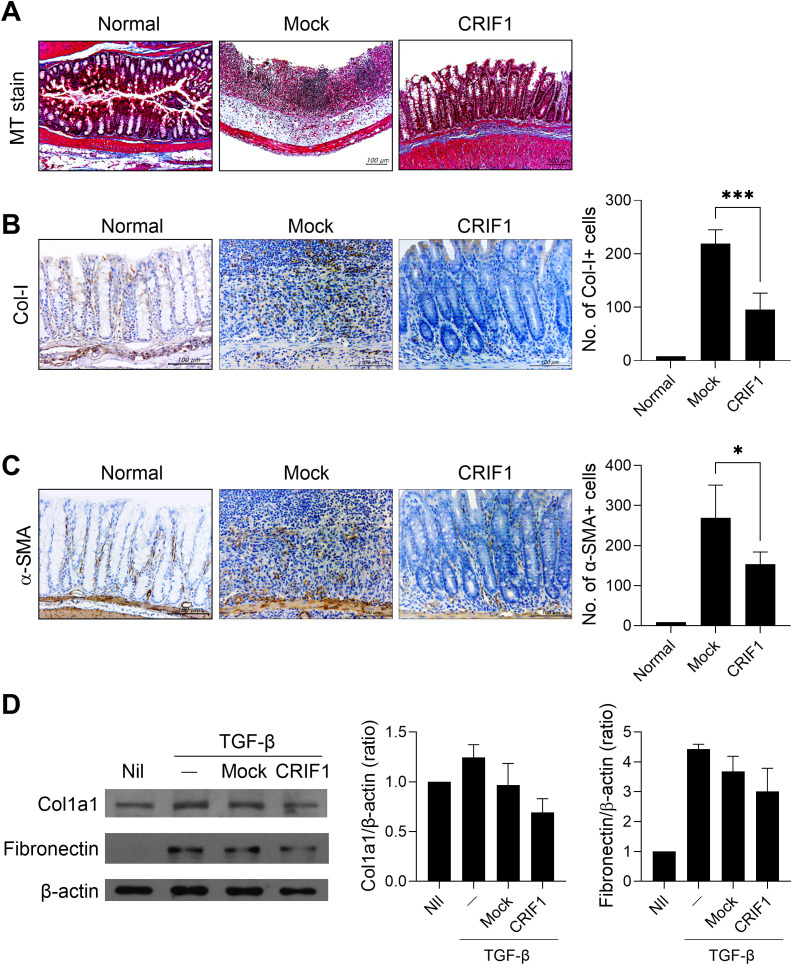
Results: Overexpression of CRIF1 attenuated the severity of colitis, alleviated weight loss, and intestinal shortening. Moreover, overexpression of CRIF1 significantly reduced the levels of proinflammatory and necroptosis-related factors in colon and inhibited intestinal fibrosis. The intestines of these mice showed a reduced level of CRIF1 and altered mitochondrial morphology. Transplantation of CRIF1-overexpressed mitochondria into mice with colitis alleviated disease severity. Patients with ulcerative colitis exhibited decreased CRIF1 levels with dysfunctional mitochondria in inflamed colonic tissue. CRIF1-overexpressing mitochondria inhibited IL-17 production in PBMCs from healthy control.

Conclusion: Our findings demonstrate that CRIF1 alleviates IBD by suppressing inflammation and fibrosis by improving mitochondrial function. Improving mitochondrial function through CRIF1 may be a potential therapeutic strategy for IBD.

Keywords: CRIF1; fibrosis; inflammatory bowel disease; inflammatory cytokine; mitochondria.


Conflict of interest statement

The authors declare that the research was conducted in the absence of any commercial or financial relationships that could be construed as a potential conflict of interest.

Figures

Figure 1
Figure 1
CRIF1 alleviates the development of DSS-induced colitis. (A) C57BL/6 mice were orally treated with 3% DSS in distilled water; colons were obtained on days 0, 1, 3, and 5. Colon tissue sections were subjected to hematoxylin and eosin staining (upper panel) and immunohistochemistry using antibodies against CRIF1 (lower panel). Representative images are shown. Original magnification: 200×. Scale bar: 100 µm. (B-G) Acute colitis was induced in C57BL/6 mice through oral administration of 3% DSS in distilled water for 5 days, followed by regular drinking water for 7 days. p3XFLAG-CMV-10-CRIF1 (n = 5) or mock (n = 3) vector was intravenously injected 1 day before and on day 7 from the start of 3% DSS treatment. (B) Changes in body weight were measured, and the percentage change in body weight was calculated based on the initial weight (at day 0). (C) Survival rate during the disease process. (D) Disease activity index (DAI) score on day 12 after treatment. (E) On day 12 after treatment, changes in colon length were measured. (F) On day 12, colon tissue sections were stained with hematoxylin and eosin. Representative images are shown (original magnification: 200×, scale bar: 100 µm). The graph shows the mean histological scores. (G) The frequencies of IFN-γ+CD4+, IL-17+CD4+, and CD25+Foxp3+CD4+ cells in peripheral blood of mice were analyzed via flow cytometry. Values are presented as means ± SDs. *P < 0.05, **P < 0.01, and ***P < 0.001. Data are representative of two independent experiments.
Figure 2
Figure 2
CRIF1 reduces colonic inflammation in mice with DSS-induced colitis. (A) Acute colitis was induced in C57BL/6 mice through oral administration of 3% DSS in distilled water for 5 days, followed by regular drinking water for 8 days. p3XFLAG-CMV-10-CRIF1 (n = 4) or mock (n = 4) vector was intravenously injected 1 day before and on day 7 from the start of DSS treatment. On day 13 after DSS administration, the frequencies of IFN-γ+CD4+, IL-17+CD4+, and CD25+Foxp3+CD4+ cells in ex vivo spleens of mice were analyzed via flow cytometry (normal mice, n = 3). (B) Colitis was induced in C57BL/6 mice through oral administration of 3% DSS in distilled water for 5 days, followed by regular drinking water for 7 days. p3XFLAG-CMV-10-CRIF1 or mock vector was intravenously injected 1 day before and on day 7 from the start of treatment. On day 12 after treatment, colon sections were stained with antibodies against IL-6, IL-1β, IL-8, and VEGF. Representative images are shown (original magnification: 400×, Scale bar: 100 µm). Graphs show the numbers of antibody-positive cells. Values are presented as means ± SDs. *P < 0.05, **P < 0.01, and ***P < 0.001. Data are representative of two independent experiments.
Figure 3
Figure 3
CRIF1 reduces the levels of mediators associated with necroptosis. Colitis was induced in C57BL/6 mice through oral administration of 3% DSS in distilled water for 5 days, followed by regular drinking water for 7 days. p3XFLAG-CMV-10-CRIF1 or mock vector was intravenously injected 1 day before and on day 7 from the start of treatment. On day 12 after treatment, colon sections were stained with antibodies against TNF-α, TNFR1, RIPK1, RIPK3, and phosphorylated MLKL. Representative images are shown (original magnification: 400×, scale bar: 100 µm). Graphs show the numbers of antibody-positive cells. Values are presented as means ± SDs. *P < 0.05, and ***P < 0.001. Data are representative of two independent experiments.
Figure 4
Figure 4
CRIF1 mitigates the development of fibrosis in colonic mucosa. Colitis was induced in C57BL/6 mice through oral administration of 3% DSS in distilled water for 5 days, followed by regular drinking water for 7 days. p3XFLAG-CMV-10-CRIF1 or mock vector was intravenously injected 1 day before and on day 7 from the start of treatment. (A) On day 12 after treatment, colon sections were stained with Masson’s trichrome. Representative images are shown (original magnification: 200×, scale bar: 100 µm). (B, C) Colon sections were immunohistochemically stained for collagen-I (Col-I) and α-smooth muscle actin (α-SMA). Representative images are shown (original magnification: 400×, scale bar: 100 µm). Graphs show the numbers of antibody-positive cells. (D) CCD-18Co Cells were transfected with pCMV6-Myc-DDK hCRIF1 vector or mock vector for 3 days, then starved for 24 h with serum-free DMEM and stimulated with 10 ng/mL TGF-β for 24 h. The levels of Col1a1 and fibronectin were assessed by immunoblotting. Values are presented as means ± SDs. *P < 0.05, and ***P < 0.001. Data are representative of two independent experiments.
Figure 5
Figure 5
Mice with DSS-induced colitis exhibit mitochondrial modifications and reduced expression of CRIF1. (A-B) Acute colitis was induced in C57BL/6 mice through oral administration of 3% DSS in distilled water for 5 days, followed by regular drinking water for 7 days. (A) On day 12 after DSS administration, structural changes in mitochondria were examined in colon tissue sections via transmission electron microscopy. Representative images are shown. (B) Cytosol and mitochondrial fractions were obtained from the spleen, and the level of CRIF1 was examined via Western blotting. Tubulin and COX IV were used as validation controls for cytosolic and mitochondrial fractions, respectively. The graph shows the ratio of the relative density of the CRIF1 protein normalized to each validation control.
Figure 6
Figure 6
Transplantation of CRIF1-overexpressing mitochondria alleviates DSS-induced colitis. (A) Chronic DSS-induced colitis was induced through oral administration of 3% DSS in distilled water for 5 days, followed by regular drinking water three times as shown in the schematic. Mitochondria were isolated from C2C12 cells transfected with p3XFLAG-CMV-10-CRIF1 or mock vector and mitochondria (10 μg in 200 μL saline) were intraperitoneally injected 1 day before and on days 2, 4, 6, 9, 12, and 14 from the start of treatment (n = 5/group). (B) Percentage change in body weight during the disease process. (C) On day 38 after the first DSS administration, colon sections were stained with hematoxylin and eosin (H&E) and antibodies against CRIF1, α-smooth muscle actin (α-SMA), and collagen-I (Col-I). Representative images are shown (original magnification: H&E 200×; IHC 400×, scale bar: 100 µm). Graphs show the mean histological scores for H&E and the numbers of antibody-positive cells for IHC. (D) On day 38 after the first DSS administration, the frequencies of IL-17+CD4+ and CD5+CD1d+IL-10+CD19+ cells in ex vivo spleens of mice were analyzed via flow cytometry. (E) CCD-18Co cells were transfected with pCMV6-Myc-DDK hCRIF1 vector or mock vector; 3 days later, mitochondria were isolated from these cells. Mitochondria (0.3 μg/mL) were cocultured with human PBMCs under the stimulation of anti-CD3 antibody (2 μg/mL); 3 days later, the supernatant was harvested and the amount of IL-17 was measured by ELISA. Values are presented as means ± SDs. *P < 0.05, **P < 0.01. Data are representative of two independent experiments.
Figure 7
Figure 7
UC patients exhibit dysfunctional mitochondria and low CRIF1 mRNA levels. (A) Structural changes in mitochondria were examined via transmission electron microscopy in inflamed and non-inflamed colonic tissue sections of UC patients (left). (B) Colon tissue sections (n = 5/group) were subjected to immunohistochemistry using antibodies against CRIF1 (right). Representative images are shown. Graphs show the numbers of CRIF1-positive cells. (C) CRIF1 mRNA levels were examined by real-time polymerase chain reaction of PBMCs from healthy controls and UC patients with severe inflammation or remission. Values are presented as means ± SDs. **P < 0.01 and ****P < 0.0001. Data are representative of two independent experiments.

Similar articles

References

    1. Podolsky DK. Inflammatory bowel disease. N Engl J Med. (2002) 347:417–29. doi: 10.1056/NEJMra020831, PMID: - DOI - PubMed
    1. Danese S, Fiocchi C. Etiopathogenesis of inflammatory bowel diseases. World J Gastroenterol. (2006) 12:4807–12. doi: 10.3748/wjg.v12.i30.4807, PMID: - DOI - PMC - PubMed
    1. Abraham C, Cho JH. Inflammatory bowel disease. N Engl J Med. (2009) 361:2066–78. doi: 10.1056/NEJMra0804647, PMID: - DOI - PMC - PubMed
    1. He R, Zhao S, Cui M, Chen Y, Ma J, Li J, et al. Cutaneous manifestations of inflammatory bowel disease: basic characteristics, therapy, and potential pathophysiological associations. Front Immunol. (2023) 14:1234535. doi: 10.3389/fimmu.2023.1234535, PMID: - DOI - PMC - PubMed
    1. Collaborators GBDIBD . The global, regional, and national burden of inflammatory bowel disease in 195 countries and territories, 1990-2017: a systematic analysis for the Global Burden of Disease Study 2017. Lancet Gastroenterol Hepatol. (2020) 5:17–30. doi: 10.1016/S2468-1253(19)30333-4, PMID: - DOI - PMC - PubMed

LinkOut - more resources