. 2025 Jul 30;33(3):101544.
doi: 10.1016/j.omtm.2025.101544. eCollection 2025 Sep 11.

Neonatal gene therapy effectively prevents disease manifestations in a murine model of Mucopolysaccharidosis type I

Affiliations

Neonatal gene therapy effectively prevents disease manifestations in a murine model of Mucopolysaccharidosis type I

Giada De Ponti et al. Mol Ther Methods Clin Dev. .

Abstract

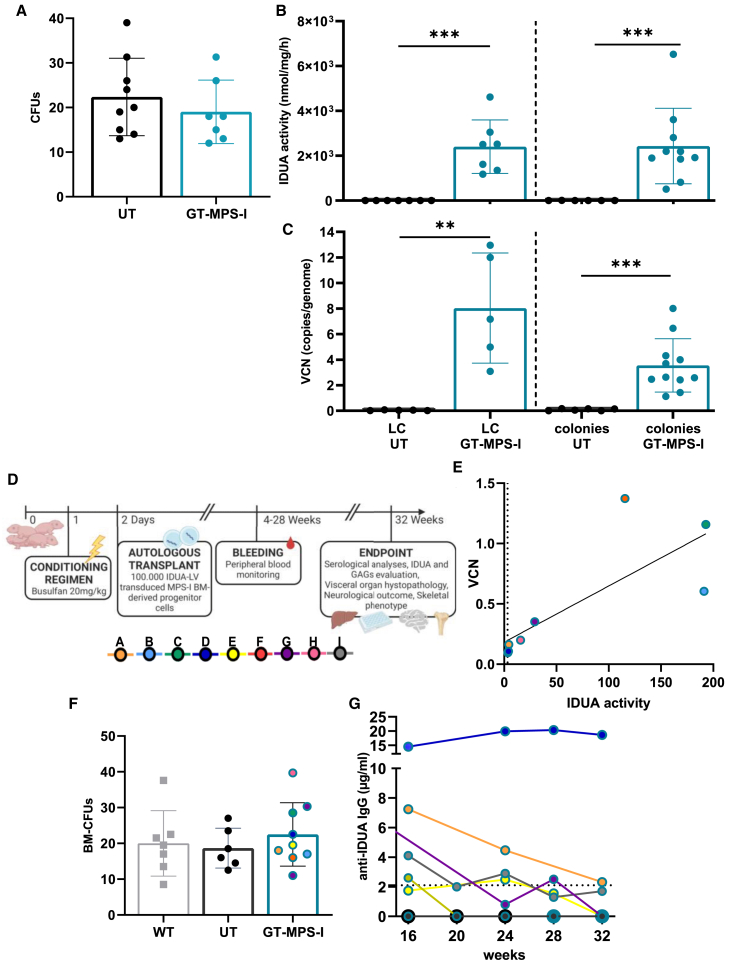
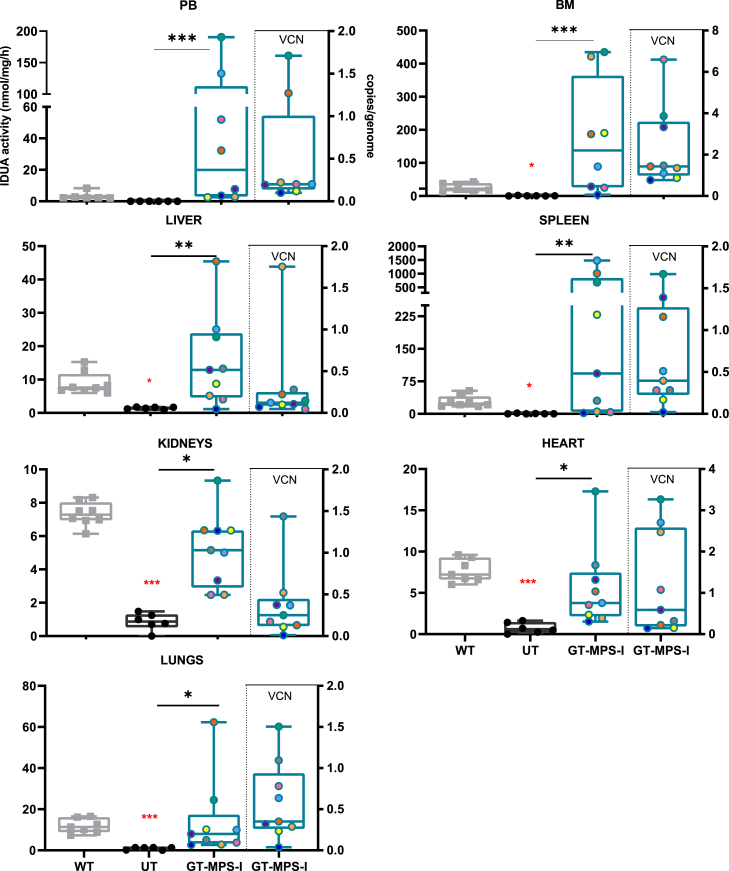
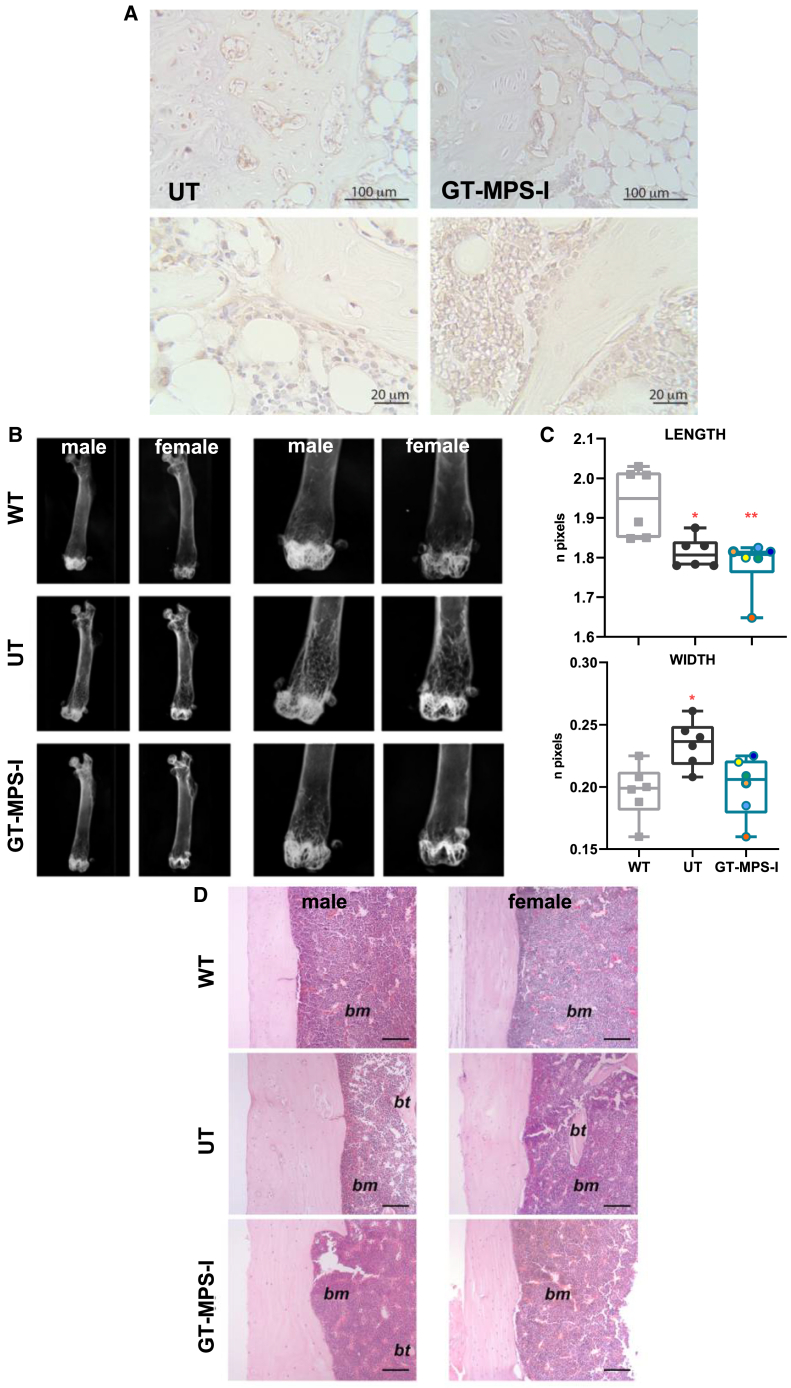
Mucopolysaccharidosis type I (MPS-I) is a rare pediatric disease caused by mutations in the α-L-iduronidase (IDUA) gene encoding for a lysosomal enzyme involved in glycosaminoglycan metabolism. While newborns with the severe Hurler variant are usually asymptomatic at birth, progressive disease manifestations emerge early in life. Since previous studies on lentiviral vector gene therapy (GT) in Hurler patients have demonstrated superior metabolic correction and early beneficial clinical effects, we investigated whether applying this GT approach during the neonatal period could be effective in preventing disease pathology before it becomes irreversible. Thus, newborn MPS-I mice were transplanted with affected bone marrow-derived progenitor cells transduced with an IDUA-encoding lentiviral vector. Treated animals displayed increased IDUA levels, significantly reducing substrate accumulation in analyzed organs, indicating metabolic correction. Skeletal manifestations, typically resistant to conventional therapies, showed improvements at radiographic and histological levels post-treatment. Additionally, a decrease in brain cortex vacuolization and inflammation suggested neurological amelioration. Overall, this study provides a proof of principle demonstrating the effectiveness of neonatal ex vivo GT in MPS-I mice and supports its potential for further optimization at the pre-clinical level.

Keywords: Hurler; dysostosis multiplex; lentiviral vectors; lysosomal storage disease; mucopolysaccharidosis type I; neonatal gene therapy.


Conflict of interest statement

The authors declare no competing interests.

Figures

None
Graphical abstract
Figure 1
Figure 1
Quantification of GAG accumulation in untreated aging MPS-I mice GAG storage was evaluated in the liver, kidneys, spleen, lungs, and heart of MPS-I mice at 1–2, 3–4, and 8 weeks of age (n > 7, for each age). Each data point represents an individual mouse, while bars indicate the median value. WT mice of different ages are represented in gray. ∗p ≤ 0.05, ∗∗p ≤ 0.01, ∗∗∗p ≤ 0.001, and ∗∗∗∗p < 0.0001 by non-parametric one-way ANOVA with Kruskal-Wallis test. Red asterisks indicate significance compared to WT mice.
Figure 2
Figure 2
In vitro assessment of IDUA-LV transduced BM-derived progenitor cells from MPS-I mice and in vivo transplantation (A) Quantification of CFUs generated from BM-derived progenitor cells of MPS-I mice either UT or transduced with the IDUA-LV (GT-MPS-I) at MOI of 40 (n ≥ 7). (B and C) IDUA activity and VCN assessed in UT and GT-MPS-I BM cells following LC or CFU-assay (n ≥ 5). Each data point represents an individual sample, while the bar indicates the mean value (SD). ∗p ≤ 0.01 and ∗∗∗p ≤ 0.001 by Mann-Whitney test. (D) Schematic procedure and timeline of the GT approach, with legend of treated mice (A–I). Created in BioRender. Santi, L. (2025) https://BioRender.com/r41t725. (E) Linear correlation between IDUA activity and VCN evaluated over time in treated mice’s PB (p ≤ 0.01 by Pearson test). The dashed line represents the median IDUA activity in PB of WT mice (n = 8). (F) Number of CFUs formed by BM cells from WT, UT, and GT-treated mice. Each data point represents an individual mouse, while the bar indicates the mean value (SD). p > 0.05 by non-parametric one-way ANOVA with Kruskal-Wallis test. (G) Evaluation of antibodies concentration against rhIDUA in GT-treated mice serum monthly until the endpoint (n = 9). The dashed line represents the threshold value of positivity.
Figure 3
Figure 3
Evaluation of IDUA activity in GT-treated MPS-I mice IDUA activity was measured in the PB, BM, liver, spleen, kidneys, lungs, and heart of wild-type (WT, n ≥ 7, represented as gray plots on the graph), MPS-I untreated (UT, n = 6, represented as black plots), and GT-treated MPS-I mice (GT-MPS-I, n = 8, represented by blue plots) at the study endpoint at 32 weeks of age (left part of the graph). VCN analysis results for the same organs in GT-MPS-I mice are shown on the right side of the graph. Each data point represents an individual mouse, while the bar indicates the median value. ∗p ≤ 0.05, ∗∗p ≤ 0.01, and ∗∗∗p ≤ 0.001 by non-parametric one-way ANOVA with Kruskal-Wallis test. Red asterisks indicate significance compared to WT mice.
Figure 4
Figure 4
Evaluation of GAG accumulation in GT-treated MPS-I mice (A) Quantification of GAG content in the liver, spleen, kidneys, lungs, and heart of WT mice (n = 8, represented as gray plots on the graph), UT MPS-I mice (n = 6; represented as black plots), and GT-MPS-I mice (n = 9; represented as blue plots) at the study endpoint of 32 weeks of age. (B) Quantification of plasma levels of ΔDiHS-0S, mono-sulfated KS and the ratio of di-sulfated KS over mono-sulfated KS (%DSKS/MSKS) in selected mice at the time of sacrifice (n ≥ 5 for each group). ∗p ≤ 0.05, ∗∗p ≤ 0.01, and ∗∗∗p ≤ 0.001 by non-parametric one-way ANOVA with Kruskal-Wallis test. Red asterisks indicate significance compared to WT mice. (C) Representative images of organ sections stained with toluidine blue from UT and GT-treated MPS-I mice at the study endpoint. A 20 μm scale bar was used for kidney, heart, renal glomeruli, and spleen and a 10 μm scale bar for lungs. Black arrows indicate areas of GAG accumulation. (D) Quantification of cytoplasmic vacuolizations in the kidneys (including renal glomeruli), spleen, lungs, and heart of UT (n = 3) and GT-treated MPS-I mice (n = 4), indicative of distended lysosomes. The percentage of vacuolization was calculated over the total area for organs or over imaged area for renal glomeruli from 10 random fields. Each data point represents an individual mouse, while bars indicate the median value. ∗p ≤ 0.01 by Mann-Whitney test.
Figure 5
Figure 5
Evaluation of brain disease after neonatal GT (A) Assessment of IDUA activity in the brains of WT (n = 8, represented as gray plots on the graph), untreated MPS-I (UT, n = 6, represented as black plots), and GT-treated MPS-I mice (n = 9, represented as blue plots) at the study endpoint of 32 weeks of age. The IDUA activity was expressed as a fold increase over UT. VCN analysis results are indicated on the right side of the graph. (B) Representative images of toluidine blue-stained cerebral sections from the cortex and cerebellum (Purkinje cell layer) of untreated and GT-treated MPS-I mice at the study endpoint. A 10-μm scale bar was used as a reference for the images. White arrows indicate storage inside the Purkinje cells, while black arrows highlight GAG deposition outside the cells. Ten images from 3 to 4 different mice per group were quantified. (C) Quantitative analysis of vacuolization in the cortex of untreated and GT-treated MPS-I mice, expressed as the percentage of vacuolation relative to the imaged area (n = 4) (D and E) Quantification of total Purkinje cells (n° cells/area) or pathological Purkinje cells (% of pathological over total Purkinje cells) in WT, untreated and treated MPS-I mice (n ≥ 3). (F) Evaluation of neuroinflammation using immunofluorescence, expressed as the number of Iba1+ cells per area (n ≥ 3). Each data point represents an individual mouse, while bars indicate the median value. ∗p ≤ 0.05, ∗∗p ≤ 0.01, and ∗∗∗∗p < 0.0001 by non-parametric one-way ANOVA with Kruskal-Wallis test. Red asterisks indicate significance compared to WT mice.
Figure 6
Figure 6
Bone alterations amelioration in neonatal GT-treated mice (A) Representative images of immunostaining on femurs to detect HS accumulation in untreated MPS-I (UT) and GT-treated MPS-I (GT-MPS-I) mice at study endpoint (scale bars, 100 μm and 20 μm). (B) Representative radiographic images of femurs from WT, UT, and GT-MPS-I mice at the study endpoints of 32 weeks. (C) Analysis of femur length and mid-length width in both male and female mice among different groups (n = 6 for each group). Each data point represents an individual mouse, while bars indicate the median value. (D) Representative histological images of femur bone cortex (magnification 10×, hematoxylin and eosin stain) from male and female WT, UT, and GT-MPS-I mice at the study endpoint. A 100 μm scale bar was used. bt, bone trabeculae; bm, bone marrow. ∗p ≤ 0.05 and ∗∗p ≤ 0.01 by non-parametric one-way ANOVA with Kruskal-Wallis test. Red asterisks indicate significance compared to WT mice.
Figure 7
Figure 7
Micro-CT evaluation of the femur architecture after neonatal GT (A) Representative images of cortical (left) and trabecular (right) volumetric models reconstructed from micro-CT scans from WT, untreated MPS-I (UT), and GT-treated MPS-I (GT-MPS-I) mice at the study endpoint of 32 weeks. (B) Evaluation of trabecular and cortical bone morphometrics in femurs from different groups. Bone area over total area (BA/TA) and average cortical thickness (AVG Cort Thick) were measured in the cortical portion, while bone mineral density (BMD), bone volume over total volume (BV/TV), and average trabecular thickness (AVG Tb Th) were analyzed at the trabecular level (n = 6 for both groups). (C) Graph of osteoblast number per bone perimeter (N.Ob/B.Pm, N/mm) and osteoblast surface per bone surface (Ob.S/BS, %) (n ≥ 3). (D) Representative histological images of TRAP positive osteoclasts (red stain; scale bars, 50 μm) performed on femurs from UT and GT-MP-SI mice at the study endpoint. (E) Graph of osteoclast number per bone perimeter (N.Oc/B.Pm, N/mm) and osteoclast surface per bone surface (OC.S/BS, %) (n ≥ 4). Each data point represents an individual mouse, while bars indicate the median value. ∗p ≤ 0.05 and ∗∗p ≤ 0.01 by non-parametric one-way ANOVA with Kruskal-Wallis test. Red asterisks indicate significance compared to WT mice.

References

    1. Galimberti C., Madeo A., Di Rocco M., Fiumara A. Mucopolysaccharidoses: early diagnostic signs in infants and children. Ital. J. Pediatr. 2018;44:133. doi: 10.1186/s13052-018-0550-5. - DOI - PMC - PubMed
    1. De Ponti G., Donsante S., Frigeni M., Pievani A., Corsi A., Bernardo M.E., Riminucci M., Serafini M. MPSI Manifestations and Treatment Outcome: Skeletal Focus. Int. J. Mol. Sci. 2022;23 doi: 10.3390/ijms231911168. - DOI - PMC - PubMed
    1. Aldenhoven M., Sakkers R.J.B., Boelens J., de Koning T.J., Wulffraat N.M. Musculoskeletal manifestations of lysosomal storage disorders. Ann. Rheum. Dis. 2009;68:1659–1665. doi: 10.1136/ard.2008.095315. - DOI - PubMed
    1. Kiely B.T., Kohler J.L., Coletti H.Y., Poe M.D., Escolar M.L. Early disease progression of Hurler syndrome. Orphanet J. Rare Dis. 2017;12:32. doi: 10.1186/s13023-017-0583-7. - DOI - PMC - PubMed
    1. Azario I., Pievani A., Del Priore F., Antolini L., Santi L., Corsi A., Cardinale L., Sawamoto K., Kubaski F., Gentner B., et al. Neonatal umbilical cord blood transplantation halts skeletal disease progression in the murine model of MPS-I. Sci. Rep. 2017;7:9473. doi: 10.1038/s41598-017-09958-9. - DOI - PMC - PubMed

LinkOut - more resources