. 2025 May 13:10.1007/s42485-025-00186-8.
doi: 10.1007/s42485-025-00186-8. Online ahead of print.

Intrinsic disorder in CYP1B1 and its implications in primary congenital glaucoma pathogenesis

Affiliations

Intrinsic disorder in CYP1B1 and its implications in primary congenital glaucoma pathogenesis

Meghan Sharma et al. J Proteins Proteom. .

Abstract

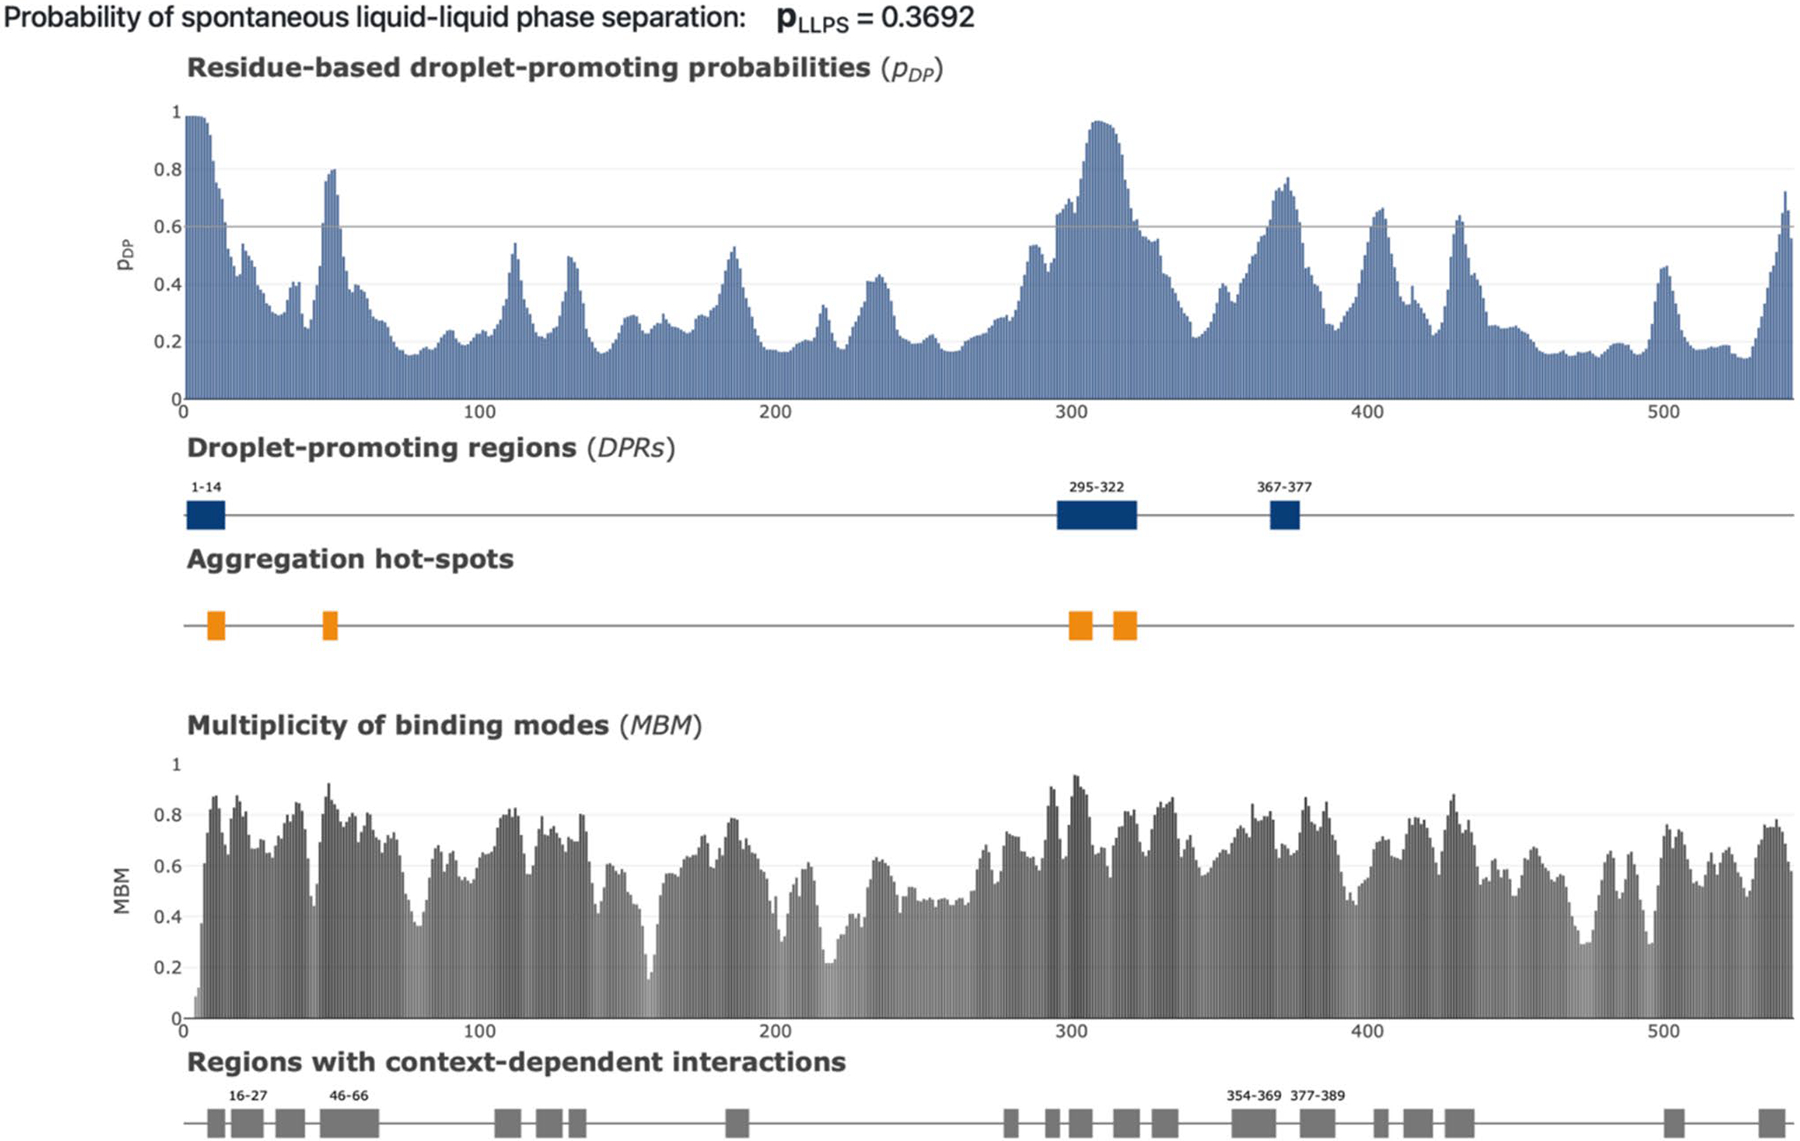
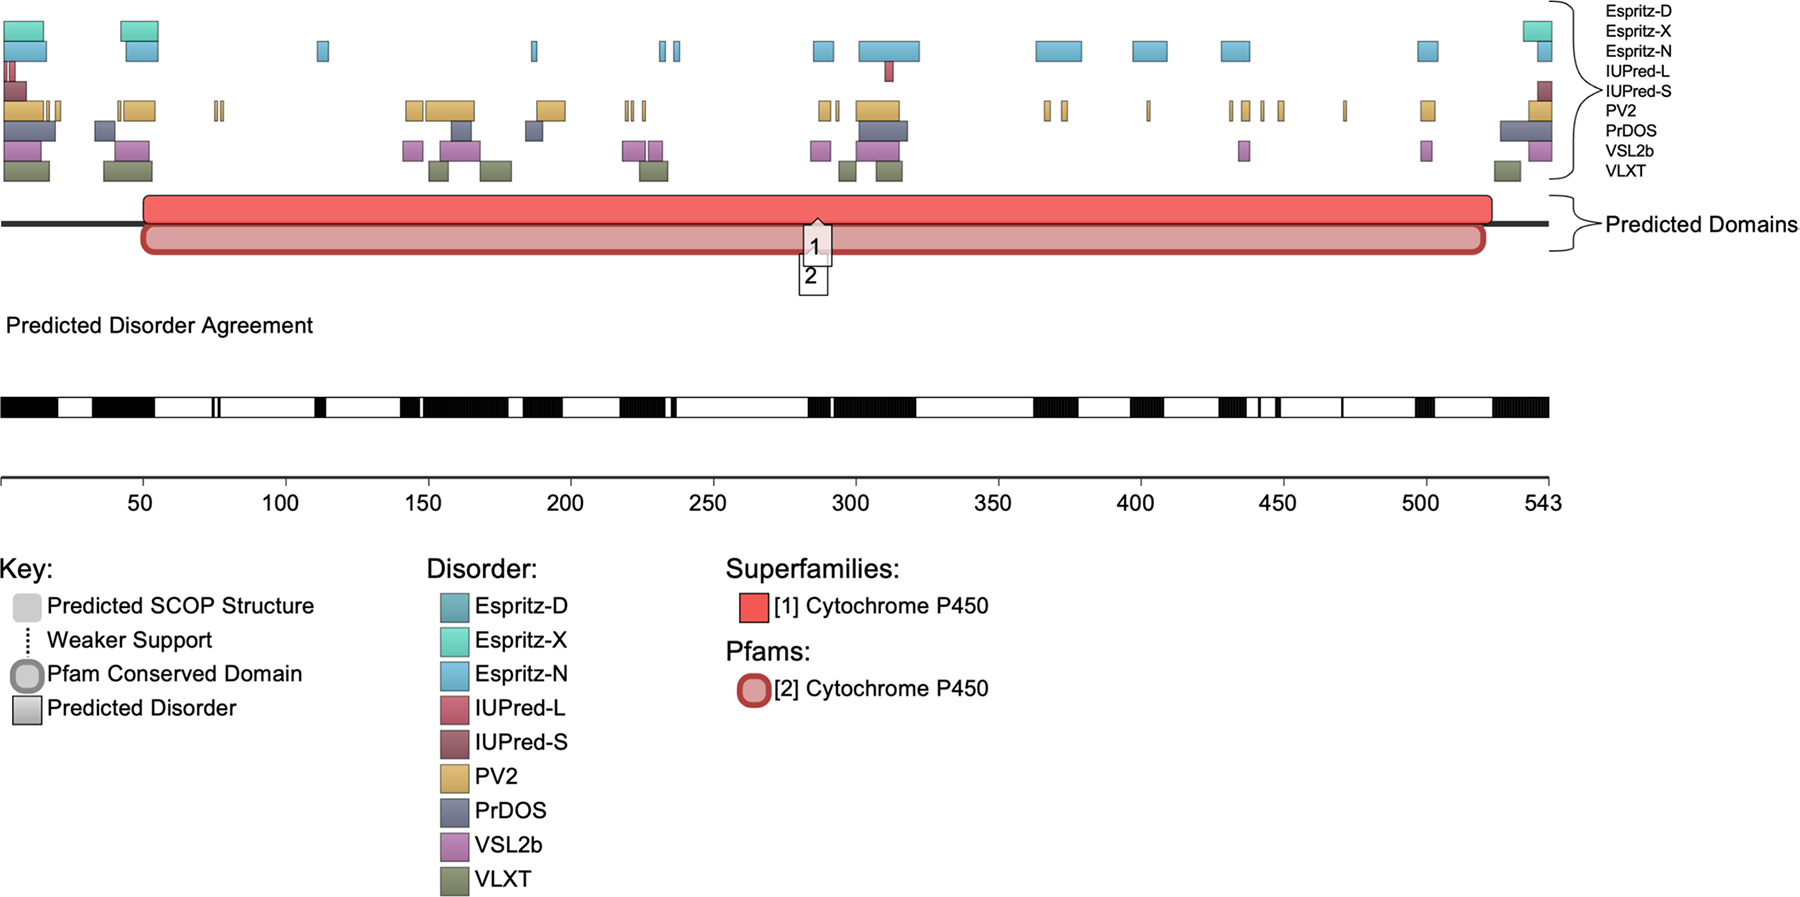
Cytochrome P450 1B1 (CYP1B1) plays a critical role in the pathogenesis of primary congenital glaucoma (PCG), a severe eye disorder that can lead to pediatric blindness if untreated. Increasing evidence suggests that intrinsically disordered proteins and regions (IDPs/IDPRs), which lack a stable three-dimensional structure, are significant in disease pathology due to their flexible nature, impacting protein interactions and function. This study explores the intrinsic disorder within CYP1B1 and its implications in the molecular mechanisms underlying PCG. We employed a comprehensive bioinformatics approach to assess the structural and functional properties of CYP1B1 using tools such as AlphaMissense, a tool crafted to evaluate the functional impact of missense mutations in proteins. Our structural analysis qualitatively demonstrated that CYP1B1 contains intrinsically disordered protein regions (i.e., spaghetti-like entities) that are structureless and flexible. Correlation analysis showed that disorder decreases exponentially relative to AlphaMissense predicted pathogenicity, with an exponential decay fit (R 2 = 0.62), suggesting that highly disordered regions tend to harbor benign mutations. This study identifies critical intrinsically disordered regions within CYP1B1 and elucidates its complex interaction network, highlighting the potential role of these regions in PCG pathogenesis. The observed correlation between intrinsic disorder and reduced pathogenicity of mutations suggests that IDPRs may buffer against deleterious effects, providing a possible explanation for the variability in clinical outcomes associated with CYP1B1 mutations. These insights enhance our understanding of the molecular basis of PCG and offer potential targets for novel therapeutic interventions to combat this blinding childhood disorder.

Keywords: AlphaFold; AlphaMissense; D2P2; FuzDrop; RIDAO; STRING.


Conflict of interest statement

Conflict of interest The authors declare no competing interests.

Figures

Fig. 1
Fig. 1
Visualization of disorder and pathogenicity through AlphaFold2-generated protein structures. A depicts the AlphaFold2-generated structure of CYP1B1. The model confidence in the structure is color coded by the predicted local distance difference test (pLDDT), ranging from blue (very high confidence) to red (very low confidence). Areas exhibiting greater model certainty are usually indicative of alpha-helices and beta-pleated sheets. Conversely, areas with reduced model confidence are likely to correspond to intrinsically disordered regions of proteins. The black arrow points to a location that might exhibit substantial disorder, lacking a clear structure. In B, residues are color coded based on their predicted pathogenicity from AlphaMissense, ranging from blue (benign) to red (pathogenic), with a color gradient through white at intermediate scores (ambiguous). The horizontal color reference bar on the right correlates the intensity of the color with the level of pathogenicity. The average pathogenicity score was determined to be 0.51 by AlphaMissense
Fig. 2
Fig. 2
Amino acid composition profile of CYP1B1. The fractional difference is calculated as CxCorderCorder, where Cx is the content of a given amino acid in the query set (CYP1B1), and Corder is the content of a given amino acid in the background set (Protein Databank Select 25). Additionally, composition profiles for experimentally validated disordered proteins from the DisProt database and the distribution of amino acids in nature from the SwissProt database were generated for comparison. The top panel (A) represents order-promoting residues, while the bottom panel (B) represents disorder-promoting residues. The amino acid residues are ranked from most order-promoting residues ((i.e., cysteine (C), tryptophan (W), isoleucine (I), tyrosine (Y), phenylalanine (F), leucine (L), histidine (H), valine (V), asparagine (N), and methionine (M)) to most disorder-promoting residues ((i.e., arginine (R), threonine (T), aspartate (D), glycine (G), alanine (A), lysine (K), glutamine (Q), serine (S), glutamate (E), and proline (P)). Positive values indicate enrichment, and negative values indicate depletion of amino acids. Amino acids marked with (*) are statistically significant for enrichment (F, L, H, V, and M) for the order-promoting residues. There was significant depletion of (C, W, I, Y, and N) (p value < 0.05) in the order-promoting residues as well. Amino acids marked with (*) are statistically significant for enrichment (R, A, Q, S, and P) for the disorder-promoting residues. There was significant depletion of (T, D, G, K, and E) (p value < 0.05) in the disorder-promoting residues as well. Statistical significance for enrichment or depletion was calculated using a two-sample t test, with a Bonferroni correction for multiple comparisons (p < 0.05)
Fig. 3
Fig. 3
Evaluation of the intrinsic disorder predisposition of CYP1B1. Intrinsic disorder profiles for each residue compiled by RIDAO that integrate results from multiple predictors, including PONDR® VLXT, PONDR® VL3, PONDR® VSL2, PONDR® FIT, IUPred_long, and IUPred_short. The protein’s mean disorder profile (MDP) is determined by averaging the disorder scores from these individual predictors. A light shaded area represents the error distribution of the MDP. A thin black line marks the 0.5 disorder score, serving as the boundary between ordered and disordered states; residues or regions scoring above 0.5 are considered disordered, whereas those scoring below 0.5 are deemed ordered
Fig. 4
Fig. 4
Correlation between mean disorder profile (MDP) and AlphaMissense average pathogenicity score in CYP1B1. This figure illustrates the relationship between the mean disorder profile (MDP) and the AlphaMissense average pathogenicity score for CYP1B1, highlighting regions of interest within the protein. A presents a scatter plot of smoothed average pathogenicity scores against MDP values, with an exponential decay fit shown in red, and each dot represents an amino acid residue. A moving mean with a window of ten residues was applied to reduce noise and clarify trends. A color gradient was used to highlight pathogenic (red), ambiguous (gray), and benign (blue) mutations based on the predicted pathogenicity scores. The R2 value of 0.62 indicates the proportion of variance in MDP explained by the average pathogenicity score. B depicts the MDP and C the average pathogenicity scores along the residue positions of CYP1B1. The average pathogenicity score is shown as a color gradient, with blue indicating benign, gray indicating ambiguous, and red indicating pathogenic mutations. The MDP is displayed in black. This plot integrates multiple disorder predictors, including PONDR® VLXT, PONDR® VL3, PONDR® VSL2, PONDR® FIT, IUPred_long, and IUPred_short, averaged to form the MDP
Fig. 5
Fig. 5
Evaluation of liquid–liquid phase separation propensity of human CYP1B1 by FuzDrop. We assessed the propensity of human CYP1B1 to undergo liquid–liquid phase separation (LLPS) using the FuzDrop computational tool. The overall probability of spontaneous LLPS for CYP1B1 is indicated as 0.3692, suggesting a moderate likelihood of promoting droplet formation. The top panel displays the residue-based droplet-promoting probabilities (pDP) along the CYP1B1 sequence, with higher values indicating regions more likely to promote droplet formation. Below this, the blue bars represent droplet-promoting regions (DPRs), highlighting specific segments within the protein that have a higher propensity for LLPS. The orange bars indicate aggregation hot spots, which are regions that could facilitate the transition from a liquid-like to a solid-like amyloid state, potentially leading to protein aggregation. The bottom panel illustrates the multiplicity of binding modes (MBM), which indicates regions with context-dependent interactions that can switch between disordered and ordered binding states. The plot underneath shows these regions with context-dependent interactions, marked in gray, with specific highlighted segments denoting areas of interest
Fig. 6
Fig. 6
Visualization of predicted intrinsic disorder and functional domains in CYP1B1 using the D2P2 Database. This figure presents the predicted intrinsic disorder and functional domain structure of the CYP1B1 protein. The top section shows regions of disorder as predicted by various algorithms, including Espritz-D, Espritz-X, Espritz-N, IUPred-L, IUPred-S, PV2, PrDOS, VSL2b, and VLXT, each labeled accordingly. The middle section displays the predicted domain structures, highlighting the Cytochrome P450 superfamily domain and Pfam conserved domains within CYP1B1. The predicted SCOP structures are shown in gray, with lighter shading indicating areas of weaker support. Below this, the disorder agreement section illustrates the consensus on predicted disorder across the multiple prediction tools, represented by the black and white bar. Black segments indicate regions of higher predicted disorder. Notably, the analysis revealed no molecular recognition features (MoRFs) or post-translational modifications (PTMs) within the CYP1B1 sequence
Fig. 7
Fig. 7
Protein–protein interaction network of cytochrome P450 1B1 (CYP1B1) revealed by the Search Tool for the Retrieval of Interacting Genes (STRING). A detailed STRING analysis, set at the highest confidence level of 0.900, focuses on the canonical form of CYP1B1. This analysis showcases a dense interaction network, with line thickness indicating the strength of data support. The network includes 56 nodes and 268 edges, demonstrating robust connectivity (average node degree: 9.57) and an average local clustering coefficient of 0.892, indicating a tightly interconnected cluster of proteins. The limit for displaying interactions was set to the maximum allowable number of 500. The observed connectivity significantly exceeds the expected 60 edges, and with a protein–protein interaction (PPI) enrichment p value of less than 1.0e–16

Similar articles

References

    1. Abramson J et al. (2024) Accurate structure prediction of biomolecular interactions with AlphaFold 3. Nature 1:1–3 - PMC - PubMed
    1. Alayu KS, Shibeshi MA, Alemu AM (2022) Spontaneously Arrested Bilateral Primary Congenital Glaucoma: A Case Report From Ethiopia. Ethiop J Health Sci 32(2):463–466 - PMC - PubMed
    1. Alsubait A et al. (2020) CYP1B1 gene: Implications in glaucoma and cancer. J Cancer 11(16):4652–4661 - PMC - PubMed
    1. Andreeva A et al. (2004) SCOP database in 2004: refinements integrate structure and sequence family data. Nucl Acids Res 32:D226–9 - PMC - PubMed
    1. Badawi AH et al. (2019) Primary congenital glaucoma: An updated review. Saudi J Ophthalmol 33(4):382–388 - PMC - PubMed

LinkOut - more resources