Identification of hub genes and prediction of the ceRNA network in adult sepsis
- PMID: 40821971
- PMCID: PMC12357545
- DOI: 10.7717/peerj.19619
Identification of hub genes and prediction of the ceRNA network in adult sepsis
Abstract
Background: Sepsis refers to a dysregulated host immune response to infection. It carries a high risk of morbidity and mortality, and its pathogenesis has yet to be fully elucidated. The main aim of this study was to identify prognostic hub genes for sepsis and to predict a competitive endogenous RNA (ceRNA) network that regulates the hub genes.
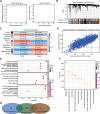
Methods: Six transcriptome datasets from the peripheral blood of septic patients were retrieved from the Gene Expression Omnibus (GEO) database. The robust rank aggregation (RRA) method was used to screen differentially expressed genes (DEGs) across these datasets. A comprehensive bioinformatics investigation was conducted, encompassing Gene Ontology (GO) and Kyoto Encyclopedia of Genes and Genomes (KEGG) pathway enrichment analyses using the "clusterProfiler" package in R, as well as gene set enrichment analysis (GSEA) to further elucidate the biological functions and pathways associated with the DEGs. Weighted gene co-expression network analysis (WGCNA) was performed to identify a module significantly associated with sepsis. Integration of this module with protein-protein interaction (PPI) network analysis facilitated the identification of five hub genes. These hub genes were subsequently validated using an independent dataset and reverse transcription-quantitative polymerase chain reaction (RT-qPCR) analysis of peripheral blood samples from septic patients. The prognostic values of these hub genes were assessed via receiver operating characteristic (ROC) curve analysis. Finally, a ceRNA network regulating the prognostic hub genes was constructed by integrating data from a literature review as well as five online databases.
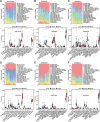
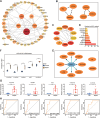
Results: RRA analysis identified 164 DEGs across six training cohorts. Bioinformatics analyses revealed concurrent hyperinflammation and immunosuppression in sepsis patients. Five hub genes were identified via WGCNA and PPI network analysis, and their differential expression was verified by the validation dataset (GSE28750) and RT-qPCR analysis in the peripheral blood of septic patients. ROC analysis confirmed four hub genes with prognostic value, and a ceRNA network was predicted to elucidate their regulatory mechanisms.
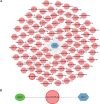
Conclusion: This study identified four hub genes (CLEC4D, GPR84, S100A12, and HK3) with significant prognostic value in sepsis and predicted a ceRNA network (NEAT1-hsa-miR-495-3p-ELF1) regulating their expression. The integrated analysis reconfirmed the concurrent presence of hyperinflammation and immunosuppression in hospitalized sepsis patients. These findings enhance the understanding of sepsis pathogenesis and identify potential therapeutic targets.
Keywords: Inflammation; Peripheral blood; Prognostic biomarker; RRA; WGCNA.
©2025 Xue et al.
Conflict of interest statement
The authors declare there are no competing interests.
Figures


Similar articles
-
The mitochondrial hub gene UCHL1 May serve as a potential biomarker for diagnosing diabetic cardiomyopathy: a comprehensive integration of biological pathways.BMC Med Genomics. 2025 Aug 11;18(1):129. doi: 10.1186/s12920-025-02199-0. BMC Med Genomics. 2025. PMID: 40790764 Free PMC article.
-
Identification of shared key genes and pathways in osteoarthritis and sarcopenia patients based on bioinformatics analysis.Zhong Nan Da Xue Xue Bao Yi Xue Ban. 2025 Mar 28;50(3):430-446. doi: 10.11817/j.issn.1672-7347.2025.240669. Zhong Nan Da Xue Xue Bao Yi Xue Ban. 2025. PMID: 40628511 Chinese, English.
-
Identification and experimental validation of ulcerative colitis-associated hub genes through integrated WGCNA and lysosomal autophagy analysis.Hum Genomics. 2025 Jul 1;19(1):74. doi: 10.1186/s40246-025-00783-0. Hum Genomics. 2025. PMID: 40597456 Free PMC article.
-
Lactate-related genes signature as a novel prognostic landscape in laryngeal squamous cell carcinoma: insights from 156 machine learning algorithms and in vitro validation.Int J Biol Macromol. 2025 Aug 24;323(Pt 1):147098. doi: 10.1016/j.ijbiomac.2025.147098. Online ahead of print. Int J Biol Macromol. 2025. PMID: 40858160 Review.
-
Probing the code of chronic urticaria pathogenesis: how the ceRNA network regulates mast cell activation.Int Arch Allergy Immunol. 2025 Aug 22:1-15. doi: 10.1159/000547368. Online ahead of print. Int Arch Allergy Immunol. 2025. PMID: 40875714 Review.
References
-
- Barrett T, Wilhite SE, Ledoux P, Evangelista C, Kim IF, Tomashevsky M, Marshall KA, Phillippy KH, Sherman PM, Holko M, Yefanov A, Lee H, Zhang N, Robertson CL, Serova N, Davis S, Soboleva A. NCBI GEO: archive for functional genomics data sets–update. Nucleic Acids Research. 2013;41(D1):D991–D995. doi: 10.1093/nar/gks1193. - DOI - PMC - PubMed
MeSH terms
Substances
LinkOut - more resources
Full Text Sources
Medical
Research Materials
Miscellaneous

