

Comparison of the efficacy of 12 interventions in the treatment of diabetic foot ulcers: a network meta-analysis
- PMID: 40821981
- PMCID: PMC12352421
- DOI: 10.7717/peerj.19809
Comparison of the efficacy of 12 interventions in the treatment of diabetic foot ulcers: a network meta-analysis
Abstract
Objective: This study aimed to comprehensively compare the efficacy of 12 interventions for diabetic foot ulcer (DFU) using a network meta-analysis (NMA).
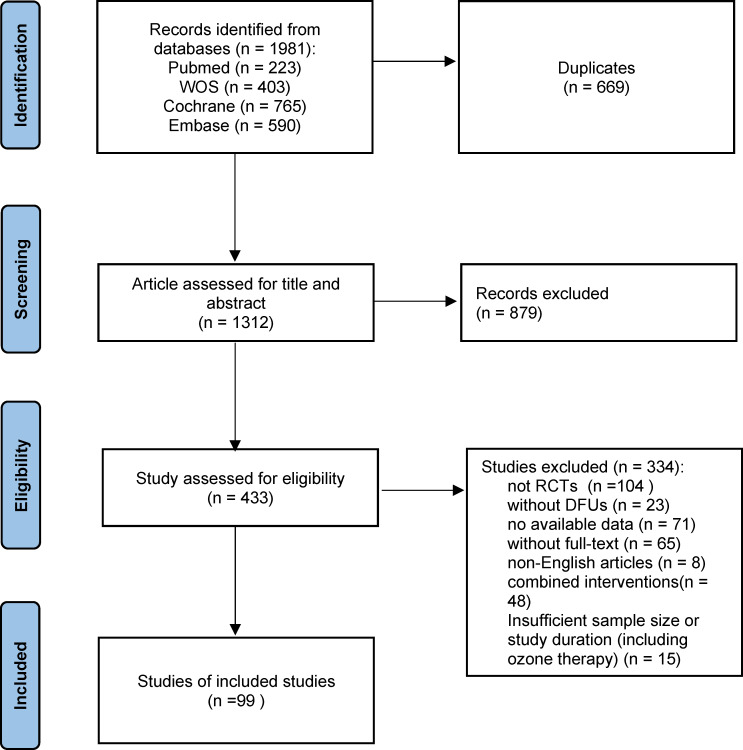
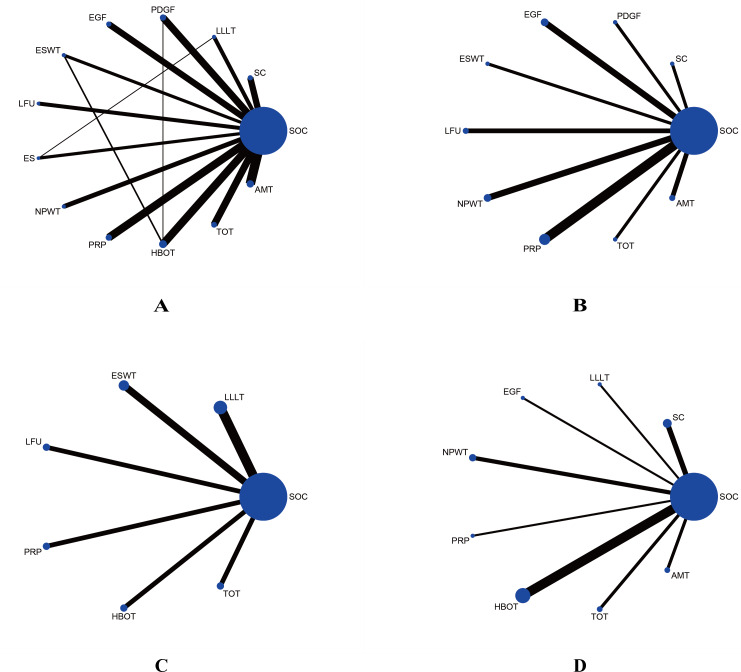
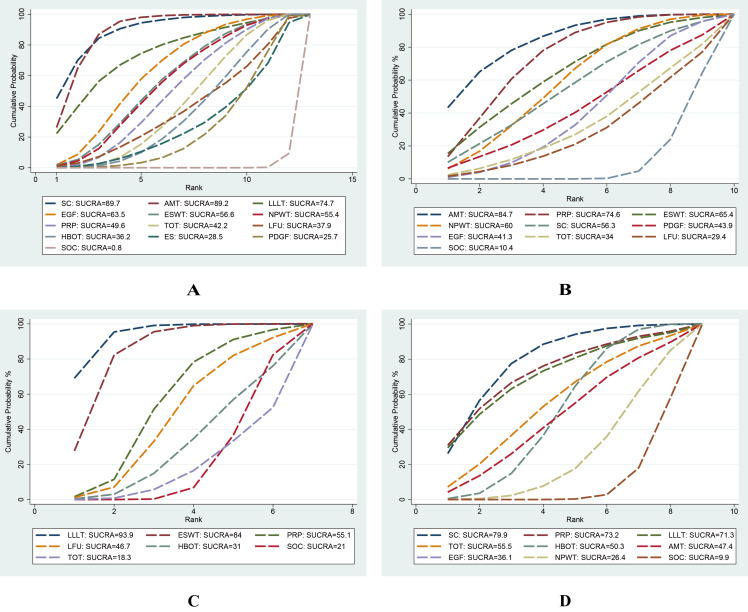
Methods: The NMA was conducted by PRISMA guidelines, and the protocol was registered in PROSPERO (CRD42023461811). PubMed, Web of Science, Cochrane Library, and Embase databases were systematically searched from inception to September 2023. Randomized controlled trials (RCTs) enrolling patients with DFU were included if they compared epidermal growth factor (EGF), platelet-derived growth factor (PDGF), platelet-rich plasma (PRP), stem cells (SC), low-frequency ultrasound (LFU), negative pressure wound therapy (NPWT), low-level laser therapy (LLLT), electric stimulation (ES), extracorporeal shockwave therapy (ESWT), amniotic membrane therapy (AMT), hyperbaric oxygen therapy (HBOT), and topical oxygen therapy (TOT) against standard of care (SOC) or placebo. The primary endpoint assessed was the wound healing rate. Secondary endpoints comprised wound healing time, percentage area reduction (PAR), and amputation rate. The surface under the cumulative ranking curve (SUCRA) was calculated to rank the efficacy of interventions.
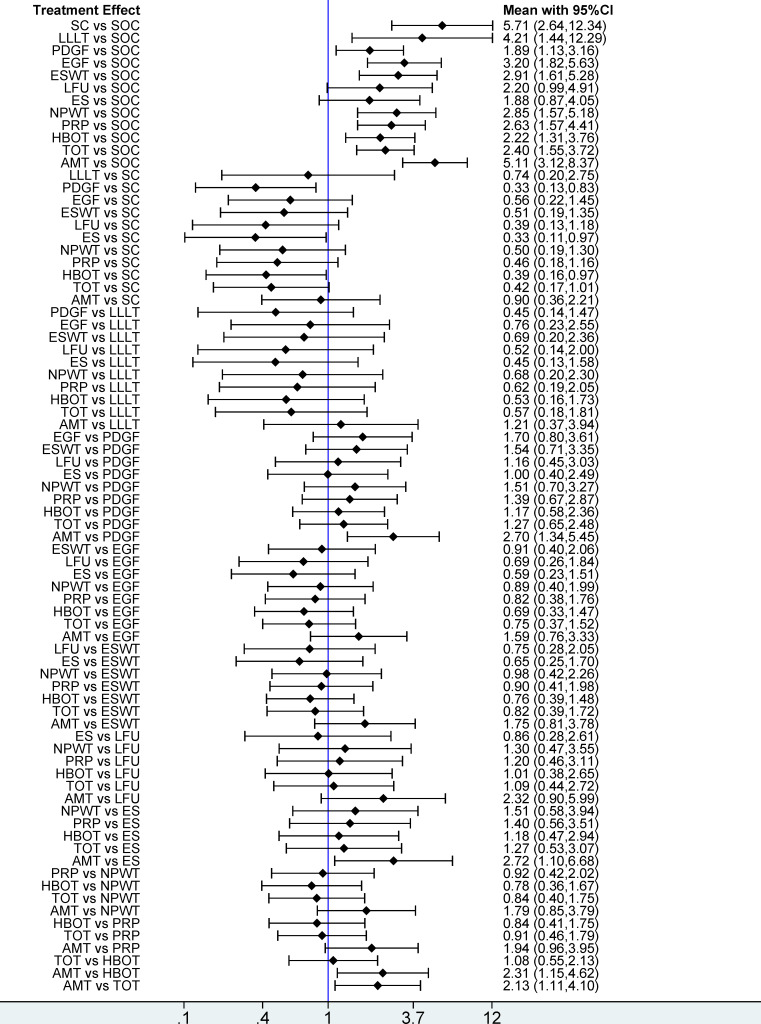
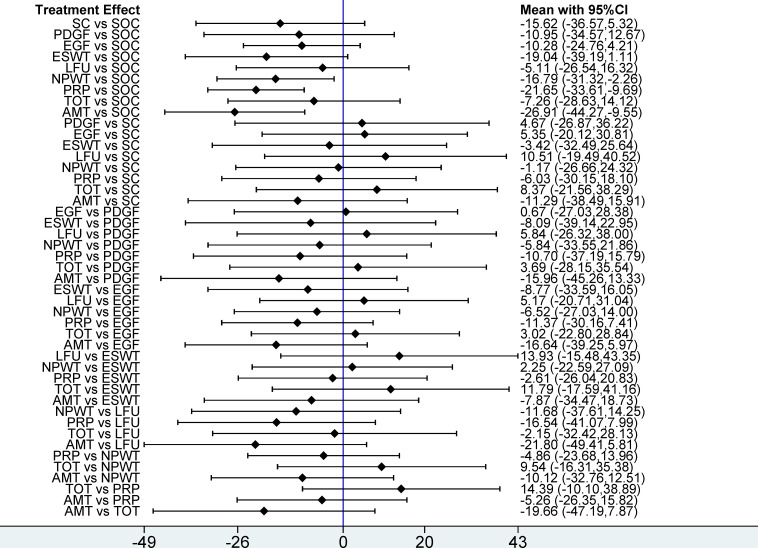
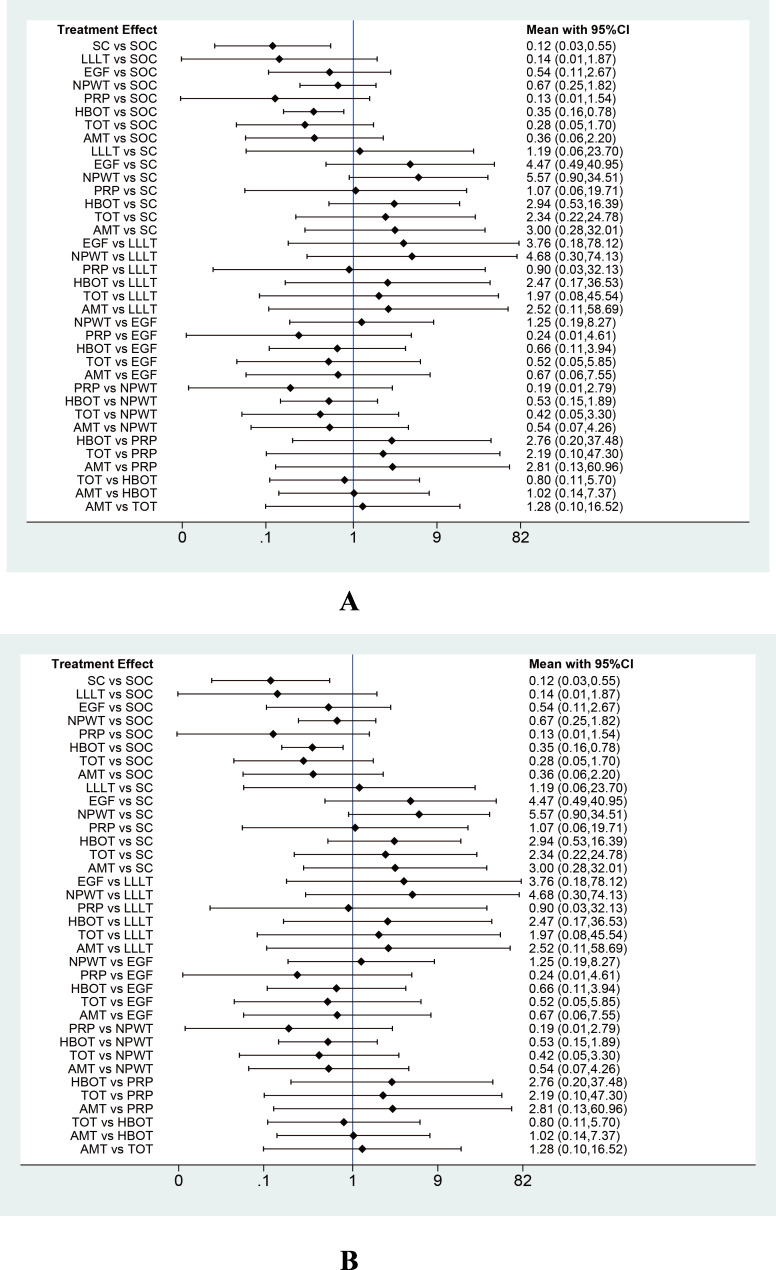
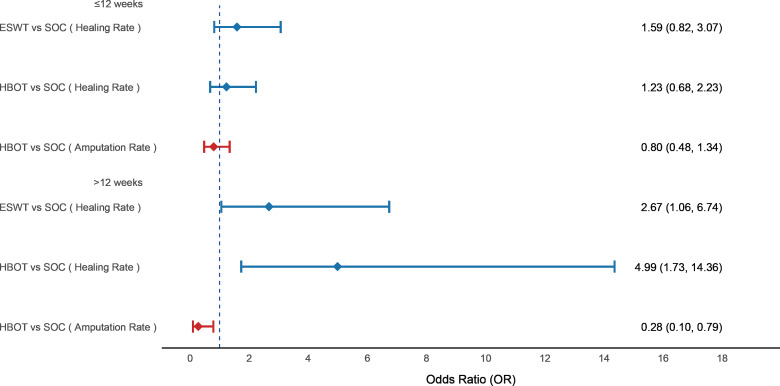
Results: A total of 99 RCTs involving 7,356 patients were included. Among the 12 interventions analyzed, only LFU (OR = 2.20; 95% CI [0.99-4.91]) and ES (OR = 1.88; 95% CI [0.87-4.05]) did not demonstrate statistically significant improvements in ulcer healing rate compared with SOC. Based on SUCRA rankings, SC (SUCRA = 89.7%; OR = 5.71; 95% CI [2.64-12.34]) and AMT (SUCRA = 89.2%; OR = 5.11; 95% CI [3.12-8.37]) ranked highest in promoting ulcer healing, while LFU (29.4%) and SOC (10.4%) ranked lowest. Regarding wound healing time, AMT (MD = -26.91 days; 95% CI [-44.27 to -9.55]), PRP (MD = -21.65 days; 95% CI [-33.61 to -9.69]), and NPWT (MD = -16.79 days; 95% CI [-31.12 to -2.26]) significantly reduced healing durations compared to SOC. SUCRA rankings indicated that AMT (84.7%) and PRP (74.6%) ranked highest, while LFU (29.4%) and SOC (10.4%) remained lowest. Concerning PAR, LLLT (MD = 34.27; 95% CI [17.35-51.20]) and ESWT (MD = 27.50; 95% CI [11.00-44.00]) showed significant improvements over SOC, with LLLT (SUCRA = 93.9%) and ESWT (SUCRA = 84.0%) ranking highest, while SOC (21.0%) and TOT (18.3%) ranked lowest. For amputation rate, SC (OR = 0.12; 95% CI [0.03-0.55]) and HBOT (OR = 0.35; 95% CI [0.16-0.78]) significantly lowered the risk compared to SOC, with SUCRA rankings placing SC (79.9%) and PRP (73.2%) as most effective, while NPWT (26.4%) and SOC (9.9%) were least effective.
Conclusions: SC and AMT emerged as highly effective, demonstrating superior efficacy in improving healing rate compared to PDGF, ES, and HBOT. AMT also showed significant effects in shortening ulcer healing time. LLLT exhibited considerable effectiveness in reducing ulcer areas, and SC therapy was associated with reduced amputation rate.
Keywords: Amputation rate; Diabetic foot ulcers; Network meta-analysis; Percentage area reduction; Wound healing rate; Wound healing time.
©2025 Hu et al.
Conflict of interest statement
The authors declare there are no competing interests.
Figures
Similar articles
-
Comparison of the efficacy and safety of different growth factors in the treatment of diabetic foot ulcers: an updated network meta-analysis.Front Endocrinol (Lausanne). 2025 Jun 25;16:1614597. doi: 10.3389/fendo.2025.1614597. eCollection 2025. Front Endocrinol (Lausanne). 2025. PMID: 40636711 Free PMC article.
-
Comparative efficacy of gas therapy for diabetic foot ulcers using network meta-analysis.PeerJ. 2025 Jun 16;13:e19571. doi: 10.7717/peerj.19571. eCollection 2025. PeerJ. 2025. PMID: 40538733 Free PMC article.
-
Effectiveness of most common adjuvant wound treatments (skin substitutes, negative pressure wound therapy, hyperbaric oxygen therapy, platelet-rich plasma/fibrin, and growth factors) for the management of hard-to-heal diabetic foot ulcers: a meta-analysis of randomized controlled trials for the development of the Italian Guidelines for the Treatment of Diabetic Foot Syndrome.Acta Diabetol. 2025 Jul;62(7):1081-1095. doi: 10.1007/s00592-024-02426-7. Epub 2024 Dec 26. Acta Diabetol. 2025. PMID: 39724338
-
Systemic pharmacological treatments for chronic plaque psoriasis: a network meta-analysis.Cochrane Database Syst Rev. 2017 Dec 22;12(12):CD011535. doi: 10.1002/14651858.CD011535.pub2. Cochrane Database Syst Rev. 2017. Update in: Cochrane Database Syst Rev. 2020 Jan 9;1:CD011535. doi: 10.1002/14651858.CD011535.pub3. PMID: 29271481 Free PMC article. Updated.
-
Systemic pharmacological treatments for chronic plaque psoriasis: a network meta-analysis.Cochrane Database Syst Rev. 2021 Apr 19;4(4):CD011535. doi: 10.1002/14651858.CD011535.pub4. Cochrane Database Syst Rev. 2021. Update in: Cochrane Database Syst Rev. 2022 May 23;5:CD011535. doi: 10.1002/14651858.CD011535.pub5. PMID: 33871055 Free PMC article. Updated.
References
-
- Abd El Fattah AM, El Deen Dawood A, Gawish H, Shaaban M, El Mashad N. Effect of ultrasound-assisted debridement on wound healing and infection outcomes in diabetic foot. Menoufia Medical Journal. 2018;31(2):462–466.
-
- Abidia A, Laden G, Kuhan G, Johnson BF, Wilkinson AR, Renwick PM, Masson EA, McCollum PT. The role of hyperbaric oxygen therapy in ischaemic diabetic lower extremity ulcers: a double-blind randomised-controlled trial. European Journal of Vascular and Endovascular Surgery. 2003;25:513–518. doi: 10.1053/ejvs.2002.1911. - DOI - PubMed
-
- Afshari M, Larijani B, Fadayee M, Darvishzadeh F, Ghahary A, Pajouhi M, Bastanhagh MH, Baradar-Jalili R, Vassigh AR. Efficacy of topical epidermal growth factor in healing diabetic foot ulcers. Therapy. 2005;2:759–765. doi: 10.1586/14750708.2.5.759. - DOI
-
- Agrawal RP, Jhajharia A, Mohta N, Dogra R, Chaudhari V, Nayak KC. Use of a platelet-derived growth factor gel in chronic diabetic foot ulcers. Diabetic Foot Journal. 2009;12:80–88.
Publication types
MeSH terms
LinkOut - more resources
Full Text Sources
Research Materials
