

Physics-Based Spatial Oversampling of TROPOMI NO2 Observations to US Neighborhoods Reveals the Disparities of Air Pollution
- PMID: 40822114
- PMCID: PMC12357153
- DOI: 10.1029/2025GH001423
Physics-Based Spatial Oversampling of TROPOMI NO2 Observations to US Neighborhoods Reveals the Disparities of Air Pollution
Abstract
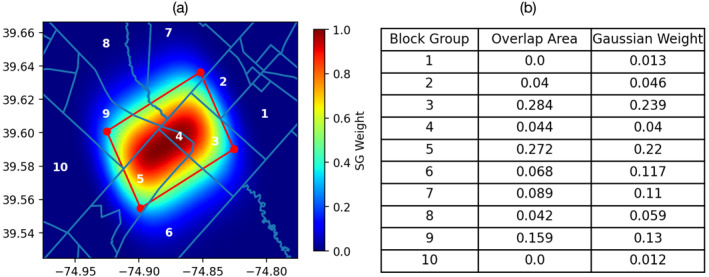
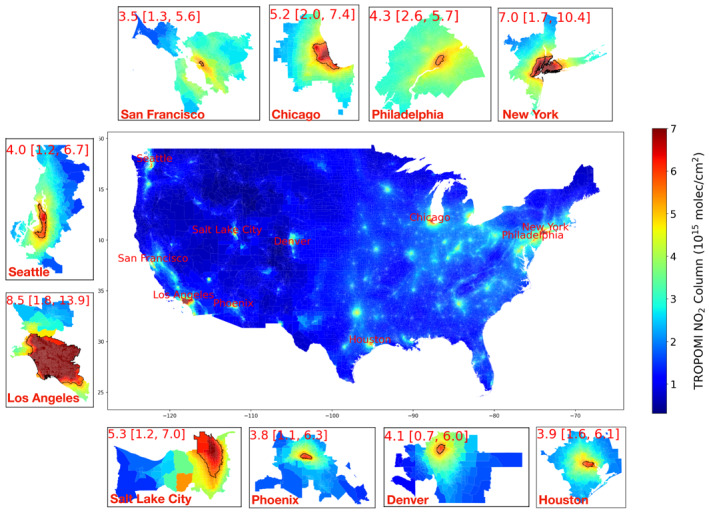
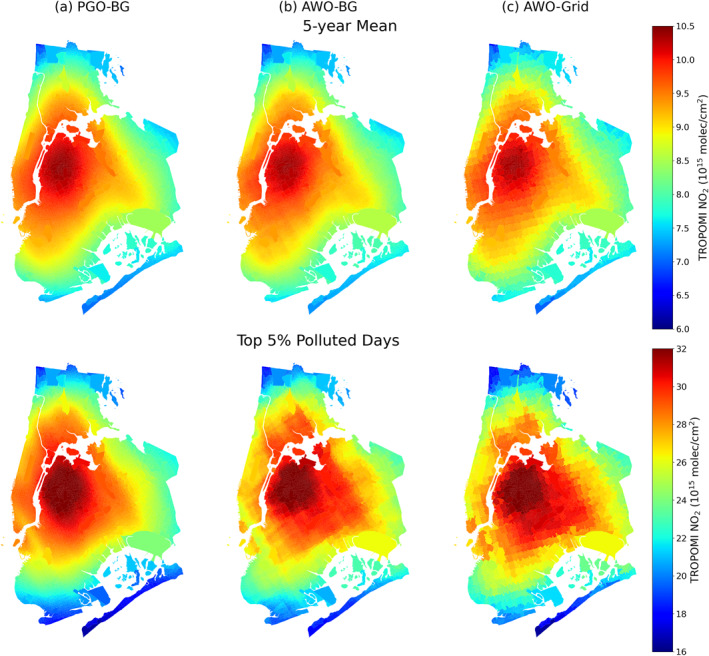
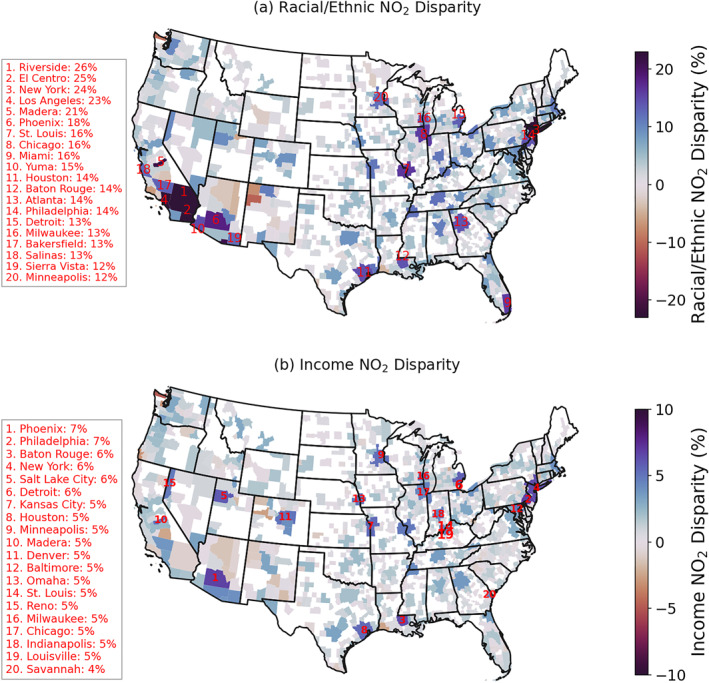
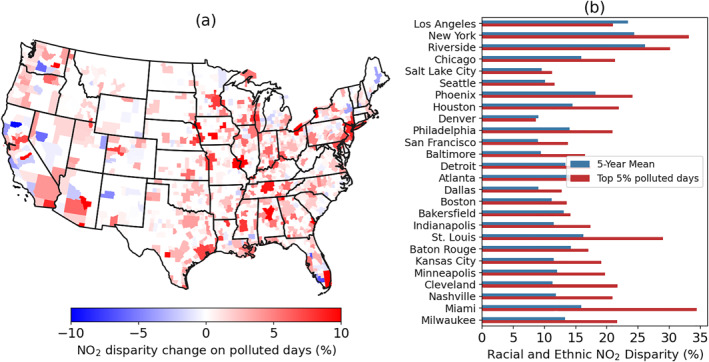
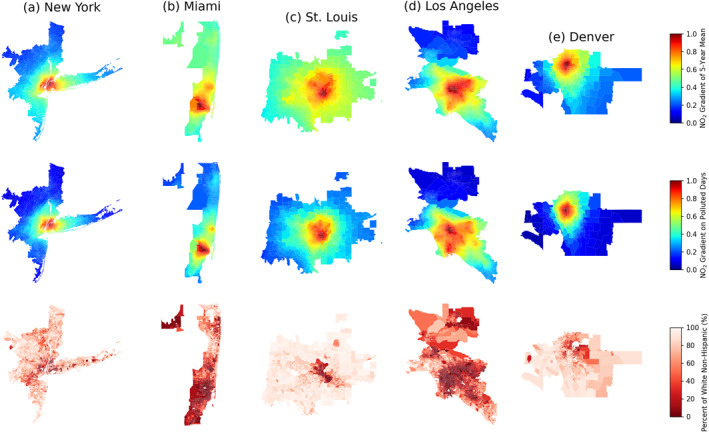
Satellite observations provide continuous and global coverage observations of air pollutants, widely used to inform health impacts and air pollution disparities. Linking satellite retrievals with socioeconomic or health data involves matching the irregularly shaped satellite observations with administrative units. Here, we develop a physics-based approach to spatially oversample nitrogen dioxide (NO2) retrievals from TROPOspheric Monitoring Instrument (TROPOMI) directly to United States (US) neighborhoods (i.e., block groups). The physics-based oversampling approach considers each satellite pixel as a sensitivity distribution, meaning that satellite instruments are more sensitive to the neighborhoods at the center than at the edge of the observations. We show that directly oversampling satellite observations to administrative shapes is a more accurate and computationally efficient approach than the commonly used gridding approaches, and it is advantageous for shorter temporal windows. Combining the newly developed NO2 data set with demographic data, we find widespread racial/ethnic and income-related NO2 disparities across the US. NO2 disparities are even more pronounced during the most polluted days, suggesting greater acute health effects for overburdened communities. We expect that the resolution-adaptive, neighborhood-level, and GIS-compatible NO2 data set would lower barriers of the public to access and interpret satellite observations, facilitating the actionable applications of satellite observations.
Keywords: NO2; TROPOMI; air pollution disparity; environmental justice; remote sensing; spatial oversampling.
© 2025 The Author(s). GeoHealth published by Wiley Periodicals LLC on behalf of American Geophysical Union.
Conflict of interest statement
The authors declare no conflicts of interest relevant to this study.
Figures
Similar articles
-
Spatiotemporal mapping and assessment of daily ground NO2 concentrations in China using high-resolution TROPOMI retrievals.Environ Pollut. 2021 Mar 15;273:116456. doi: 10.1016/j.envpol.2021.116456. Epub 2021 Jan 8. Environ Pollut. 2021. PMID: 33477063
-
Prescription of Controlled Substances: Benefits and Risks.2025 Jul 6. In: StatPearls [Internet]. Treasure Island (FL): StatPearls Publishing; 2025 Jan–. 2025 Jul 6. In: StatPearls [Internet]. Treasure Island (FL): StatPearls Publishing; 2025 Jan–. PMID: 30726003 Free Books & Documents.
-
Potential Errors in CMAQ NO:NO2 Ratios and Upper Tropospheric NO2 Impacting the Interpretation of TROPOMI Retrievals.ACS EST Air. 2025 Apr 29;2(6):998-1008. doi: 10.1021/acsestair.4c00198. eCollection 2025 Jun 13. ACS EST Air. 2025. PMID: 40534900 Free PMC article.
-
The Black Book of Psychotropic Dosing and Monitoring.Psychopharmacol Bull. 2024 Jul 8;54(3):8-59. Psychopharmacol Bull. 2024. PMID: 38993656 Free PMC article. Review.
-
Individual-level interventions to reduce personal exposure to outdoor air pollution and their effects on people with long-term respiratory conditions.Cochrane Database Syst Rev. 2021 Aug 9;8(8):CD013441. doi: 10.1002/14651858.CD013441.pub2. Cochrane Database Syst Rev. 2021. PMID: 34368949 Free PMC article.
References
-
- Bluhm, R. , Polonik, P. , Hemes, K. S. , Sanford, L. C. , Benz, S. A. , Levy, M. C. , et al. (2022). Disparate air pollution reductions during California’s COVID‐19 economic shutdown. Nature Sustainability, 5(6), 509–517. 10.1038/s41893-022-00856-1 - DOI
-
- Chen, R. , Samoli, E. , Wong, C.‐M. , Huang, W. , Wang, Z. , Chen, B. , & Kan, H. (2012). Associations between short‐term exposure to nitrogen dioxide and mortality in 17 Chinese cities: The China air Pollution and Health Effects Study (CAPES). Environment International, 45, 32–38. 10.1016/j.envint.2012.04.008 - DOI - PubMed
LinkOut - more resources
Full Text Sources