. 2025 Aug 14:8:0772.
doi: 10.34133/research.0772. eCollection 2025.

Light-Triggered Graphene/Black Phosphorus Heterostructure FET Platform for Ultrasensitive Detection of Alzheimer's Disease Biomarkers at the Zeptomole Level

Affiliations

Light-Triggered Graphene/Black Phosphorus Heterostructure FET Platform for Ultrasensitive Detection of Alzheimer's Disease Biomarkers at the Zeptomole Level

Huide Wang et al. Research (Wash D C). .

Abstract

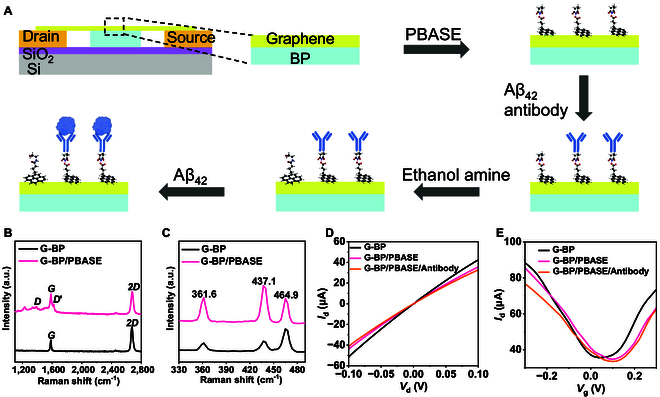
Due to the low concentration of amyloid-beta (Aβ) in plasma and the high content of interfering factors, the conventional detection method for the quantification of Aβ still faces the problem of insufficient limit of detection (LOD). In this work, we propose a new light-triggered graphene-black phosphorus heterostructure (G-BP) field-effect transistor (FET) biosensing platform that achieves a ​​marked​​ reduction in the LOD. The LOD for Alzheimer's disease (AD) biomarker Aβ42 detection using the G-BP FET is as low as 235.1 zM (2.351 × 10⁻¹⁹ M), which is the lowest value reported to date and is approximately 2 to 3 orders of magnitude lower than other reported biosensing platforms. The G-BP FET platform provides precise, real-time guidance for non-invasive early diagnosis, disease monitoring, and personalized treatment plans for AD. Moreover, this method has good scalability and potential applications in other areas, including early detection of cancer and other major chronic diseases.


Conflict of interest statement

Competing interests: The authors declare that they have no competing interests.

Figures

Fig. 1.
Fig. 1.
Schematic diagram of G-BP FET biosensor operation procedure. (A) Schematic diagram of the Aβ42 antigen. (B) Structural and principle diagram of light-triggered G-BP FET. (C) Effect of light on the detection of LOD of Aβ42 protein by the G-BP FET biosensor. In the dark state, the LOD of the G-BP FET biosensor is 2.767 aM. In the light state, the LOD of the G-BP FET biosensor is 235.1 zM.
Fig. 2.
Fig. 2.
Construction and characterization of the G-BP FET biosensor. (A) Schematic diagram of G-BP FET functionalization and detection of Aβ42 protein. (B) Raman spectra (1,100 to 2,800 cm−1) of G-BP before and after modification of PBASE. (C) Raman spectra (330 to 490 cm−1) of G-BP before and after modification of PBASE. (D) Output characteristic curve of G-BP FET during functionalization (PBASE and antibody modifications). (E) Transfer characteristic curve of G-BP FET during functionalization (Vd = 0.1 V).
Fig. 3.
Fig. 3.
Mechanism of electrostatic photogating. (A) Schematic illustration of Aβ42 protein detection by G-BP FET using the electrostatic photogating mechanism. (B) Energy band changes before and after the formation of heterojunction between G and BP. (C) Energy band variation diagram of G-BP in the electrostatic gating process. (D) Energy band variation diagram of G-BP in the photogating process. (E) Energy band variation diagram of G-BP in the electrostatic photogating process.
Fig. 4.
Fig. 4.
42 biomarker detection. (A) Schematic diagram of detecting Aβ42 by G-BP FET. (B) The transfer characteristic curve of Aβ42 was detected by G-BP FET (Vd = 0.1 V). (C) Real-time response of G-BP FET to Aβ42 in 0.001× PBS in the dark state. (D) The response curve of the G-BP FET biosensor changed with time after adding Aβ42 with a concentration of 0 to 100 pM to 0.001× PBS. From 20 s onwards, the device is exposed to light. (E) Relationship between Aβ42 concentration and response signal. The intersection of noise level and curve is LOD. LOD is 2.767 aM in the dark and 235.1 zM in the light. (F) The response time of 10 fM Aβ42 was detected in the dark state. (G) Light response time of the G-BP FET sensor under different Aβ42 concentrations. (H) The performance of this work was compared with other methods for the detection of Aβ42.
Fig. 5.
Fig. 5.
Specificity verification of the G-BP FET biosensor. (A) Real-time response of G-BP FET to Aβ38 in 0.001× PBS. (B) Real-time response of G-BP FET to Aβ40 in 0.001× PBS. (C) Real-time response of G-BP FET to mixed peptides in 0.001× PBS. (D) Response signals of PBS (0.001×), Aβ38 (100 pM), Aβ40 (100 pM), mixed peptides (100 pM), and Aβ42 (100 pM and 100 pM + light).

References

    1. Scheltens P, De Strooper B, Kivipelto M, Holstege H, Chetelat G, Teunissen CE, Cummings J, Flier WM. Alzheimer’s disease. Lancet. 2021;397(10284):1577–1590. - PMC - PubMed
    1. Zhang L, Du X, Su Y, Niu S, Li Y, Liang X, Luo H. Quantitative assessment of ad markers using naked eyes: Point-of-care testing with paper-based lateral flow immunoassay. J Nanobiotechnol. 2021;19(1):366. - PMC - PubMed
    1. Armstrong RA. The pathogenesis of Alzheimer’s disease: A reevaluation of the “amyloid cascade hypothesis”. Int J Alzheimers Dis. 2011;2011(1):630865. - PMC - PubMed
    1. Khachaturian ZS. Diagnosis of Alzheimer’s disease. Arch Neurol. 1985;42(11):1097–1105. - PubMed
    1. Mirra SS, Heyman A, McKeel D, Sumi S, Crain BJ, Brownlee L, Vogel F, Hughes J, Belle G, Berg L. The Consortium to Establish a Registry for Alzheimer’s disease (Cerad). Part II. Standardization of the neuropathologic assessment of Alzheimer’s disease. Neurology. 1991;41(4):479–479. - PubMed

LinkOut - more resources