Review
. 2025 Aug 13:9:25424823251367046.
doi: 10.1177/25424823251367046. eCollection 2025 Jan-Dec.

Bibliometric analysis of pathological mechanisms in Alzheimer's disease: Applications based on mouse models

Affiliations
Review

Bibliometric analysis of pathological mechanisms in Alzheimer's disease: Applications based on mouse models

Jinjiang Li et al. J Alzheimers Dis Rep. .

Abstract

Background: Alzheimer's disease (AD) is a progressive neurodegenerative disorder marked by memory loss and cognitive decline. Animal models play a key role in exploring its pathophysiological mechanisms.

Objective: To analyze global research trends and knowledge structure in AD pathophysiological mechanisms based on animal models.

Methods: Publications from 2014 to 2023 were retrieved from the Web of Science Core Collection. CiteSpace and VOSviewer were used for bibliometric analysis and data visualization.

Results: A total of 2169 publications were identified, with a steady growth trend. The United States and China were the leading contributors, with Harvard University as a major collaborative hub. The Journal of Alzheimer's Disease published the most articles, while the Journal of Neuroscience had the highest co-citation frequency. Holtzman DM was a key author in the field. Nine keyword clusters were identified, including insulin resistance, amyloid beta, and oxidative stress. Emerging topics include synapse loss, gut microbiota, and NLRP3 inflammasome.

Conclusions: This study provides a concise overview of global research on AD pathophysiological mechanisms in animal models, offering valuable insights for future research directions.

Keywords: Alzheimer's disease; animal model; bibliometrics; mice; pathology.


Conflict of interest statement

The authors declared no potential conflicts of interest with respect to the research, authorship, and/or publication of this article.

Figures
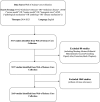
Figure 1.
Figure 1.
Flowchart of the literature search and screening process.
Figure 2.
Figure 2.
The bar chart illustrates the publication trend in this field from 2014 to 2023.
Figure 3.
Figure 3.
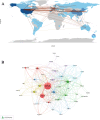
Analysis of countries/regions in the field. (A) A global collaboration map generated using the Bibliometrix R package. Each line represents collaborative relationships between countries/regions based on data from the Web of Science Core Collection (2014–2023). The thickness of the lines indicates the strength of collaboration, while the color intensity reflects the number of publications from each country. (B) A global collaboration network visualization created with VOSviewer. The size of each node represents the number of publications from that country/region, and the links between nodes indicate collaborative relationships. Different colors distinguish clusters of countries with close collaborative ties.
Figure 4.
Figure 4.
Analysis of institutions in the field using citeSpace. Each node represents a research institution, with its size proportional to the number of publications produced by that institution. The connections between nodes indicate collaborative relationships among institutions. Purple rings around nodes indicate high betweenness centrality, with deeper purple color reflecting greater centrality.
Figure 5.
Figure 5.
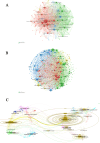
Analysis of journals in the field. (A) A journal collaboration network visualization created with VOSviewer. The size of each node represents the number of publications for each journal, and the links between nodes indicate collaboration relationships. Different colors represent clusters of journals with frequent collaborations. (B) A journal co-citation network visualization created with VOSviewer. Node size reflects the total co-citation frequency of each journal, and the links indicate how often journals are cited together. Different colors indicate clusters of journals that are commonly co-cited. (C) A journal dual-map overlay generated with CiteSpace. The map displays citing journals on the left and cited journals on the right. Each ellipse represents a journal, where vertical length indicates the number of publications and horizontal length indicates the number of contributing authors. Colored curved lines represent citation paths, illustrating interdisciplinary citation relationships across research domains.
Figure 6.
Figure 6.
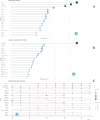
Analysis of leading authors in the field using the bibliometrix R package. (A) Top 20 Authors by Publication Count. (B) Top 20 Authors by Citation Frequency. (C) Trends in Annual Publications and Citation Frequencies (2014–2023) for the Top 20 Authors. Circle size reflects the number of publications, while color intensity represents the citation impact of each author.
Figure 7.
Figure 7.
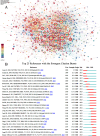
Analysis of references in the field using citeSpace. (A) Bibliometric analysis of co-cited references in this field. Each node represents a cited reference, with node size indicating the total number of citations. The color intensity reflects the citation impact. (B) Burst analysis of references in the field. Each horizontal bar represents a reference, with the red segment indicating the period during which the reference experienced a surge in citations.
Figure 8.
Figure 8.
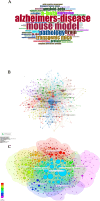
Analysis of keywords in the field. (A) Keyword word cloud generated using the Bibliometrix R package. (B) Keyword co-occurrence network visualization generated with VOSviewer. Each node represents a keyword, and the size of the node reflects its frequency of occurrence in the literature. The links between nodes indicate co-occurrence relationships, with thicker lines representing higher co-occurrence frequency. Different colors represent thematic clusters automatically identified by the algorithm. (C) Cluster analysis of keywords generated with CiteSpace. Colors represent different clusters, displaying the nine largest clusters.
Figure 9.
Figure 9.
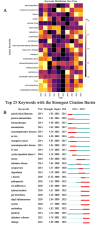
Analysis of keyword heatmap in the field. (A) Annual heatmap of keywords from 2014 to 2023. Each row represents a keyword, and the color intensity across years indicates its relative importance or level of attention in that year; brighter colors represent higher attention. (B) Burst detection analysis of keywords. Each horizontal bar represents a keyword, with the red segment indicating the period during which the keyword experienced a surge in citations.

References

    1. Querfurth HW, LaFerla FM. Alzheimer’s disease. N Engl J Med 2010; 362: 329–344. - PubMed
    1. Graff-Radford J, Yong KXX, Apostolova LG, et al. New insights into atypical Alzheimer’s disease in the era of biomarkers. Lancet Neurol 2021; 20: 222–234. - PMC - PubMed
    1. Santana I, Farinha F, Freitas S, et al. The epidemiology of dementia and Alzheimer disease in Portugal: estimations of prevalence and treatment-costs. Acta Med Port 2015; 28: 182–188. - PubMed
    1. Alzheimer’s Association . 2025 Alzheimer’s disease facts and figures. Alzheimers Dement 2025; 21: e70235.
    1. Duthey B. Background Paper 6.11: Alzheimer disease and other dementias, update on 2004. Geneva: World Health Organization, 2013.

LinkOut - more resources