. 2025 Aug 11;11(4):01016-2024.
doi: 10.1183/23120541.01016-2024. eCollection 2025 Jul.

C-BIOPRED severe asthma clinical phenotypes: link to complement and coagulation pathways and galectin 10

Affiliations

C-BIOPRED severe asthma clinical phenotypes: link to complement and coagulation pathways and galectin 10

Changxing Ou et al. ERJ Open Res. .

Abstract

Background: Severe asthma is a heterogeneous airway inflammatory disease presenting with varying clinicophysiological characteristics and response to treatments. The objectives of the present study were to determine the clinical phenotypes of the Chinese C-BIOPRED cohort and their link to the sputum proteome.

Methods: Partition-around-medoids clustering was applied to a training set of 362 nonsmoking, smoking or ex-smoking severe asthma patients, and nonsmoking mild-moderate asthma patients using eight clinicophysiological variables, with validation performed in the remaining 181.

Results: Three stable clusters were defined, with Cluster T1 composed of predominantly female patients with severe nonsmoking asthma experiencing frequent exacerbations with moderate airflow obstruction, and Cluster T3 of elderly male patients with smoking/ex-smoking late-onset severe asthma and severe airflow obstruction and a moderate number of exacerbations. Cluster T2 was composed of nonsmokers with a mild-moderate airflow obstruction and no previous exacerbations. Validation clusters (V1, V2 and V3) were similar to the training set clusters. Differentially expressed proteins in sputum supernatants measured by liquid chromatography with tandem mass spectrometry pointed to differences in the complement and coagulation cascade pathway between Cluster 1 (T1 and V1) and Cluster 3 (T3 and V3), as well as between Cluster 2 (T2 and V2) and Cluster 3. Galectin 10 was upregulated in Cluster 1 compared with Cluster 2, and correlated with exacerbations, fractional exhaled nitric oxide, blood and sputum eosinophil count and oral corticosteroid dose in Cluster 1.

Conclusion: The clinical clusters were differentiated by smoking status, degree of airflow obstruction and exacerbation history, and by sputum complement and coagulation pathways, and galectin 10 levels.


Conflict of interest statement

Conflict of interest: K.F. Chung reports personal fees from attending advisory board meetings with GSK, AZ, Novartis, Roche, Merck, Trevi, Rickett-Beckinson, Nocion and Shionogi; is a scientific adviser to The Clean Breathing Institute supported by Haleon; reports personal fees for speaking at meetings supported by GSK, Sanofi, Novartis and AZ; and, through his institution, has received research funding from Merck and GSK. The other authors have no relevant conflicts of interest.

Figures

None
Overview of the study. LC: liquid chromatography; MS: mass spectrometry; GO: Gene Ontology; KEGG: Kyoto Encyclopedia of Genes and Genomes; CLC: Charcot–Leyden crystal.
FIGURE 1
FIGURE 1
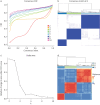
Clustering using partition-around-medoids (PAM) algorithm on the training sets. a) Consensus cumulative distribution fraction (CDF) of b) the consensus matrix. c) The relative change in area under the CDF curve with k=2 or 3 for optimal number of clusters. d) Heat map of pairwise distance between participants in the three clusters.
FIGURE 2
FIGURE 2
Box and dot blots of the eight clinicophysiological variables used in the clustering of the training and validation sets. a) Age at asthma diagnosis. b) Pack-years of cigarette smoking. c) Body mass index (BMI). d) Forced expiratory volume in 1 s (FEV1) as a percentage of predicted value (FEV1 % pred). e) FEV1/forced vital capacity (FVC) ratio. f) The average score of the first five questions of the Asthma Control Questionnaire (ACQ5). g) The self-reported number of exacerbations in the past 12 months. h) The daily dose of oral prednisolone or equivalent. Data are shown as median (interquartile range). OCS: oral corticosteroid; ppb: parts per billion.
FIGURE 3
FIGURE 3
Box and dot blots of main biomarkers in the training and validation sets of Clusters 1, 2 and 3. a) Blood neutrophil count. b) Blood eosinophil count. c) Serum eosinophil cationic protein (ECP). d) Serum total immunoglobulin E (TIgE). e) Fractional exhaled nitric oxide (FENO). f) Sputum neutrophils. g) Sputum eosinophils. Data are shown as median (interquartile range).
FIGURE 4
FIGURE 4
Proteomic analysis of sputum supernatants. Volcano plots for differentially expressed proteins (DEPs) between a) Clusters 1 and 2, b) Clusters 1 and 3, and c) Clusters 2 and 3, the green triangle represents downregulated proteins and the red triangle indicates fold change ≥1.5 or fold change ≤0.66. d–f) Gene Ontology (GO) biological process enrichment of DEPs in comparison of the three clusters. The size of the circle represents the number of DEPs and the colour of the circle represents the p-value. h, i) KEGG pathway enrichment of DEPs in the three clusters. The size of the circle represents the number of DEPs and the colour of the circle represents the p-value.
FIGURE 5
FIGURE 5
Heat map of the correlations between differentially expressed proteins (DEPs) and clinicophysiological and biomarker parameters in a) Cluster 1 and b) Cluster 2. The colour represents the correlation coefficient (blue to red indicates −1 to 1), the horizontal axis shows the clinicophysiological and biomarker parameters, the vertical axis shows the DEPs and asterisks indicate a statistically significant correlation between DEPs and clinicophysiological and biomarker parameters. ACQ5: Asthma Control Questionnaire 5; AQLQ: Asthma Quality of Life Questionnaire; BNC: blood neutrophil count; BEC: blood eosinophil count; SNC: sputum neutrophil count; SEC: sputum eosinophil count; SMC: sputum macrophage count; SLC, sputum lymphocyte count; FEV1: forced expiratory volume in 1 s; FVC: forced vital capacity; OCS: oral corticosteroid. *: p<0.05; **: p<0.01; ***: p<0.001.

References

    1. Huang K, Yang T, Xu J, et al. Prevalence, risk factors, and management of asthma in China: a national cross-sectional study. Lancet 2019; 394: 407–418. doi: 10.1016/S0140-6736(19)31147-X - DOI - PubMed
    1. Chung KF, Wenzel SE, Brozek JL, et al. International ERS/ATS guidelines on definition, evaluation and treatment of severe asthma. Eur Respir J 2014; 43: 343–373. doi: 10.1183/09031936.00202013 - DOI - PubMed
    1. Chung KF, Adcock IM. Precision medicine for the discovery of treatable mechanisms in severe asthma. Allergy 2019; 74: 1649–1659. doi: 10.1111/all.13771 - DOI - PubMed
    1. Lefaudeux D, De Meulder B, Loza MJ, et al. U-BIOPRED clinical adult asthma clusters linked to a subset of sputum omics. J Allergy Clin Immunol 2017; 139: 1797–1807. doi: 10.1016/j.jaci.2016.08.048 - DOI - PubMed
    1. Kim TB, Jang AS, Kwon HS, et al. Identification of asthma clusters in two independent Korean adult asthma cohorts. Eur Respir J 2013; 41: 1308–1314. doi: 10.1183/09031936.00100811 - DOI - PubMed

LinkOut - more resources