. 2025 Jul 24;28(8):113199.
doi: 10.1016/j.isci.2025.113199. eCollection 2025 Aug 15.

A mechanistic computational model of HGF-VEGF-mediated endothelial cell proliferation and vascular permeability

Affiliations

A mechanistic computational model of HGF-VEGF-mediated endothelial cell proliferation and vascular permeability

Rebeca Hannah de Melo Oliveira et al. iScience. .

Abstract

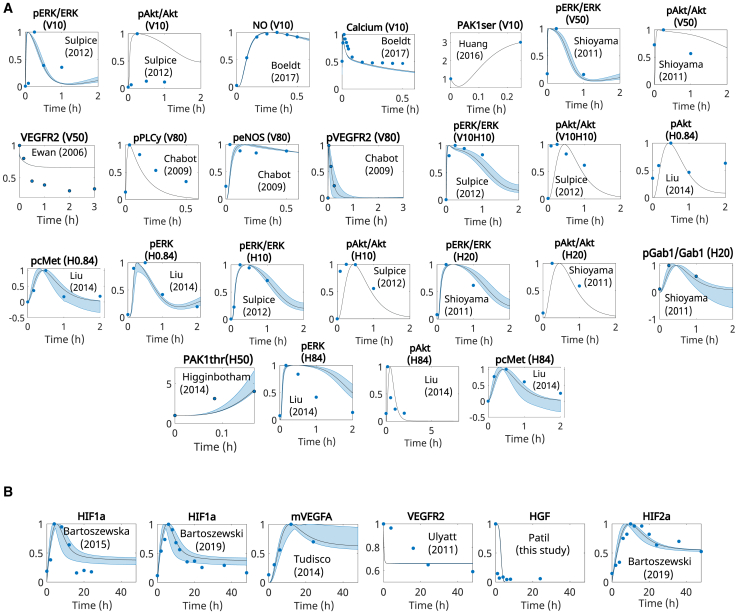
Hepatocyte growth factor (HGF) and vascular endothelial growth factor (VEGF) are important pro-angiogenic factors in angiogenesis-dependent diseases. While sharing some signaling pathways, their contrasting effect on vascular permeability remains under investigation. To explore how these factors promote angiogenesis, we developed, calibrated, and validated a data-driven mechanistic computational model of HGF and VEGF signaling in endothelial cells (ECs). We proposed that variations in permeability profiles may stem from RAC1-PAK1 activation via site-specific phosphorylation. By introducing permeability and proliferation indices, our simulations indicated a dose-dependent effect of VEGF that hampered the ability of HGF to promote vascular stability. Our simulations indicate that HGF did not require VEGFR2 activation to affect permeability and proliferation. This model has the potential to be applicable and helpful in analyzing angiogenesis-dependent diseases. It provided insights into the mechanisms of EC proliferation and vascular permeability induced by HGF and VEGF and permitted evaluation of their separate or combined effects.

Keywords: Biological constraints; Experimental models in systems biology; In silico biology; Integrative aspects of cell biology.


Conflict of interest statement

The authors declare no competing interests.

Figures

None
Graphical abstract
Figure 1
Figure 1
Model diagram including VEGF and HGF signaling to regulate vascular permeability and cell proliferation HGF and VEGF activate their receptors, cMet and VEGFR2, inducing downstream activation of PI3K, Akt, and ERK. Downstream of cMet activation, Gab2 competes with Gab1 to bind with phosphorylated cMet. Through PI3K activation, HGF can lead to PAK activation to enhance adherens junctions, limiting permeability. Meanwhile, VEGF can lead to differential activation of PAK, leading to vascular endothelial cadherins (VE-cad) internalization, which increases vascular permeability. Potential PAK residues stimulated by VEGF or HGF are Ser141 and Thr423. Nitric oxide (NO) is downstream of both pathways and influences vascular permeability. Both factors induce cell proliferation through PI3K and ERK activation, while PTEN exerts an opposite effect, limiting proliferation. Dashed lines represent tissue-level effects, and solid lines represent pathway signaling. For clarity, Ras-GTP and PLCγ are shown as simplified boxed nodes downstream of VEGFR2; their corresponding pathways are depicted in full detail on the HGF/c-Met side. The border colors of these boxes indicate the associated signaling branch. Potential mechanisms through which VEGF and HGF establish different effects are shown in green (VEGF related) and red (HGF related). The influence of different oxygen levels on VEGF and HGF signaling is also investigated.
Figure 2
Figure 2
Detailed diagram of pathways included in the model (A) VEGFR2 phosphorylation induced by VEGF, receptor internalization, degradation, and recycling. (B) HGF activates c-Met, leading to Gab1 and Gab2 phosphorylation and activation. (C) VEGFR2 and c-Met phosphorylation lead to IP3 production, which binds to its receptor and allows calcium release into the cytoplasm from the endoplasmic reticulum (ER), increasing intracellular calcium concentration. Calcium activates eNOS, causing NO production, a process also regulated by Akt, HSP90, and arginine (Arg). (D) Phosphorylated cMet activates PI3K, and phosphorylated VEGFR2 leads to Src phosphorylation and PI3K activation, causing downstream phosphorylation of Akt mediated by mTORC2. (E) Phosphorylated receptors lead to PLCγ phosphorylation and activation, which causes ERK phosphorylation and IP3-mediated increase in intracellular calcium. (F) HIF1/2α is degraded under normoxia but stabilized under hypoxia. Stable HIFs dimerize with HIF1b, regulating VEGF and HGF. (G) Through activation of Src and PI3K, PAK1 can be phosphorylated at different residues, influencing cell response differently. To facilitate interpretation of crosstalk between pathways, shared or “linking” proteins (e.g., pR2, pcMet, PI3K, pAKT, and pPLCγ) are highlighted with distinctive colors, enabling tracking of their roles across signaling modules. VEGF and HGF are indicated in green and yellow, respectively. Basal production and degradation rates are modeled for selected key species.
Figure 3
Figure 3
Identifiability analyses identify unidentifiable unknown parameters (A) Identifiability tableau for unknown parameters are generated through GenSSI 2.0. Empty columns represent structurally unidentifiable parameters. The red asterisk marks unidentifiable parameters found with STRIKE-GOLDD2.0. (B) Sensitivity analysis of observables to SI unknown parameters after the exclusion of collinearity, using PRCC. A dummy parameter was included in the analysis, indicating a lack of sensitivity. Parameters that show PRCC 0.1 were considered practically identifiable.
Figure 4
Figure 4
Model calibration and validation reproduces literature data (A) Simulated time response under normoxic conditions of species included in the model compared to data reported by other groups. VEGF and HGF dosage (ng/mL) are listed in the legend, according to the dose reported in the referenced experiment. (B) Simulated time response under hypoxia (1% O2), with no additional dose of VEGF/HGF. Basal values of VEGF and HGF are set to the representative amount of 1e−5 μM, to observe the effects of hypoxia on VEGF and HGF concentration over time. Patil (this study) refers to measurements performed by our group, as detailed in the methodology for performing ELISA. In (A) and (B), values are normalized to their maximum concentration or initial concentration (PAK1ser and PAK1thr). (C) Dose response of mTORC1 and pAkt relative to their initial concentration. (D) Time response of pERK relative to its initial concentration. Abbreviations are as follows: H, HGF; V, VEGFA. Numbers represent the dose in ng/mL (e.g., V25H25 is VEGF at 25 ng/mL and HGF at 25 ng/mL). Color blocks separate based on stimulus, as annotated on the left upper corner of each color block.
Figure 5
Figure 5
Model predictions closely follow experimental data (A) Confidence intervals for model fitting to (A) normoxic conditions with varying stimulation by VEGF (V) or HGF (H). (B) The equivalent stimulus used in each case is included in the title of the subplots, where the number refers to the dose in ng/mL and (B) hypoxia, with no initial stimulation. Circles represent experimental data collected from the literature cited within each subplot. HGF measurements under hypoxia were performed by our group, and are annotated as “Patil (this study).” The methodology employed for performing ELISA is described in the STAR Methods. Predicted data are represented as mean ± 95% confidence intervals.
Figure 6
Figure 6
System stimulation and oxygen availability alter the effects of various model parameters on PrI and PbI (A) Top 10 positive and negative influencers of PbI and PrI given stimulation by HGF, VEGF, or both at 1 h. Parameters are ordered and annotated according to their signaling pathway group (HGF, VEGF, Akt, ERK, Ca/NO, and HIF) for clarity. (B) Significant influencers of PbI (left) or PrI (right) under hypoxia following VEGF and HGF stimulation. (C) Each point represents a model parameter, plotting its PRCC value relative to PbI (blue circles) or PrI (red circles) at 1 h under normoxia (x axis) against its corresponding PRCC value at 1 h under hypoxia (y axis). Thus, the number of points corresponds to the number of evaluated parameters. Correlation coefficients (r values) were calculated separately for PbI and PrI.
Figure 7
Figure 7
Temporal and stimulus-dependent sensitivity of PbI reveals PAK1thr as key regulator First-order (A) and total-order (B) Sobol sensitivity analysis indicated the temporal and dose-dependent influence of NO, S1P, pERK, PAK1ser, and PAK1thr on the PbI. Time variations on the Sobol index for each species under different initial stimulations by VEGF and/or HGF. H10 = HGF 10 ng/mL, V10 = VEGF 10 ng/mL, H10V10 = HGF and VEGF at 10 ng/mL during 2 h post stimulation.
Figure 8
Figure 8
Dose response of PbI and PrI induced by VEGF and HGF showing a higher sensitivity of the PrI to HGF than to VEGF and a dose-dependent response of PbI to the growth factors under hypoxia (A) Heatmaps of PbI and PrI relative to a no-stimulation condition predicted for 1 h after stimulation. Intensity values are in arbitrary units. Dose combinations are shown on the y axis (HGF) and x axis (VEGF). (B) Time courses of species included in the equations for PbI and PrI given stimulation by VEGF, HGF, or both at 10 or 50 ng/mL, as indicated by colors in the label.

Similar articles

References

    1. Fallah A., Sadeghinia A., Kahroba H., Samadi A., Heidari H.R., Bradaran B., Zeinali S., Molavi O. Therapeutic targeting of angiogenesis molecular pathways in angiogenesis-dependent diseases. Biomed. Pharmacother. 2019;110:775–785. doi: 10.1016/j.biopha.2018.12.022. - DOI - PubMed
    1. Teo Z.L., Tham Y.-C., Yu M., Chee M.L., Rim T.H., Cheung N., Bikbov M.M., Wang Y.X., Tang Y., Lu Y., et al. Global Prevalence of Diabetic Retinopathy and Projection of Burden through 2045: Systematic Review and Meta-analysis. Ophthalmology. 2021;128:1580–1591. doi: 10.1016/j.ophtha.2021.04.027. - DOI - PubMed
    1. Gupta A., Patel R.A.G. Peripheral arterial disease and hypertension. Curr. Opin. Cardiol. 2022;37:403–412. doi: 10.1097/HCO.0000000000000983. - DOI - PubMed
    1. Aday A.W., Matsushita K. Epidemiology of Peripheral Artery Disease and Polyvascular Disease. Circ. Res. 2021;128:1818–1832. doi: 10.1161/CIRCRESAHA.121.318535. - DOI - PMC - PubMed
    1. Annex B.H., Cooke J.P. New Directions in Therapeutic Angiogenesis and Arteriogenesis in Peripheral Arterial Disease. Circ. Res. 2021;128:1944–1957. doi: 10.1161/CIRCRESAHA.121.318266. - DOI - PMC - PubMed

LinkOut - more resources