. 2025 Aug 1:16:1620693.
doi: 10.3389/fmicb.2025.1620693. eCollection 2025.

Multi-omics analysis of Taiwanofungus gaoligongensis: effects of different cultivation methods on secondary metabolites

Affiliations

Multi-omics analysis of Taiwanofungus gaoligongensis: effects of different cultivation methods on secondary metabolites

Tingwen He et al. Front Microbiol. .

Abstract

A multi-omics strategy was utilized in this study to investigate the effects of various cultivation methods-including the fruiting bodies cultivation on Cinnamomum kanehirae wood logs (GLG), the mycelia cultivation on C. kanehirae substrate fungal cultivation bags (NZJB), Cinnamomum camphora substrate fungal cultivation bags (XZJB) and rice medium (DM)-on Secondary Metabolites in Taiwanofungus gaoligongensis. NZJB and XZJB significantly enhanced terpenoids production in the mycelium, with triterpenoid contents in NZJB and XZJB being sevenfold and 3.9-fold higher, respectively, than those in DM. Antcins were notably increased in fungal cultivation bag cultures: antcin C reached the highest level in XZJB (9.72-fold higher than in DM), antcin I peaked in NZJB (12.83-fold higher than in DM), and antrodin C also reached its maximum in NZJB. Additionally, the antrodin C content in NZJB was 3.2-fold higher than in GLG and 4.08-fold higher than in DM. In addition, the levels of steroids, phenolic compounds, and flavonoids were also significantly increased in NZJB and XZJB. Transcriptome analysis revealed significant differences in the expression of genes involved in the biosynthesis of antcins and antrodin C across the different cultivation methods. In particular, the expression of TgHMGR was markedly higher in NZJB than in XZJB and DM, correlating with the elevated terpenoids and triterpenoids levels, suggesting that TgHMGR may act as a key rate-limiting enzyme in the terpenoid biosynthesis pathway of T. gaoligongensis. The expression levels of terpenoid biosynthesis-related genes were significantly elevated in GLG compared to mycelium, consistent with the higher abundance of terpenoid metabolites. Co-expression analysis of transcription factors (TFs) and promoter binding site predictions indicated that the expression of TgHMGR and TgFPPS 2 may be regulated by TgHSF4 and TgMYB6, respectively. Meanwhile, the expression of TgErg2, TgErg3, TgErg5, and TgErg6 1 may be regulated by TgZnF1, TgMYB9, TgHOX1, and TgHMG8. This study compared the metabolite profiles and gene expression patterns of the fruiting bodies of T. gaoligongensis with those of three types of cultivated mycelia. The results provide new insights into the transcriptional regulation of key bioactive compound biosynthesis in T. gaoligongensis and suggest potential strategies to enhance the production of active compounds in mycelia through artificial cultivation, thereby improving its medicinal value and production efficiency.

Keywords: Taiwanofungus gaoligongensis; reference-based transcriptomic analysis; secondary metabolites; transcription factor; transcriptional regulation; untargeted metabolomic analysis.


Conflict of interest statement

The authors declare that the research was conducted in the absence of any commercial or financial relationships that could be construed as a potential conflict of interest.

Figures

Four scatter plots labeled A, B, C, and D depict data analysis results. Plots A and B show multi-dimensional PCA analyses in positive and negative modes, respectively, distinguishing data points by color. Plots C and D present multiPLS-DA analyses with R2 and Q2 values plotted against similarity, using separate data points for each metric.
FIGURE 1
Multivariate statistical analysis of metabolome samples. (A) Metabolome samples PCA (POS); (B) metabolome samples PCA (NEG); (C) metabolome samples PLS-DA (POS) permutation test plot; (D) metabolome samples PLS-DA (NEG) permutation test plot. PC1 represents principal component 1 and PC2 represents principal component 2, each point represents one sample, and points of different colors indicate different subgroups. The PLS-DA permutation test plot is reliable and valid when any of the following points are met: (1) all Q2 points are lower than the original Q2 point on the far right (it is possible that the Q2 point on the far right of the plot coincides with the R2 point on the top right corner); (2) the intersection of the regression line of the Q2 point and the vertical coordinate is less than 0.
Bar chart comparing the intensity of different compounds such as amino acids, fatty acids, and vitamins across four groups: DM, GLG, NZJB, and XZJB. Each compound category shows varying intensity levels indicated by letters for significance.
FIGURE 2
Variation in primary metabolites content among different T. gaoligongensis samples. Mean ± SD (n = 3) was used, According to Tukey’s multiple range test, samples from different treatments labeled with the same letter are not significantly different at the p < 0.05 significance level. DM, mycelia cultured on rice medium; GLG, T. gaoligongensis fruiting bodies; NZJB, mycelia cultured in fungal cultivation bags containing C. kanehirae substrate; XZJB, mycelia cultured in fungal cultivation bags containing C. camphora substrate.
Bar graph showing intensity of various chemical compounds across four groups: DM, GLG, NZJB, and XZJB. Categories include amines, antibiotics, alkaloids, phenylpropanoids, steroids, terpenoids, phenols, flavonoids, and polyketides. Each group is color-coded, with intensity values indicated on the y-axis. Statistical significance is marked with letters above the bars.
FIGURE 3
Variation in secondary metabolites content among different T. gaoligongensis samples. Mean ± SD (n = 3) was used, According to Tukey’s multiple range test, samples from different treatments labeled with the same letter are not significantly different at the p < 0.05 significance level. DM, mycelia cultured on rice medium; GLG, T. gaoligongensis fruiting bodies; NZJB, mycelia cultured in fungal cultivation bags containing C. kanehirae substrate; XZJB, mycelia cultured in fungal cultivation bags containing C. camphora substrate.
Bar graph showing intensity of four types of terpenoids: terpene, monoterpenoids, sesquiterpenoids, diterpenoids, and triterpenoids across four groups: DM, GLG, NZJB, and XZJB. NZJB has the highest values for all terpenoids compared to other groups. Different colors represent each group, with specific labels indicating statistical significance.
FIGURE 4
Variation in terpenoid compounds content among different T. gaoligongensis samples. Mean ± SD (n = 3) was used, According to Tukey’s multiple range test, samples from different treatments labeled with the same letter are not significantly different at the p < 0.05 significance level. DM, mycelia cultured on rice medium; GLG, T. gaoligongensis fruiting bodies; NZJB, mycelia cultured in fungal cultivation bags containing C. kanehirae substrate; XZJB, mycelia cultured in fungal cultivation bags containing C. camphora substrate.
Heatmap showing various compounds and their levels in different samples labeled DM1 to XZ3. Colors range from red indicating higher values to blue indicating lower values, with a gradient scale from -2.50 to 2.50 on the right. Compounds include antcamphorol E, dankasterone B, and others, indicating their concentration levels across samples.
FIGURE 5
Heatmap the expression levels of T. camphoratus metabolites detected in the metabolomic samples, as reported in the literature. Heatmap was generated using TBtools software (version 2.142). DM, mycelia cultured on rice medium; GLG, T. gaoligongensis fruiting bodies; NZJB, mycelia cultured in fungal cultivation bags containing C. kanehirae substrate; XZJB, mycelia cultured in fungal cultivation bags containing C. camphora substrate.
Four visualizations display data comparisons: A) Volcano plot for DM vs. GLG with significant changes highlighted in red and blue. B) Volcano plot for DM vs. XZJB. C) Volcano plot for XZJB vs. GLG. D) Venn diagram showing overlap of up and downregulated genes in the three comparisons.
FIGURE 6
Volcano plot of differentially expressed genes (DEGs) in the comparisons: (A) XZJB vs. GLG, (B) DM vs. GLG, and (C) DM vs. XZJB. Significantly up-regulated or down-regulated genes are labeled with red dots or blue dots, respectively. (D) Venn diagram of DEGs.
Diagram showing the mevalonate pathway and terpenoid biosynthesis. Enzyme names (e.g., TgAACT, TgHMGS) are listed with corresponding heat maps for different treatments (GLG, NZ1B, XZ1B, DM). Colors indicate expression levels, with a gradient from red (high) to blue (low). Pathways for monoterpenoids, sesquiterpenoids, and diterpenoids are marked.
FIGURE 7
Enzymatic reactions in the mevalonate (MVA) pathway in T. gaoligongensis, and the expression of some key genes. GLG, T. gaoligongensis fruiting bodies; NZJB, mycelia cultured in fungal cultivation bags containing C. kanehirae substrate; XZJB, mycelia cultured in fungal cultivation bags containing C. camphora substrate; DM, mycelia cultured on rice medium.
Chemical pathway diagram illustrating the biosynthesis of triterpenoids and antcins from farnesyl diphosphate. It shows the conversion processes involving various enzymes like TgSQS, TgSES, TgOSC, and others, leading to compounds such as lanosterol, ergosterol, and various antcins.
FIGURE 8
Triterpenoid and ergosterol biosynthetic pathways in T. gaoligongensis, and the structures of antcins detected in the metabolome.
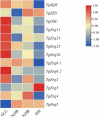
Heatmap showing expression levels of genes TgSQS, TgSES, TgOSC, TgErg11, TgErg24, TgErg25, TgErg26, TgErg6 1, TgErg6 2, TgErg2, TgErg3, TgErg4, and TgErg5 across samples GLG, NZJB, XZJB, and DM. Colors range from red (1.50, high expression) to blue (-1.50, low expression).
FIGURE 9
Differential expression of triterpenoids and ergosterol biosynthetic genes in T. gaoligongensis across different samples. GLG, T. gaoligongensis fruiting bodies; NZJB, mycelia cultured in fungal cultivation bags containing C. kanehirae substrate; XZJB, mycelia cultured in fungal cultivation bags containing C. camphora substrate; DM, mycelia cultured on rice medium.
Heatmap showing the correlation between different compounds and genes, with rows representing compounds like nerolidol and antcin B, and columns representing genes labeled TgACT through TgErg5-5. The color scale ranges from blue for negative correlation to red for positive correlation, with a gradient scale from -1.0 to 1.0. Asterisks indicate statistically significant correlations.
FIGURE 10
Investigation of the correlation between terpenoid biosynthetic Genes and terpenoid metabolites in T. gaoligongensis.
Twelve bar graphs display relative expression levels of different genes (TgHMGR, TgHSF4, TgErg6 1, TgHMG8, TgHMGS, TgFPPS 1, TgSQS, TgOSC, TgErg11, TgErg25, TgErg26, TgErg6 2) across four processing methods (GLG, XZJB, XZJB, DM). Bars differ in height, indicating varying expression levels by processing method.
FIGURE 11
Relative expression of DEGs by qRT–PCR. GLG, T. gaoligongensis fruiting bodies; NZJB, mycelia cultured in fungal cultivation bags containing C. kanehirae substrate; XZJB, mycelia cultured in fungal cultivation bags containing C. camphora substrate; DM, mycelia cultured on rice medium.
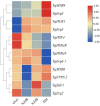
Heat map showing gene expression levels across four samples: GLC, NZJB, XZJB, and DM. Each row represents a gene, and each column represents a sample. Color gradient ranges from blue (low expression) to red (high expression), with genes such as TgMYB9 and TgErg3 showing varied expression levels across samples.
FIGURE 12
Interactive heatmap of gene expression for terpenoid and ergosterol synthesis genes, and co-expressed TgTFs under varying cultivation methods. GLG, T. gaoligongensis fruiting bodies; NZJB, mycelia cultured in fungal cultivation bags containing C. kanehirae substrate; XZJB, mycelia cultured in fungal cultivation bags containing C. camphora substrate; DM, mycelia cultured on rice medium.

Similar articles

References

    1. Achudhan D., Liu S., Lin Y., Huang C., Tsai C., Ko C., et al. (2021). Antcin K inhibits TNF-alpha, IL-1beta and IL-8 expression in synovial fibroblasts and ameliorates cartilage degradation: Implications for the treatment of rheumatoid arthritis. Front. Immunol. 12:790925. 10.3389/fimmu.2021.790925 - DOI - PMC - PubMed
    1. Adiguzel O., Li J., Lin X., Shao E., Lin Z., Zhi-Gang T., et al. (2016). Molecular cloning and expression analysis of mevalonate pyrophosphate decarboxylase in Antrodia cinnamomea. MATEC Web Confer. 64:03001. 10.1051/matecconf/20166403001 - DOI
    1. Bao Y., Yuan X., Chen Z., Yang Y., Zheng Y., Wang Y. (2024). Draft genome sequence of Taiwanofungus gaoligongensis strain YAF008 isolated from Gaoligong Mountain. Microbiol. Resour. Announc. 13:e00340–24. 10.1128/mra.00340-24 - DOI - PMC - PubMed
    1. Beger R., Dunn W., Bandukwala A., Bethan B., Broadhurst D., Clish C., et al. (2019). Towards quality assurance and quality control in untargeted metabolomics studies. Metabolomics 15:4. 10.1007/s11306-018-1460-7 - DOI - PMC - PubMed
    1. Borgognone A., Castanera R., Morselli M., López-Varas L., Rubbi L., Pisabarro A., et al. (2018). Transposon-associated epigenetic silencing during Pleurotus ostreatus life cycle. DNA Res. 25 451–464. 10.1093/dnares/dsy016 - DOI - PMC - PubMed

LinkOut - more resources