. 2025 Aug 8:54:115-130.
doi: 10.1016/j.jot.2025.07.008. eCollection 2025 Sep.

Narirutin mitigates inflammatory arthritis and osteoporosis through modulating macrophage phenotype and osteoclastogenesis

Affiliations

Narirutin mitigates inflammatory arthritis and osteoporosis through modulating macrophage phenotype and osteoclastogenesis

Qing Wang et al. J Orthop Translat. .

Abstract

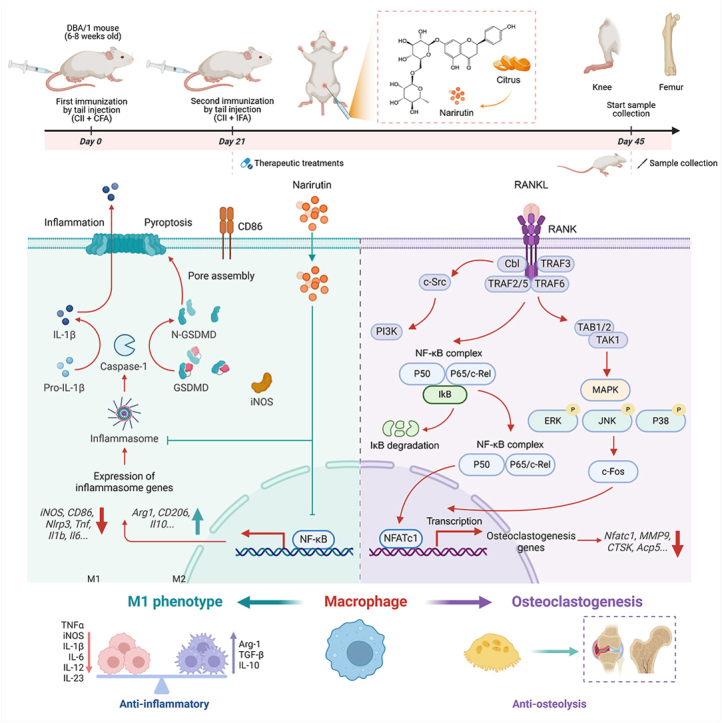
Background: Inflammatory arthritis (IA), exemplified by rheumatoid arthritis (RA), represents a prevalent autoimmune-driven inflammatory bone disorder hallmarked by chronic synovitis and progressive bone erosion, culminating in joint dysfunction and systemic osteoporosis. Narirutin (NRT), a flavonoid glycoside derived from citrus plants, is renowned for its multifaceted bioactivities, including antioxidant, immunomodulatory, and cardioprotective properties. Despite these attributes, the role of NRT in mitigating macrophage-mediated pro-inflammatory activation and osteoclastogenesis within the context of inflammatory arthritis and osteoporosis remains insufficiently elucidated. This study aimed to evaluate the therapeutic potential of NRT in the context of inflammatory arthritis and osteoporosis.

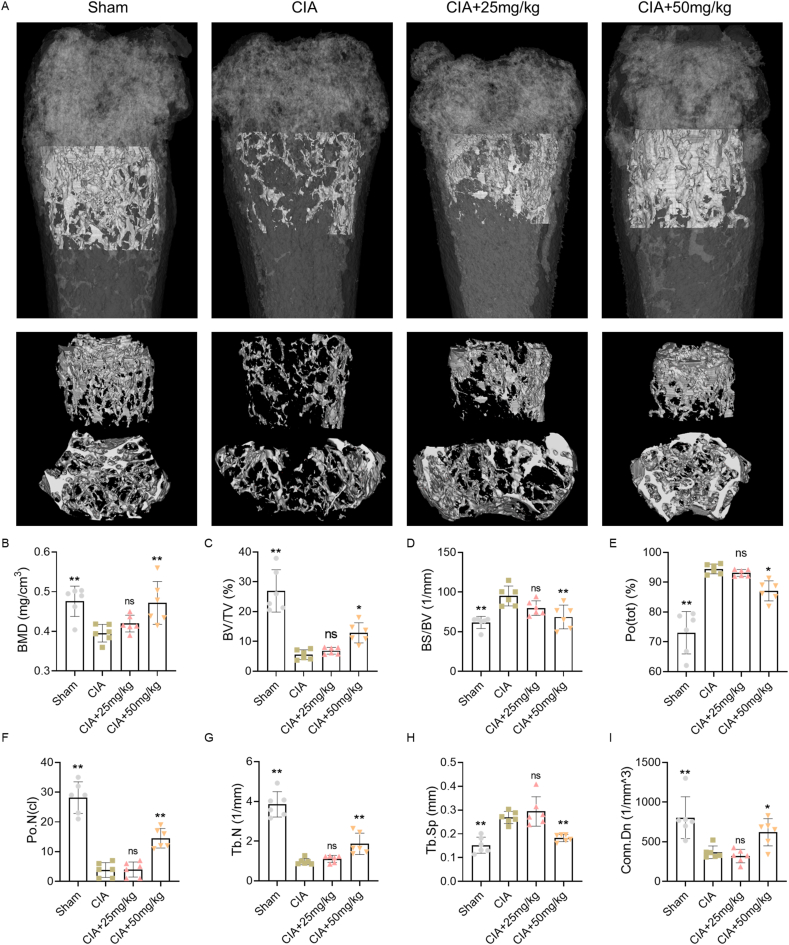
Methods: The phenotypic modulation of macrophages and the osteoclastogenic effects of NRT were evaluated using RAW264.7, THP-1 and bone marrow-derived macrophages (BMMs) in vitro. A classical collagen-induced arthritis (CIA) model was established to investigate the therapeutic effects of NRT administration on inflammatory arthritis and osteoporosis. Macrophage phenotypes and the expression of inflammatory mediators were analyzed in vitro and vivo, respectively. High-throughput RNA sequencing and bioinformatics analyses were employed to identify key downstream signaling pathways, which were further validated. Histological staining, micro-CT, and immunehistofluorescence staining were utilized to assess the in vivo amelioration of inflammation and bone destruction. Visceral toxicity was also assessed in vivo.

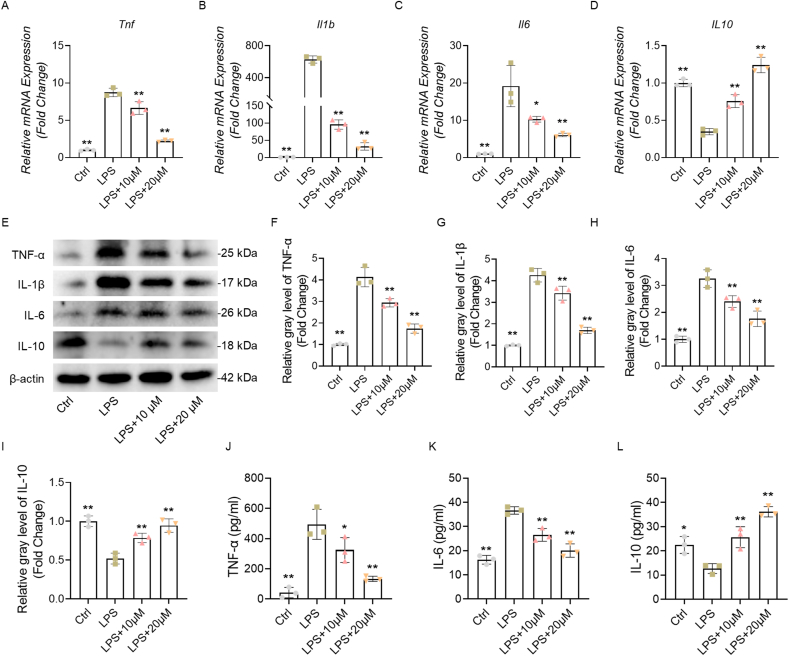
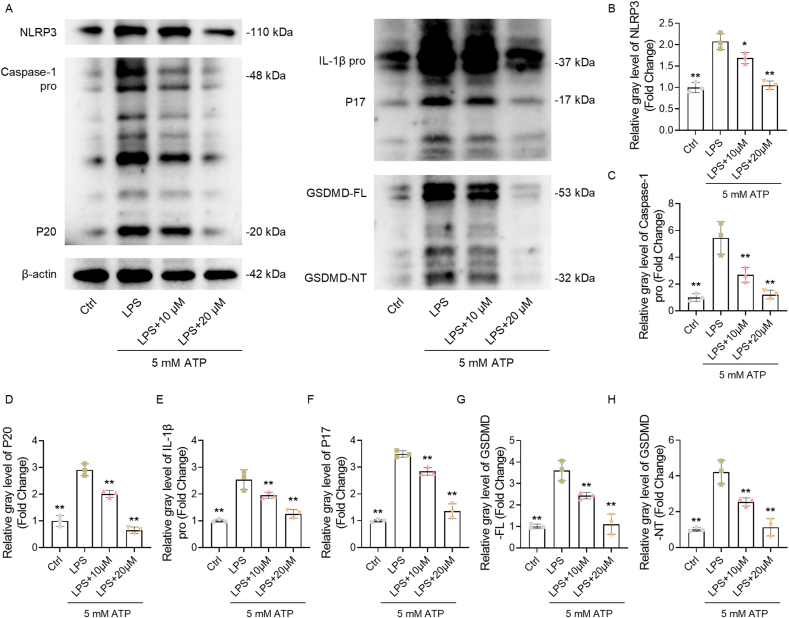
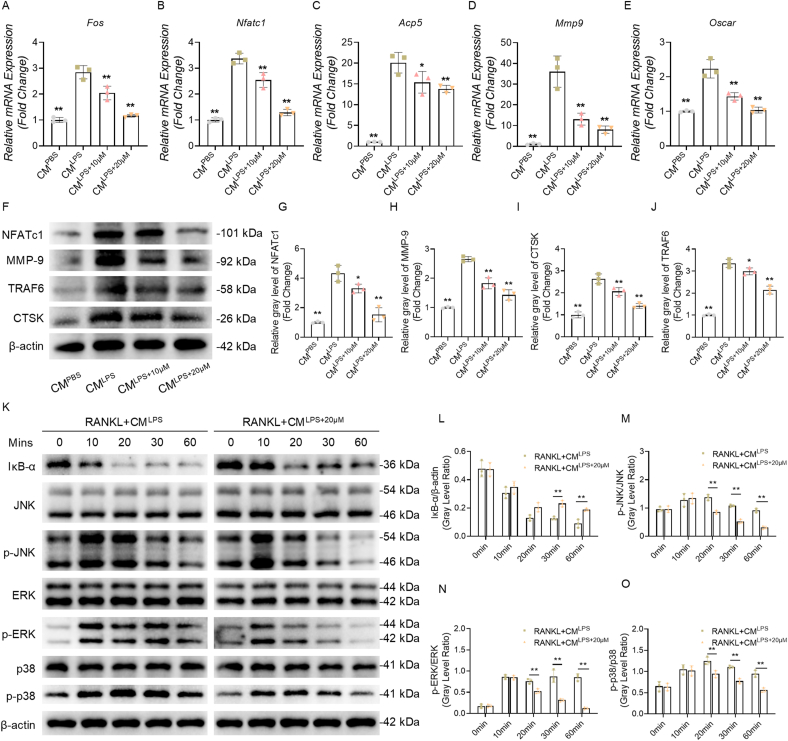
Results: NRT markedly inhibited lipopolysaccharide (LPS)-induced macrophage polarization towards the pro-inflammatory M1 phenotype (CD86+), while promoting a shift towards the anti-inflammatory M2 phenotype (CD206+). This was accompanied by a suppression of pro-inflammatory cytokines, including iNOS, TNF, IL-1β, and IL-6, and an upregulation of immunosuppressive mediators such as IL-10 and Arg-1. RNA sequencing revealed that NRT attenuates the activation of the NOD-like receptor signaling pathway and downstream inflammasome activation. Additionally, osteoclast differentiation was also significantly inhibited, as evidenced by the suppression of NF-κB and MAPK signaling pathways. In vivo studies demonstrated that NRT substantially alleviates the severity of inflammatory arthritis and mitigates systemic osteoporosis.

Conclusion: These findings demonstrated that NRT mitigates inflammatory arthritis and osteoporosis through modulating macrophage phenotype and osteoclastogenesis via NOD-like receptor signaling pathway induced inflammasome activation and NF-κB and MAPK signaling pathways, respectively.

The translational potential of this article: These findings highlight the potential of targeting macrophage pro-inflammatory M1 phenotype in and osteoclastogenesis as an effective strategy for inflammatory arthritis and systemic osteoporosis, and positioning NRT may serve as a promising therapeutic drug candidate.

Keywords: Inflammatory arthritis; Macrophage polarization; Narirutin; Osteoclast; Osteoimmunomodulatory; Osteoporosis.


Conflict of interest statement

The authors declare that they have no known competing financial interests or personal relationships.

Figures

Image 1
Graphical abstract
Scheme 1
Scheme 1
Schematic illustration of the narirutin (NRT) for IA therapy. NRT effectively and mitigates LPS-induced inflammatory M1 phenotype and inhibits subsequent osteoclastogenesis in vitro, leading to a significant improvement in CIA and associated osteoporosis in vivo. These findings not only highlight the potential of NRT as a therapeutic agent targeting macrophage-driven inflammatory responses and bone resorption but also open up new avenues for the pharmacological application in treating other inflammation disorders and related bone loss diseases.
Fig. 1
Fig. 1
Macrophage phenotype-regulating properties of NRT in vitro. (A) The chemical structure and molecular formula of NRT. (B) The CCK-8 assay of distinct NRT doses on RAW264.7 cells for 3 days. (C) The Cell viability of distinct NRT doses on RAW264.7 cells for 3 days. (D) The Calcein AM and propidium iodide (PI) co-staining of distinct NRT doses on RAW264.7 cells for 12 h (Scale bar = 400 μm) (E–H) The mRNA expression of Nos2, Cd86, Arg1 and Mrc1. (I) Immunofluorescence staining of iNOS and Arg-1. (Scale bar = 200 μm). red (phalloidin), green (iNOS and Arg-1), and blue (nuclei). (J) Flow cytometry analysis of membrane markers CD86 and CD206. All data are presented as mean ± SD, n = 3 per group, ∗p < 0.05, ∗∗p < 0.01, and ns: no significance, compared with the LPS group.
Fig. 2
Fig. 2
NRT inhibits inflammatory cytokine expression and secretion in vitro. (A–D) The mRNA expression of Tnf, Il1b, Il6 and Il10. (E) The western blot analysis of inflammatory cytokines. (F–I) Protein expressions determined by relative gray level. (J–L) ELISA analysis of TNF-α, IL-6, and IL-10 in the cell supernatant. All data are presented as mean ± SD, n = 3 per group, ∗p < 0.05, ∗∗p < 0.01, and ns: no significance, compared with the LPS group.
Fig. 3
Fig. 3
The immunoregulatory mechanism of NRT in vitro. (A) The PCA plot. (B) Volcano plot. Statistically significant differential expression was defined by |Log2 fold change (FC)| > 0.2 and a P value < 0.001. (C and D) The heat map of total DEGs and macrophage phenotypes-related and NOD-like receptor signaling pathway-related highlight genes e.g., Tnf, Cd86, NLRP3, Il1a, Il1b, Nos2, Il6, Nod1 and Nod2. (E) KEGG enrichment analysis of total DEGs. (F) GO enrichment pathway analysis of total DEGs. (G) Correlation network analysis of enriched KEGG pathways. (H) GSEA analysis of rheumatoid arthritis signaling pathway. Group A1-A3 refers to the cells after LPS intervention and group B1-B3 refers to the cells treated by LPS + NRT.
Fig. 4
Fig. 4
NRT inhibits LPS- and ATP-induced NLRP3 inflammasome activation in vitro. (A) The western blot analysis of inflammasome related proteins e.g., NLRP3, Caspase-1 pro and p20, pro-IL-1β and p17, GSDMD-FL and GSDMD-NT. (B–H) Quantitative analysis of relative gray levels. For LPS- and ATP-induced NLRP3 inflammasome activation, BMDMs were primed with 100 ng/mL LPS for 12 h, followed by stimulation with 5 mM ATP during the final 30 min. All data are presented as mean ± SD, n = 3 per group, ∗p < 0.05, ∗∗p < 0.01, and ns: no significance, compared with the LPS + ATP group.
Fig. 5
Fig. 5
NRT inhibits osteoclastogenesis through regulating macrophage phenotype in vitro. (A) TRAP staining of osteoclasts and SEM images of bovine bone slices resorption pits (Scale bar = 400 μm). (B and C) Quantitative analysis of TRAP-positive osteoclast numbers and resorption areas. (D) Immunofluorescence staining of NFATc1 and F-actin. red (F-actin), green (NFATc1), and blue (nuclei). (Scale bar = 400 μm). (E and F) Quantitative analysis of average fluorescence intensity and nuclei count per osteoclast. All data are presented as mean ± SD, n = 3 per group, ∗p < 0.05, ∗∗p < 0.01, and ns: no significance, compared with the CMLPS group.
Fig. 6
Fig. 6
NRT abrogates the activation of NF-κB and MAPK signaling in vitro. (A–E) The mRNA expression of Fos, Nfatc1, Acp5, Mmp9 and Oscar. (F) The western blot analysis of osteoclast related proteins e.g., NFATc1, MMP-9, TRAF6 and CTSK. (G–J) Quantitative analysis of relative gray levels. (K) The western blot analysis of IκB-α, phosphorylation levels of JNK, ERK and p38. (L) Quantification of IκB-α expression standardized to β-actin. (M–O) The proportion of phosphorylated JNK, ERK and p38 with respect to total ERK, JNK and p38. Protein levels were normalized to the β-actin to ensure comparability across different groups. All data are presented as mean ± SD, n = 3 per group, ∗p < 0.05, ∗∗p < 0.01, and ns: no significance, compared with the CMLPS group in (A–J) and RANKL + CMLPS group in (K–O), respectively.
Fig. 7
Fig. 7
Administration of NRT ameliorates arthritis symptoms in CIA mice. (A) Macroscopic observations and thermographic images of hindpaws. (B) Quantitative analysis of hindpaw thickness. (C) Representative images of gait analysis. (D) Heatmap of thermographic images. (E) Arthritic score analysis. (F) Quantitative analysis of footprint length. All data are presented as mean ± SD, n = 6 per group, ∗p < 0.05, ∗∗p < 0.01, and ns: no significance, compared with the CIA group.
Fig. 8
Fig. 8
Administration of NRT ameliorates bone destruction and synovial infiltration in CIA mice. (A) Two-dimensional micro-CT images of knees. (B) Three-dimensional micro-CT images of forepaws, knees, and hindpaws. (C–F) Quantitative analysis of bone morphological parameters including BMD (g/cm3), BV/TV (%), BS/BV (1/mm) and Po tot (%). (G) H&E and F&O staining of knees (scale bar = 800 μm in H&E staining and scale bar = 400 μm in F&O staining). (H and I) Quantitative analysis of the inflammation area per tissue area (Infl. Ar./T.Ar.) and cartilage OARSI score. All data are presented as mean ± SD, n = 6 per group, ∗p < 0.05, ∗∗p < 0.01, and ns: no significance, compared with the CIA group.
Fig. 9
Fig. 9
NRT regulates macrophage phenotype and osteoclastogenesisin vivo. (A) Immunofluorescence staining of iNOS, Arg-1 and F4/80. red (iNOS and Arg-1), green (F4/80), and blue (nuclei). (Scale bar = 200 μm). (B) TRAP staining of osteoclasts in the subchondral bone. (Scale bar = 400 μm) (C and D) Quantitative analysis of average fluorescence intensity of iNOS and Arg-1. (E) Quantitative analysis of TRAP-positive cells. All data are presented as mean ± SD, n = 6 per group, ∗p < 0.05, ∗∗p < 0.01, and ns: no significance, compared with the CIA group.
Fig. 10
Fig. 10
NRT attenuates CIA induced inflammatory osteoporosis in vivo. (A) Two-dimensional and Three-dimensional micro-CT images of distal femur. (B–I) Quantitative analysis of bone morphological parameters including BMD (g/cm3), BV/TV (%), BS/BV (1/mm), Po tot (%), Po.N (cl), Tb.N (1/mm), Tb.Sp (mm) and Conn.Dn (1/mm^3). All data are presented as mean ± SD, n = 6 per group, ∗p < 0.05, ∗∗p < 0.01, and ns: no significance, compared with the CIA group.

References

    1. Smolen J.S., Aletaha D., McInnes I.B. Rheumatoid arthritis. Lancet. 2016;388(10055):2023–2038. - PubMed
    1. Hazes J.M., Luime J.J. The epidemiology of early inflammatory arthritis. Nat Rev Rheumatol. 2011;7(7):381–390. - PubMed
    1. Adami G., Saag K.G. Osteoporosis pathophysiology, epidemiology, and screening in rheumatoid arthritis. Curr Rheumatol Rep. 2019;21(7):34. - PubMed
    1. Dimitroulas T., Nikas S.N., Trontzas P., Kitas G.D. Biologic therapies and systemic bone loss in rheumatoid arthritis. Autoimmun Rev. 2013;12(10):958–966. - PubMed
    1. Wang Q., Wang W., Peng X., Ge G., Li W., Zhu C., et al. Engineering peptide‐oligonucleotide nano‐conjugates via click reaction as self‐delivery system for gene therapy of inflammatory arthritis. Adv Funct Mater. 2024

LinkOut - more resources