. 2025 Aug 1:19:1638002.
doi: 10.3389/fncom.2025.1638002. eCollection 2025.

Dentate gyrus granule cell activation following extracellular electrical stimulation: a multi-scale computational model to guide hippocampal neurostimulation strategies

Affiliations

Dentate gyrus granule cell activation following extracellular electrical stimulation: a multi-scale computational model to guide hippocampal neurostimulation strategies

Shayan Farzad et al. Front Comput Neurosci. .

Abstract

Introduction: The effectiveness of neural interfacing devices depends on the anatomical and physiological properties of the target region. Multielectrode arrays, used for neural recording and stimulation, are influenced by electrode placement and stimulation parameters, which critically impact tissue response. This study presents a multiscale computational model that predicts responses of neurons in the hippocampus-a key brain structure primarily involved in memory formation, especially the conversion of short-term memories into long-term storage-to extracellular electrical stimulation, providing insights into the effects of electrode positioning and stimulation strategies on neuronal response.

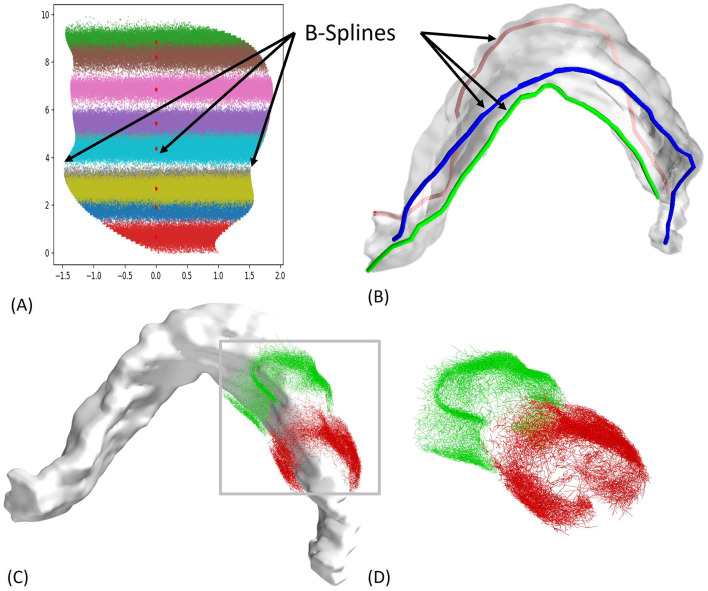
Methods: We modeled the rat hippocampus with highly detailed axonal projections, integrating the Admittance Method to model propagation of the electric field in the tissue with the NEURON simulation platform. The resulting model simulates electric fields generated by virtual electrodes in the perforant path of entorhinal cortical (EC) axons projecting to the dentate gyrus (DG) and predicts DG granule cell activation via synaptic inputs.

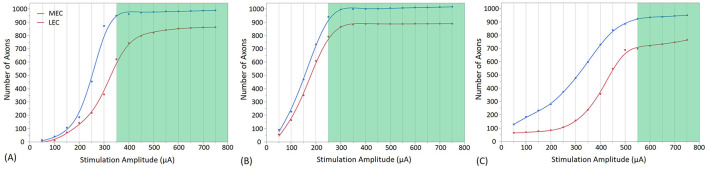
Results: We determined stimulation amplitude thresholds required for granule cell activation at different electrode placements along the perforant path. Membrane potential changes during synaptic activation were validated against experimental recordings. Additionally, we assessed the effects of bipolar electrode placements and stimulation amplitudes on direct and indirect activation.

Conclusion: Stimulation amplitudes above 750 μA consistently activate DG granule cells. Lower stimulation amplitudes are required for axonal activation and downstream synaptic transmission when electrodes are placed in the molecular layer, infra-pyramidal region, and DG crest.

Significance: The study and underlying methodology provide useful insights to guide the stimulation protocol required to activate DG granule cells following the stimulation of EC axons; the complete realistic 3D model presented constitutes an invaluable tool to strengthen our understanding of hippocampal response to electrical stimulation and guide the development and placement of prospective stimulation devices and strategies.

Keywords: admittance method; electrode design; extracellular electrical stimulation; multiscale modeling; neuron.


Conflict of interest statement

The authors declare that the research was conducted in the absence of any commercial or financial relationships that could be construed as a potential conflict of interest.

Figures

Diagram depicting the experimental setup for studying a rodent brain. Part A shows an electrode inserted into a rodent's brain. Part B illustrates the hippocampal structure with directional arrows indicating electrical pathways. Part C provides a 3D model of the hippocampus with labeled measurements and components, including a reference electrode and insulated wires. Labels like EC, Layer V/VI, CA1, CA3, DG, and gcl are displayed, detailing sections of the hippocampus.
Figure 1
(A) Illustration depicting electrical stimulation of the hippocampal region with a diagram of the hippocampo-entorhinal circuit, illustrating the main trisynaptic pathway EC → DG → CA3 → CA1. CA, cornu ammonis; DG, dentate gyrus; EC, entorhinal cortex. (B) Serial tracing of high-resolution thin histological sections of a rat brain (Ropireddy et al., 2012) has been converted into (C) the three-dimensional voxel grid which is utilized as the tissue model in the AM-NEURON multiscale simulation, enabling detailed computational modeling of neuronal activity within this anatomically accurate hippocampal tissue model. Experimentally obtained resistivity values are applied to cell body regions (blue) and molecular layers (remaining of the model space, not shown) of DG (López-Aguado et al., 2001).
Diagram showing four parts labeled A to D. Part A illustrates a neuron with labeled layers: outer, middle, and inner thirds of the molecular layer, and the granule cell layer. Part B shows cylindrical components connected by lines representing the different compartments of a neuron model. Part C depicts a portion of the voxelized AM tissue model as an electrical circuit with resistors and labeled nodes V1(t) and V2(t). Part D presents a detailed circuit representing the electrical equivalent circuit of the neuron membrane with capacitors and resistors, indicating ionic channels with equations and nodes V1(t) and V2(t). The diagrams collectively depict how a neuron and its electrical circuit representation are integrated in the tissue model (admittance model) and how the resulting model is computed.
Figure 2
A granule cell compartmental model is depicted as a cable model, with compartments linked in series or parallel based on their morphology (A, B). Each compartment is modeled as a circuit. (C) This diagram illustrates how the neuron compartmental model is integrated in the tissue simulated with the Admittance Method. Notably, this diagram shows the simple case where the two (teal and orange) compartments perfectly align with nodes of the voxeled AM model. In reality, compartments may reside at arbitrary positions within the computational volume. In such cases, the voltages from surrounding nodes are used to interpolate the extracellular potential to be applied at the exact position of each compartment; (D) illustrates the circuit equivalent representation of a two-compartment neuron model.
Diagram shows four panels labeled A to D. Panel A is a plot showing the extent of the axonal field for different EC axons. Each EC axon is represented by a different color. The locations of the B-Splines used to generate the 3D reconstruction are indicated. Panel B highlights the three B-Splines represented in the 3D model. Panel C shows the 3D reconstructed granule cell layer as a gray structure with two EC axons represented with a green and red color. Panel D is a zoomed inset on the two axons represented in detail as green and red meshes.
Figure 3
2D to 3D Mapping steps and axon arbor reconstruction. (A) The 2D locations of the granule cells for all entorhinal cortex (EC) axons were obtained from experimental work by (Gaarskjaer, 1978), with each axon having ~2,500 connections, (B) B-splines were used to map the 2D data onto a 3D model, (C) Reconstruction Using ROOTS Algorithm: Reconstructed axon arbors using the ROOTS Algorithm, ensuring accurate representation of axonal paths (Bingham et al., 2020), (D) Synaptic Connections: Over 1,900 axons make synaptic connections to a single granule cell. The two depicted axons illustrate the range of dentate gyrus (DG) coverage, representing the first and last EC axons connecting to the same granule cell.
Three-dimensional models of hippocampal regions are shown in blue, with two red cylinders (electrodes) indicating stimulation location in 3D models (A) infra-pyramidal, (B) Crest and (C) supra-pyramidal regions. Below is showing the position of electrodes at dentate gyrus in a 2D representation.
Figure 4
Stimulation locations in the 3D model: (A) Infrapyramidal, (B) Crest, and (C) Suprapyramidal. A biphasic, charge-balanced, and square-wave impulse of 1 ms width was applied to evaluate the activation of EC axons that consequently leads to synaptic activation of GC.
Two graphs labled A and B display characterization of dendritic integration of synaptic inputs in granule cells (GCs) and corresponding GC activation threshold. The plots depict the relationship between the number of active synaptic inputs and the probability of generating an action potential. Each graph includes a schematic on the left labels: EC axons, LPP, MPP, and GC Soma. Both graphs have shaded areas representing different probability of activation percentages: >80%, 60–80%, 40–60%, 20–40% and <20%. The x-axis shows the number of synapses, and the y-axis shows the number of dendrites.
Figure 5
Characterization of dendritic integration of synaptic inputs in granule cells (GCs) and corresponding GC activation threshold. The plots depict the relationship between the number of active synaptic inputs and the probability of generating an action potential. Notably, the number of dendrites on which these active synapses are distributed influences the activation threshold, with more distributed configurations (i.e., increased number of dendrites) resulting in a slight decrease in the number of active synapses needed to generate an action potential. (A) Illustrates the synaptic connections of EC axons to GC at the medial perforant path (MPP), while (B) illustrates the situation where active synaptic connections are located at the lateral perforant path (LPP).
Graph A shows membrane potential over time of the GC model for soma and dendrite, with blue and red lines peaking early and tapering off. Graph B includes three plots: a red dendritic potential, a blue somatic potential with step input, and an overlay of both potentials for comparison. Axes are annotated with voltage and time scales.
Figure 6
Comparison of intracellular voltages recorded experimentally and with our computational model. (A) illustrates the membrane potential response of our GC model at the soma and in a proximal dendrite. For this result, we used 1,800 synaptic inputs distributed on 20 dendrites. (B) shows the corresponding experimental activation profiles reported by Krueppel et al. (2011). The intracellular voltage traces obtained with the model are in accordance with experimental recordings, indicating that our simulated GC model replicates the response of its biological counterpart, highlighting the model's ability to accurately predict the cell's behavior.
Line graphs labeled (A), (B) and (C) show the stimulation effects with the electrode placed in the cell body layer of the dentate gyrus at different positions. (A) crest, (B) infra-pyramidal and (C) supra-pyramidal. Axon numbers increase with stimulation amplitudes. Graph (A) Shows the activation of granule cell with electrode positioned at crest at 600 microamperes and above, highlighted by a green area. Graph (B) depicts a similar trend and shows the activation of granule cell with electrode positioned at infra-pyramidal at 450 microamperes and above, highlighted by a green area. Graph (C) shows the activation of granule cell with electrode positioned at supra-pyramidal at 750 microamperes and above, highlighted by a green area. MEC and LEC are represented in blue and red respectively.
Figure 7
Stimulation effects with the electrode placed in the cell body layer of the dentate gyrus at different positions. (A) shows the stimulation at the Crest, (B) at the Infra-pyramidal, and (C) at the Supra-pyramidal region. The stimulation amplitude ranges from 50 to 750 μA. The green area on the plot represents the amplitudes at which the EC synaptic connections with GCs reach a threshold, resulting in the firing of the GCs. In addition to highlight the effect of stimulation amplitude, this figure illustrates how electrode placement within these specific regions influences the activation of neural tissue in the dentate gyrus.
Three line graphs labeled A, B, and C, show the stimulation effects with the electrode placed in the molecular layer of the dentate gyrus at different positions. (A) crest, (B) infra-pyramidal and (C) supra-pyramidal. Axon numbers increase with stimulation amplitudes. Graph (A) Shows the activation of granule cell with electrode positioned at crest at 350 microamperes and above, highlighted by a green area. Graph (B) depicts a similar trend and shows the activation of granule cell with electrode positioned at infra-pyramidal at 250 microamperes and above, highlighted by a green area. Graph (C) shows the activation of granule cell with electrode positioned at supra-pyramidal at 550 microamperes and above, highlighted by a green area. MEC and LEC are represented in blue and red respectively.
Figure 8
Direct and indirect (i.e., synaptic) consequences of electrical stimulation when the electrode is placed in the Molecular Layer of the Dentate Gyrus at three different positions, with different stimulation amplitudes. (A) shows the stimulation at the Crest, (B) at the Infra-pyramidal, and (C) at the Supra-pyramidal region. The stimulation amplitude ranges from 50 to 750 μA. The Y axis represents the number of axons activated. The green area on the plot represents the amplitudes at which the EC synaptic connections with GC reach a threshold, resulting in the firing of the GC.

Similar articles

References

    1. Aberra A. S., Peterchev A. V., Grill W. M. (2018). Biophysically realistic neuron models for simulation of cortical stimulation. J. Neural Eng. 15:066023. 10.1088/1741-2552/aadbb1 - DOI - PMC - PubMed
    1. Aimone J. B., Deng W., Gage F. H. (2011). Resolving new memories: a critical look at the dentate gyrus, adult neurogenesis, and pattern separation. Neuron 70, 589–596. 10.1016/j.neuron.2011.05.010 - DOI - PMC - PubMed
    1. Amaral D. G., Witter M. P. (1989). The three-dimensional organization of the hippocampal formation: a review of anatomical data. Neuroscience 31, 571–591. 10.1016/0306-4522(89)90424-7 - DOI - PubMed
    1. Andersen P., Bliss T., Skrede K. K. (1971). Lamellar organization of hippocampal excitatory pathways. Exp. Brain Res. 13, 222–238. 10.1007/BF00234087 - DOI - PubMed
    1. Ascoli G. A., Krichmar J. L. (2000). L-neuron: a modeling tool for the efficient generation and parsimonious description of dendritic morphology. Neurocomputing 32, 1003–1011. 10.1016/S0925-2312(00)00272-1 - DOI

LinkOut - more resources