. 2025 Aug 1:12:1647379.
doi: 10.3389/fnut.2025.1647379. eCollection 2025.

Influence of oropharyngeal therapy with mother's own milk on the microbiome and metabolome of very preterm infants: a pilot study

Affiliations

Influence of oropharyngeal therapy with mother's own milk on the microbiome and metabolome of very preterm infants: a pilot study

Wenlong Xiu et al. Front Nutr. .

Abstract

Background: Oropharyngeal therapy with mother's own milk (OPT-MOM) may serve as a promising therapeutic approach to elicit immunoprotective and anti-inflammatory benefits for preterm infants.

Objectives: This prospective pilot study aims to investigate whether OPT-MOM alters the oral microbiota, gut microbiota and metabolic profiles in very preterm infants.

Methods: The eligible infants were divided into two groups: the OPT-MOM group and the control group. The OPT-MOM group received oropharyngeal administration with mother's own milk every 3 h, starting within the first 48 h after birth and lasted for 14 days. Salivary samples and fecal samples from both groups were collected to detect microbes using 16S rRNA gene sequencing, while fecal metabolomics was measured by untargeted liquid chromatograph-mass spectrometer.

Results: A total of 26 very preterm infants were enrolled in the study, with 13 assigned to each group. Our study identified distinct oral and intestinal microbiome profiles in OPT-MOM group compared to the control group. Briefly, the relative abundance of the Escherichia-Shigella and Enterobacter genera was significantly reduced in the oral cavity of preterm infants in the OPT-MOM group, while the abundance of the Rothia genus increased markedly. After 14 days of intervention, the gut microbiota of preterm infants in the OPT-MOM group exhibited a significant decrease in the abundance of the Proteobacteria phylum and a concomitant increase in the abundance of the Firmicutes phylum, which emerged as the dominant phylum. Additionally, the OPT-MOM group showed a significant increase in the relative abundance of Streptococcus and Staphylococcus genus, while a significant decrease in Enterococcus and Enterobacter genus abundance was observed in the gut microbiota. The predominant bacteria in the oral microbiota of preterm infants are highly similar to those in the intestinal microbiota. Metabolomic profiling identified that the OPT-MOM group demonstrated significantly higher levels of multiple potentially beneficial metabolites, including N-acetylneuraminic acid, myristoylcarnitine, lauroylcarnitine, acetylcarnitine, and 2,4-dihydroxybutanoic acid.

Conclusion: Administration of OPT-MOM could promote the establishment of favorable microbial communities in both oral and intestinal ecosystems of preterm infants, potentially facilitating the production of metabolites that are crucial for infant health.

Keywords: breast milk; intestinal microbiota; metabolome; oral microbiota; preterm infants.


Conflict of interest statement

The authors declare that the research was conducted in the absence of any commercial or financial relationships that could be construed as a potential conflict of interest.

Figures

Flowchart detailing the enrollment and allocation of infants admitted to NICUs at Fujian Provincial Maternity and Child Health Hospital. Initial admissions totaled sixty-four, with twenty-five excluded: seventeen due to breastfeeding issues, two due to health abnormalities, and six declined participation. Twenty infants were allocated to the OPT-MOM group, all receiving the intervention, and nineteen to the control group with standardized care. Seven from OPT-MOM and six from the control group were further excluded primarily due to sample collection issues and prolonged antibiotic use. Thirteen infants from each group were analyzed with none excluded from the final analysis.
FIGURE 1
Participant flow diagram.
Panel A shows violin plots of Chao1, Shannon, and Simpson diversity indices across different groups and time points, with statistical significance denoted by asterisks. Panel B presents PCoA plots at T0, T1, and T2, illustrating the distribution of Control and OPT-MOM groups with percentages for PCoA1 and PCoA2 axes. Panel C features PCoA plots for Control and OPT-MOM groups, highlighting significant clustering with ellipses representing time points T0, T1, and T2. Color coding differentiates between the groups and time points.
FIGURE 2
Alpha and Beta diversities of oral microbiota in control group and OPT-MOM group over time. (A) Alpha diversity of two groups at different times. (B) Beta diversity comparison between the two groups at different times. (C) Beta diversity of control group and OPT-MOM group over time. Control, control group; OPT-MOM, oropharyngeal therapy with mother’s own milk group. T0, the first day of life; T1, the 10th day of life; T2, the 20th day of life. *< 0.05, **< 0.01, ***< 0.001, ****< 0.0001.
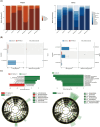
(A) Two bar charts display the relative abundance of bacterial taxa. The left chart shows phylum-level data with various shades of orange, while the right chart presents genus-level data with shades of blue. (B) Two sets of box plots illustrate the differences inbacterial species between the control and OPT-MOM groups at two different time points. (C) Two bar charts illustrate Linear Discriminant Analysis (LDA) scores for significant taxa, followed by circular cladograms depicting phylogenetic relationships and highlighting differentially abundant taxa with green and red shades.
FIGURE 3
Comparison of the relative abundance of the oral microbiota between the control and OPT-MOM groups. (A) Relative abundance of top 4 phylum and the top 12 genus of two groups at different times. (B) Differentially dominant species comparison between the two groups at different times. (C) Differentially abundant microbial clades between the two groups at different times. Control, control group; OPT-MOM, oropharyngeal therapy with mother’s own milk group. T0, the first day of life; T1, the 10th day of life; T2, the 20th day of life.
Three data panels depict group differences in microbiome diversity and composition. Panel A shows violin plots of Chao1, Shannon, and Simpson diversity indices across six groups, with significant differences marked. Panel B presents PCoA plots at T0, T1, and T2, comparing Control and OPT-MOM groups with p-values. Panel C displays PCoA plots for Control and OPT-MOM with separate temporal analysis, showing grouping and p-values indicating differences in microbiome composition over time.
FIGURE 4
Alpha and Beta diversities of gut microbiota in control group and OPT-MOM group over time. (A) Alpha diversity of two groups at different times. (B) Beta diversity comparison between the two groups at different times. (C) Beta diversity of control group and OPT-MOM group over time. Control, control group; OPT-MOM, oropharyngeal therapy with mother’s own milk group. T0, the first day of life; T1, the 10th day of life; T2, the 20th day of life. *< 0.05, **< 0.01.
Panel A shows two bar charts depicting relative abundance at the phylum and genus levels, with varying colors representing different taxa. Panel B includes two charts with meanproportion differences and confidenceintervals for differentially dominant speciesbetween control and treatment groups. Panel C displays two LDA score bar charts, highlighting taxa enrichment for different groups, accompanied by circular cladograms showcasing taxonomic distribution.
FIGURE 5
Comparison of the relative abundance of the gut microbiota between the control and OPT-MOM groups. (A) Relative abundance of top 4 phylum and the top 12 genus of two groups at different times. (B) Differentially dominant species comparison between the two groups at different times. (C) Differentially abundant microbial clades between the two groups at different times. Control, control group; OPT-MOM, oropharyngeal therapy with mother’s own milk group. T0, the first day of life; T1, the 10th day of life; T2, the 20th day of life.
(A) Three scatter plots show OPLS-DA distribution with control and treatment groups as colored ellipses. (B) and (C) Volcano plots depict differential expression of entities, with up-regulated in red, down-regulated in blue, and non-significant in gray, alongside significance and VIP scores. (D) and (E) Stick plots illustrate specific metabolites’log2 fold changes, highlighting up-regulated and down-regulated compounds, indicated in red and blue, respectively, with fold change values and significance indicated by asterisks.
FIGURE 6
Comparison of gut metabolites between control group and OPT-MOM group at different times. (A) OPLS-DA analysis between groups at different times. (B) Volcano plots of differential metabolites between groups at T1. (C) Volcano plots of differential metabolites between groups at T2. (D) Stick plots of differential metabolites between groups at T1. (E) Stick plots of differential metabolites between groups at T2. Control, control group; OPT-MOM, oropharyngeal therapy with mother’s own milk group. T0, the first day of life; T1, the 10th day of life; T2, the 20th day of life. *< 0.05, **< 0.01, ***< 0.001.
(A) Bubble plot showing KEGG pathways at T1 on the y-axis and the Rich factor on the x-axis, with bubble size indicating count and color representing p-value. (B) Similar bubble plot at T2. (C) KEGG differential abundance score plot at T1, colored by KEGG class. (D) KEGG differential abundance score plot at T2. (E) Bubble plot using impact versus negative logarithm of p-value, showing various pathways at T1. (F) Similar bubble plot at T2. Each panel visualizes metabolic pathway data using different metrics.
FIGURE 7
Gut differential metabolites functional prediction at different times. (A) KEGG enrichment of gut differential metabolites at T1. (B) KEGG enrichment of gut differential metabolites at T2. (C) DA score of gut differential metabolites at T1. (D) DA score of gut differential metabolites at T2. (E) Pathway analysis of gut differential metabolites at T1. (F) Pathway analysis of gut differential metabolites at T2. T1, the 10th day of life; T2, the 20th day of life. *< 0.05, **< 0.01, ***< 0.001.
Heatmaps labeled as (A) and (B) depict correlation values ranging from -1 to 1, represented by a color gradient from blue to red. Each axis displays various microbial taxa, and correlations are marked with asterisks indicating significance levels.
FIGURE 8
The Relationship between oral microbiota and gut microbiota at different times. (A) The correlation heatmap between oral microbiota and gut microbiota at T1. (B) The correlation heatmap between oral microbiota and gut microbiota at T2. T1, the 10th day of life; T2, the 20th day of life. *< 0.05, **< 0.01, ***< 0.001.
Heatmap comparing correlations between gut microbiota and fecal metabolites at different times. Panel A shows T1, while Panel B displays T2. Color gradient ranges from blue (negative correlation) to red (positive correlation), with significance indicated by asterisks. Labels on the axes identify specific microbiota and metabolites
FIGURE 9
The Relationship between gut microbiota and fecal metabolites at different times. (A) The correlation heatmap between gut microbiota and fecal metabolites at T1. (B) The correlation heatmap between gut microbiota and fecal metabolites at T2. T1, the 10th day of life; T2, the 20th day of life. *< 0.05, **< 0.01, ***< 0.001.

Similar articles

References

    1. Kaffe K, Syrogiannopoulos G, Petinaki E, Goudesidou M, Kalaitzi A, Gounaris A, et al. Epidemiology and outcomes of late-onset neonatal sepsis in preterm infants in a tertiary hospital. Children. (2025) 12:532. 10.3390/children12050532 - DOI - PMC - PubMed
    1. Ofek Shlomai N, Tayeb M, Abu Omar R, Eventov Friedman S. Changes in the incidence and severity of NEC over the last decade: a single-center study. JCM. (2025) 14:3551. 10.3390/jcm14103551 - DOI - PMC - PubMed
    1. Drommelschmidt K, Mayrhofer T, Müller H, Foldyna B, Raudzus J, Göricke S, et al. CMRI-detected brain injuries and clinical key risk factors associated with adverse neurodevelopmental outcomes in very preterm infants. Sci Rep. (2025) 15:18221. 10.1038/s41598-025-02539-1 - DOI - PMC - PubMed
    1. Alrahili M, Halabi S, Al Essa A, Alrsheedi S, Almuqati R, Althubaiti M, et al. Delayed admission temperature normalisation in preterm infants <32 weeks: impact on mortality and neonatal morbidities. bmjpo. (2025) 9:e003473. 10.1136/bmjpo-2025-003473 - DOI - PMC - PubMed
    1. Miller J, Tonkin E, Damarell R, McPhee A, Suganuma M, Suganuma H, et al. A systematic review and meta-analysis of human milk feeding and morbidity in very low birth weight infants. Nutrients. (2018) 10:707. 10.3390/nu10060707 - DOI - PMC - PubMed

LinkOut - more resources