. 2025 Aug 15;15(8):e72006.
doi: 10.1002/ece3.72006. eCollection 2025 Aug.

Are Findings of Key Insect Metrics Generalizable Across Different Taxa in Malaise Trap Samples?

Affiliations

Are Findings of Key Insect Metrics Generalizable Across Different Taxa in Malaise Trap Samples?

Nicole Remmel et al. Ecol Evol. .

Abstract

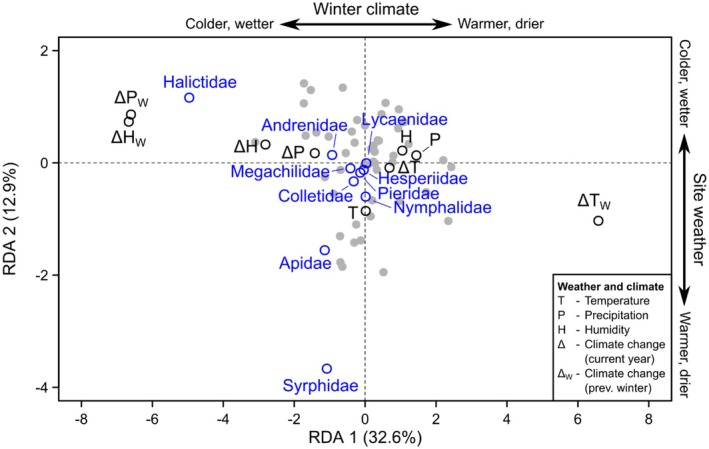
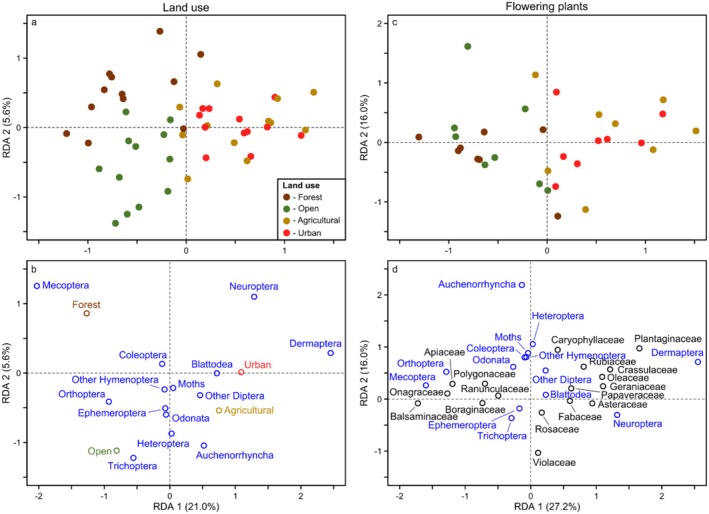
Recent reports of insect declines and drivers thereof are often based on total biomass from Malaise traps. However, it remains unclear whether these changes reflect shifts in other community metrics (e.g., total abundance) and important taxa, such as key pollinators. To address this question, we collected Malaise trap samples from four different habitats (forest, urban, agriculture and open land) and four seasons (early spring, late spring, midsummer and early autumn) during 2019-2021. We measured the total biomass of each sample, then morphologically identified the insects in each sample, comprising 533,128 total individuals. We determined whether changes in total biomass reflected changes in total community abundance, and whether community relationships to habitat characteristics of land cover, weather/climate, and flowering plants were the same between the most common insects (represented by 15 different taxonomic groups) versus relatively fewer focal pollinators, specifically bees, butterflies, and hoverflies. Biomass was generally related to abundance, except in a small subset of communities comprising more larger-bodied taxa. Additionally, both overall community composition and pollinator composition were explained by the same weather and climate variables and the same habitat characteristics. However, pollinator relationships to habitat were likely driven by different mechanisms, specifically covarying changes in flowering plants. Our results suggest that patterns in Malaise trap biomass, and the relationships of prominent taxa to habitat characteristics, could be used to infer similar changes in other important community metrics and taxa, including pollinators. However, some insects responded to shifts in habitat characteristics for different underlying reasons, indicating the need for caution when using such inferences to inform conservation and management to ensure the correct mechanisms are being addressed.

Keywords: biomass; community; insect; malaise trap; pollinator.


Conflict of interest statement

The authors declare no conflicts of interest.

Figures

FIGURE 1
FIGURE 1
Sampling design using Malaise traps. Left side shows trap locations and sampling seasons in four different habitat types of: (a) agricultural (N 50.17989, E 8.95835; 121 m a.s.l.), (b) open land (N 50.18603, E 9.09684; 122 m a.s.l.), (c) forest (N 50.14157, E 8.98389; 115 m a.s.l.) and (d) urban (N 50.19838, E 9.18597; 131 m a.s.l.) in the Rhine‐Main‐Observatory in Germany. Right side shows the radii used to collect data on land use and flowering plants.
FIGURE 2
FIGURE 2
Relationship between total abundance (individuals) and total biomass (g) for (a) the total malaise trap community, (b) hoverflies only, and (c) bees only across all sites, seasons, and sampling years. Each point represents one sample (48 samples in total). Predicted relationships in (a) are shown for communities with less (0.3%; yellow) versus more (3%; purple) larger‐bodied taxa based on a generalized linear mixed model. These example body size values were used to avoid predicting on the boundary of the minimum and maximum body size values (both shown in panel a).
FIGURE 3
FIGURE 3
Proportion of each Malaise trap community comprised of each insect taxonomic group across sites and seasons averaged across 2019, 2020, and 2021. Note two different y‐axis scales are used to visualize the proportion of dominant (0%–100%) and rare taxa (0%–6%) in the same plot. Additionally, orders Plecoptera and Odonata are present in some samples, but never comprise enough of the community to be visible and so are not shown.
FIGURE 4
FIGURE 4
Venn diagrams of the percent of total variance explained by land use, weather/climate, and flowering plants for focal pollinator abundance, focal pollinator richness, and the abundance of other insects. Percentages are derived from the associated variation partitioning analyses.
FIGURE 5
FIGURE 5
Redundancy Analysis (RDA) of the abundance of (a) each focal pollinator family (blue) and (b) each group of other insects (blue) in relation to weather & climate (black) for all sites, seasons, and years (gray points indicate positions of individual community samples).
FIGURE 6
FIGURE 6
Redundancy Analysis (RDA) of the richness of each focal pollinator family (blue) in relation to weather & climate (black) for all sites, seasons, and years (gray points indicate positions of individual community samples).
FIGURE 7
FIGURE 7
Redundancy Analysis (RDA) of the abundance of each group of other insects (blue) in relation to (a, b) land use and (c, d) flowering plants for all sites, seasons, and years. Colored points indicate the ordination positions of individual community samples (brown = samples from the site dominated by forest cover; green = open land; gold = agricultural; red = urban).
FIGURE 8
FIGURE 8
Redundancy Analysis (RDA) of the abundance of each focal pollinator family (blue) in relation to (a, b) land use and (c, d) flowering plants for all sites, seasons, and years. Colored points indicate the ordination positions of individual community samples (brown = samples from the site dominated by forest cover; green = open land; gold = agricultural; red = urban).
FIGURE 9
FIGURE 9
Redundancy Analysis (RDA) of the richness of each focal pollinator family (blue) in relation to (a, b) land use and (c, d) flowering plants for all sites, seasons, and years. Colored points indicate the ordination positions of individual community samples (brown = samples from the site dominated by forest cover; green = open land; gold = agricultural; red = urban).

References

    1. Amiet, F. , and Krebs A.. 2019. Bienen Mitteleuropas: Gattungen, Lebensweise, Beobachtung. Haupt Verlag.
    1. Anderson, M. J. , Ellingsen K. E., and McArdle B. H.. 2006. “Multivariate Dispersion as a Measure of Beta Diversity.” Ecology Letters 9, no. 6: 683–693. 10.1111/j.1461-0248.2006.00926.x. - DOI - PubMed
    1. Bale, J. S. , and Hayward S. A. L.. 2010. “Insect Overwintering in a Changing Climate.” Journal of Experimental Biology 213, no. 6: 980–994. 10.1242/jeb.037911. - DOI - PubMed
    1. Bartoń, K. 2024. “MuMIn: Multi‐Model Inference. R Package Version 1.47.5.” https://CRAN.R‐project.org/package=MuMIn.
    1. Buchner, D. , Sinclair J. S., Ayasse M., et al. 2025. “Upscaling Biodiversity Monitoring: Metabarcoding Estimates 31,846 Insect Species From Malaise Traps Across Germany.” Molecular Ecology Resources 25, no. 1: e14023. 10.1111/1755-0998.14023. - DOI - PMC - PubMed

LinkOut - more resources