. 2025 Jun 2;7(9):101468.
doi: 10.1016/j.jhepr.2025.101468. eCollection 2025 Sep.

Impact of genetic variants linked to liver fat and liver volume on MRI-mapped body composition

Affiliations

Impact of genetic variants linked to liver fat and liver volume on MRI-mapped body composition

Shafqat Ahmad et al. JHEP Rep. .

Abstract

Background & aims: A quarter of the world population is estimated to have metabolic dysfunction-associated steatotic liver disease. Here, we aim to understand the impact of liver trait-associated genetic variants on fat content and tissue volume across organs and body compartments and on a large set of biomarkers.

Methods: Genome-wide association analyses were performed on liver fat and liver volume estimated with magnetic resonance imaging in up to 27,243 unrelated European participants from the UK Biobank. Identified variants were assessed for associations with fat fraction and tissue volume in >2 million 'Imiomics' image elements in 22,261 individuals and with circulating biomarkers in 310,224 individuals.

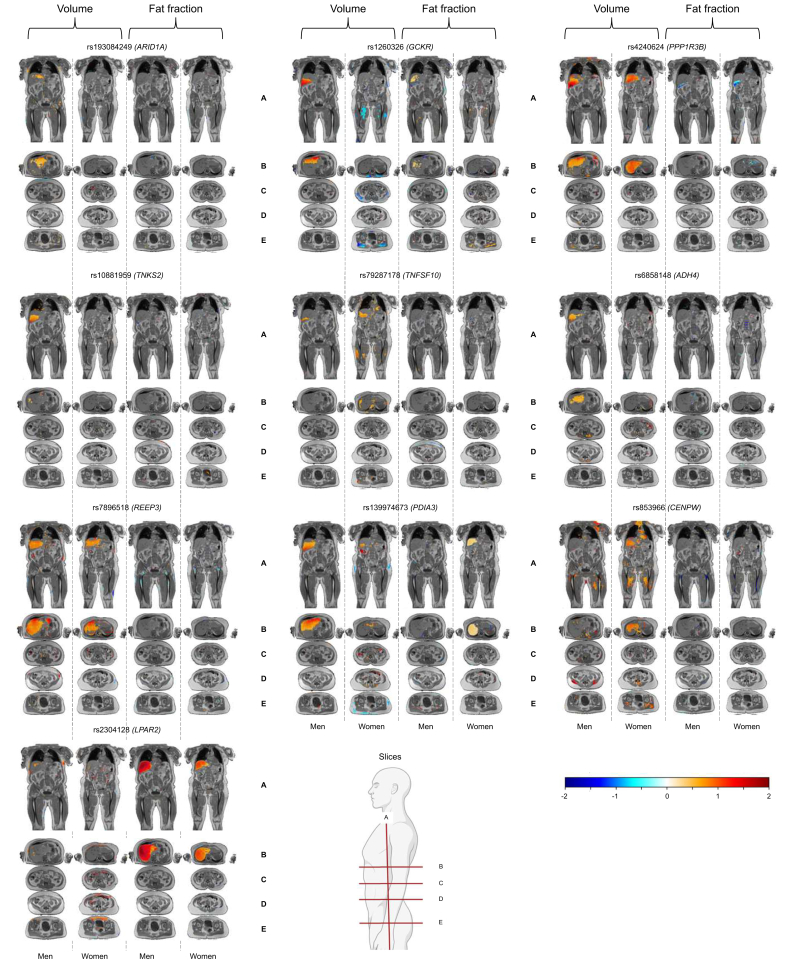
Results: We confirmed four liver fat and nine liver volume previously reported genetic variants (p values <5 × 10⁻⁸). We further found evidence suggestive of a novel liver volume locus, ADH4, where each additional T allele increased liver volume by 0.05 SD (SE = 0.01, p value = 3.3 × 10⁻⁸). The Imiomics analyses showed that liver fat-increasing variants were specifically associated with fat fraction of the liver tissue (p values <2.8 × 10⁻³) and with higher inflammation, liver and renal injury biomarkers, and lower lipid levels. Associations of liver volume variants with fat content, tissue volume, and biomarkers were more heterogeneous, for example the liver volume-increasing alleles at CENPW and PPP1R3B were associated with higher skeletal muscle volumes and were more pronounced in men, whereas the GCKR variant was negatively associated with lower skeletal muscle volumes in women (p values <2.8 × 10⁻³).

Conclusions: Liver fat-increasing variants were mostly linked to fat fraction of the liver and were positively associated with some adverse metabolic biomarkers and negatively with lipids. In contrast, liver volume-associated variants showed a less consistent pattern across organs and biomarkers.

Impact and implications: Liver fat and liver volume are common metabolic traits with a strong genetic component, yet the extent to which they exert organ-specific vs. systemic effects remains poorly defined. By integrating genome-wide association analyses and high-resolution neck-to-knee magnetic resonance imaging data through the Imiomics framework, this study reveals distinct genetic architectures for liver fat and liver volume, including sex-specific effects. These findings provide new insights into the biological, organ-level, tissue-specific, and systemic characteristics of steatotic liver disease and its genetic determinants. The results may inform the development of precision imaging genetic approaches, biomarker discovery, and stratified risk assessment strategies, while reinforcing the importance of incorporating sex-specific analyses in future research and clinical applications.

Keywords: Chronic liver disease; Genetic variation; Metabolic disease; Metabolic dysfunction-associated steatotic liver disease.


Conflict of interest statement

JK and HA are co-founders, co-owners of, and part-time employees of Antaros Medical AB, BioVenture Hub, Mölndal, Sweden. JCC receives a salary from Sirona AB. Her contribution to this manuscript was performed prior to commencing employment. GDC was affiliated with the University of Copenhagen during the conduct of this research. He is currently employed at Novo Nordisk. This work was completed before his employment and was not funded or influenced by Novo Nordisk. Other co-authors reported no potential conflicts of interest relevant to this article. Please refer to the accompanying ICMJE disclosure forms for further details.

Figures

Image 1
Graphical abstract
Fig. 1
Fig. 1
Neck-to-knee voxel maps of volume and fat fraction for four liver fat variants. The figure shows statistical 3D associations between magnetic resonance imaging (MRI) data and single nucleotide polymorphism (SNP) in men and women. Each panel displays volume maps for men, volume maps for women, fat fraction maps for men, and fat fraction maps for women. Linear regression models were used in these analyses, adjusting for age, age squared, total body fat, height, and 20 principal components stratified by sex. p values were corrected with the Bonferroni method for 18 pre-defined body areas. Significant associations (p value <2.8 × 10⁻³) are color-coded from negative (blue) to positive (red). For visualization purposes clipped beta values (from the lower 1% to the highest 1%) were for each experiment linearly rescaled between -2 and +2 maintaining the sign of the association. Non-significant regions are uncolored and instead show underlying anatomical MRI images for reference. Coronal slices (A) and axial slices at the liver (B), kidneys (C), abdomen (D), and hip (E) are shown. APOE, apolipoprotein E; PNPLA3, patatin like domain 3, 1-acylglycerol-3-phosphate O-acyltransferase; TM6SF2, transmembrane 6 superfamily member 2.
Fig. 2
Fig. 2
Neck-to-knee voxel maps of volume and fat fraction for 10 liver volume variants. The figure shows statistical 3D associations between magnetic resonance imaging (MRI) data and single nucleotide polymorphism (SNP) in men and women. Each panel displays volume maps for men, volume maps for women, fat fraction maps for men, and fat fraction maps for women. Linear regression models were used in these analyses, adjusting for age, age squared, total body fat, height, and 20 principal components stratified by sex. p values were corrected with the Bonferroni method for 18 pre-defined body areas. Significant associations (p value <2.8 × 10⁻³) are color-coded from negative (blue) to positive (red). For visualization purposes clipped beta values (from the lower 1% to the highest 1%) were for each experiment linearly rescaled between -2 and +2 maintaining the sign of the association. Non-significant regions are uncolored and instead show underlying anatomical MRI images for reference. Coronal slices (A) and axial slices at the liver (B), kidneys (C), abdomen (D), and hip (E) are shown. ADH4, alcohol dehydrogenase 4; ARID1A, AT-rich interaction domain 1A; CENPW, centromere protein W; GCKR, glucokinase regulatory protein; LPAR2, lysophosphatidic acid receptor 2; PDIA3, protein disulfide isomerase family A member 3; PPP1R3B, protein phosphatase 1 regulatory subunit 3B; REEP3, receptor accessory protein 3; TNFSF10, tumor necrosis factor ligand superfamily member 10; TNKS2, tankyrase 2.
Fig. 3
Fig. 3
Associations of liver fat and liver volume variants with biomarkers and liver disease. Each row in the heatmap represents a liver fat or liver volume genetic variant. Liver fat variants are in orange, and liver volume variants are in green in the first column. Each column in the heatmap represents a biomarker or a discrete trait. The biomarkers are clustered with hierarchical clustering. The heatmap is color-coded by strength of association according to color legend. ∗p value <0.05. Linear regression models were used for analyses of continuous traits and logistic regression models for discrete traits. Models were adjusted for age, sex, genotyping array, and the first 20 principal components. All the biomarker concentrations were log-transformed before the analysis. Discrete traits are shown as natural log of the OR. ALP, alkaline phosphatase; ALT, alanine aminotransferase; AST, aspartate aminotransferase; APOA, apolipoprotein A; APOB, apolipoprotein B; CLD, chronic liver disease; CRP, C-reactive protein; GGT, gamma-glutamyl transferase; HBA1c, hemoglobin A1c; IGF1, insulin-like growth factor 1; Lp(a), lipoprotein A; MASLD, metabolic dysfunction-associated steatotic liver disease; OR, odds ratio; SHBG, sex hormone-binding globulin; WHR, waist-to-hip ratio.

References

    1. Younossi Z.M., Golabi P., Paik J.M., et al. The global epidemiology of nonalcoholic fatty liver disease (NAFLD) and nonalcoholic steatohepatitis (NASH): a systematic review. Hepatology. 2023;77:1335–1347. - PMC - PubMed
    1. Byrne C.D., Targher G. NAFLD: a multisystem disease. J Hepatol. 2015;62:S47–S64. - PubMed
    1. Ahmed A., Cule M., Bell J.D., et al. Differing genetic variants associated with liver fat and their contrasting relationships with cardiovascular diseases and cancer. J Hepatol. 2024;81:921–929. - PubMed
    1. Targher G., Byrne C.D., Tilg H. MASLD: a systemic metabolic disorder with cardiovascular and malignant complications. Gut. 2024;73:691–702. - PubMed
    1. Starekova J., Hernando D., Pickhardt P.J., et al. Quantification of liver fat content with CT and MRI: state of the art. Radiology. 2021;301:250–262. - PMC - PubMed

LinkOut - more resources