

Proteogenomic signature of Alzheimer's disease and related dementia risk in individuals with major depressive disorder
- PMID: 40823340
- PMCID: PMC12356225
- DOI: 10.1038/s44220-025-00460-0
Proteogenomic signature of Alzheimer's disease and related dementia risk in individuals with major depressive disorder
Abstract
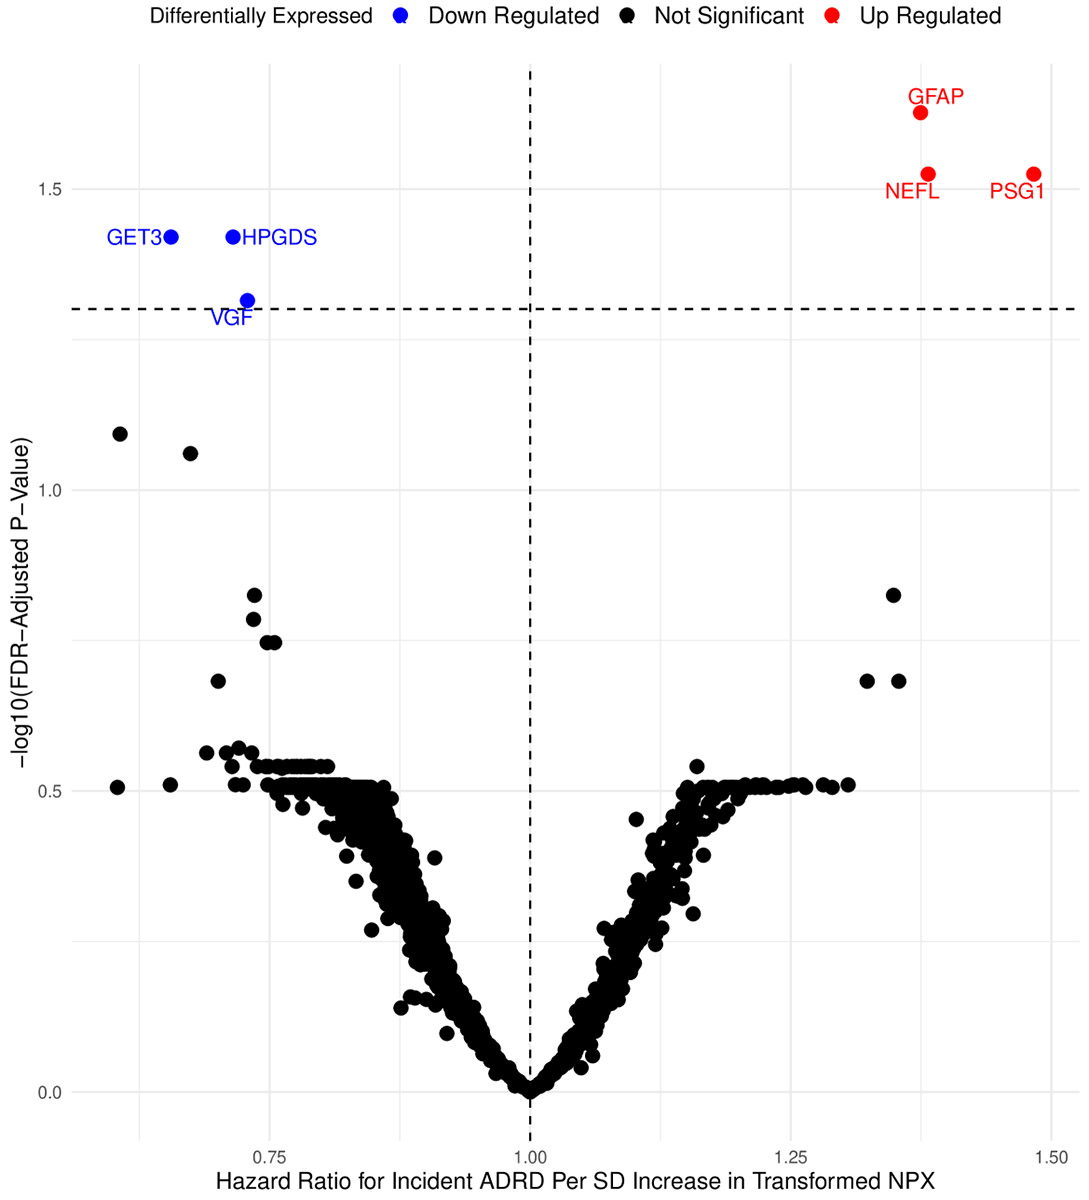
The mechanisms linking a history of major depressive disorder (MDD) to an increased risk of Alzheimer's disease and related dementia (ADRD) are not fully understood. Using the UK Biobank, we evaluated the biological mechanisms linking both conditions. In participants without history of MDD, 493 proteins were significantly associated with the risk of ADRD. In contrast, in participants with a history of MDD at baseline, a smaller set of 6 proteins were significantly associated ADRD risk (NfL, GFAP, PSG1. VGF, GET3, and HPGDS), with GET3 being specifically associated with ADRD risk in the latter group. Two-sample Mendelian randomization analysis ahowed that the APOE and IL-10 receptor subunit B genes were causally linked to incident ADRD. Finally, we developed a Proteomic Risk Score (PrRSMDD-ADRD), which showed strong discriminative power (C-statistic = 0.84) to identify participants with MDD who developed ADRD upon follow-up. Here we show that plasma proteins associated with inflammation and amyloid-β metabolism are causally linked to a higher ADRD risk in individuals with MDD. Moreover, the PrRSMDD-ADRD can be useful to identify individuals with the highest risk of developing ADRD in a highly vulnerable population.
Keywords: Alzheimer's disease; Major depressive disorder; dementia; genomics; inflammation; proteomics.
Conflict of interest statement
Competing interest: Dr. Diniz serves as a consultant to Bough Bioscience Inc in an area unrelated to this work. The other authors report no conflict of interest.
Figures


Update of
-
Proteogenomic signature of risk of Alzheimer's disease and related dementia risk in individuals with a history of major depression disorder.medRxiv [Preprint]. 2024 Sep 12:2024.09.11.24313493. doi: 10.1101/2024.09.11.24313493. medRxiv. 2024. Update in: Nat Ment Health. 2025 Aug;3(8):879-888. doi: 10.1038/s44220-025-00460-0. PMID: 39314945 Free PMC article. Updated. Preprint.
Similar articles
-
Proteogenomic signature of risk of Alzheimer's disease and related dementia risk in individuals with a history of major depression disorder.medRxiv [Preprint]. 2024 Sep 12:2024.09.11.24313493. doi: 10.1101/2024.09.11.24313493. medRxiv. 2024. Update in: Nat Ment Health. 2025 Aug;3(8):879-888. doi: 10.1038/s44220-025-00460-0. PMID: 39314945 Free PMC article. Updated. Preprint.
-
The Black Book of Psychotropic Dosing and Monitoring.Psychopharmacol Bull. 2024 Jul 8;54(3):8-59. Psychopharmacol Bull. 2024. PMID: 38993656 Free PMC article. Review.
-
Downward bias in the association between APOE and Alzheimer's Disease using prevalent and by-proxy disease sampling in the All of Us Research Program.medRxiv [Preprint]. 2025 May 23:2025.05.22.25328175. doi: 10.1101/2025.05.22.25328175. medRxiv. 2025. PMID: 40568661 Free PMC article. Preprint.
-
Plasma and cerebrospinal fluid amyloid beta for the diagnosis of Alzheimer's disease dementia and other dementias in people with mild cognitive impairment (MCI).Cochrane Database Syst Rev. 2014 Jun 10;2014(6):CD008782. doi: 10.1002/14651858.CD008782.pub4. Cochrane Database Syst Rev. 2014. PMID: 24913723 Free PMC article.
-
Prescription of Controlled Substances: Benefits and Risks.2025 Jul 6. In: StatPearls [Internet]. Treasure Island (FL): StatPearls Publishing; 2025 Jan–. 2025 Jul 6. In: StatPearls [Internet]. Treasure Island (FL): StatPearls Publishing; 2025 Jan–. PMID: 30726003 Free Books & Documents.
References
-
- Morris G, et al. Shared pathways for neuroprogression and somatoprogression in neuropsychiatric disorders. Neurosci Biobehav Rev 107, 862–882 (2019). - PubMed
-
- Lynch CJ, Gunning FM & Liston C Causes and Consequences of Diagnostic Heterogeneity in Depression: Paths to Discovering Novel Biological Depression Subtypes. Biol Psychiatry 88, 83–94 (2020). - PubMed
-
- Whiteford HA, et al. Global burden of disease attributable to mental and substance use disorders: findings from the Global Burden of Disease Study 2010. Lancet 382, 1575–1586 (2013). - PubMed
Grants and funding
LinkOut - more resources
Full Text Sources
Miscellaneous