. 2025;19(8):888-897.
doi: 10.1038/s41566-025-01695-0. Epub 2025 Jun 5.

Structured detection for simultaneous super-resolution and optical sectioning in laser scanning microscopy

Affiliations

Structured detection for simultaneous super-resolution and optical sectioning in laser scanning microscopy

Alessandro Zunino et al. Nat Photonics. 2025.

Abstract

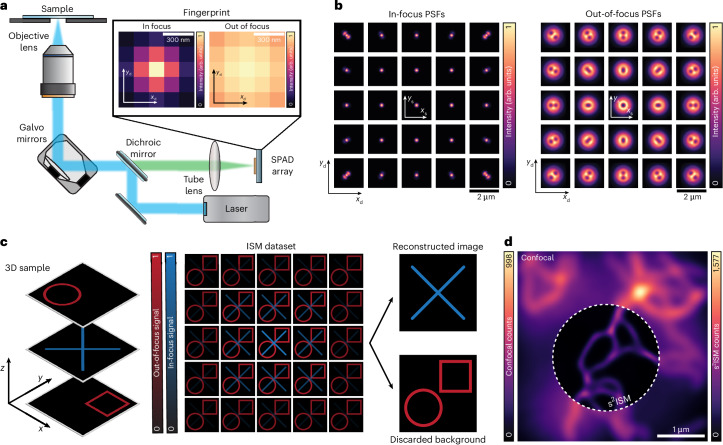
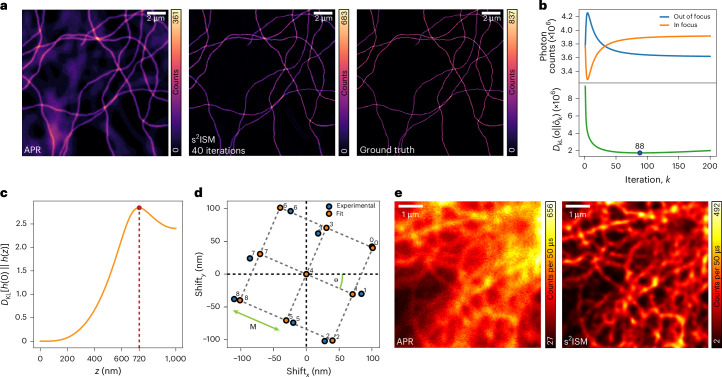
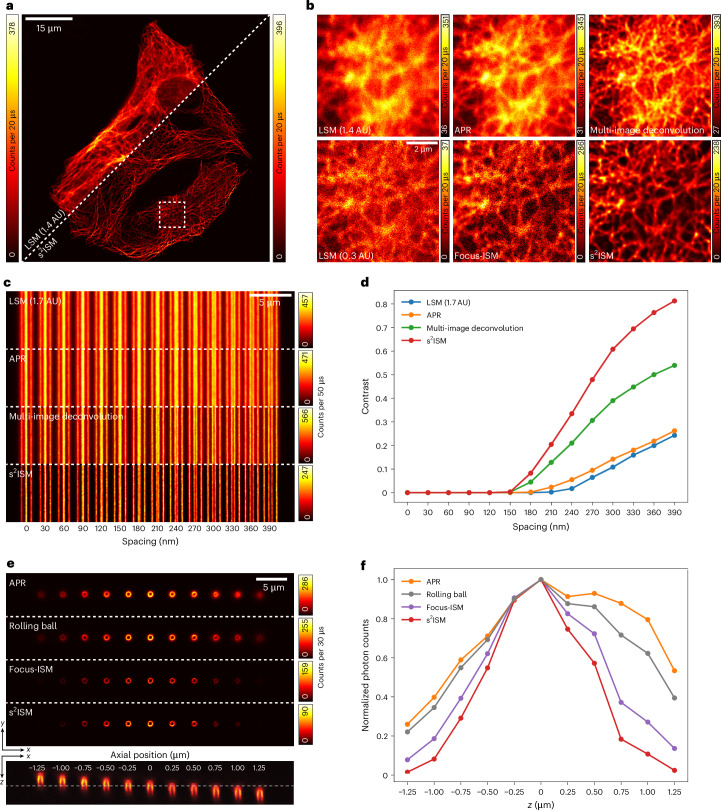
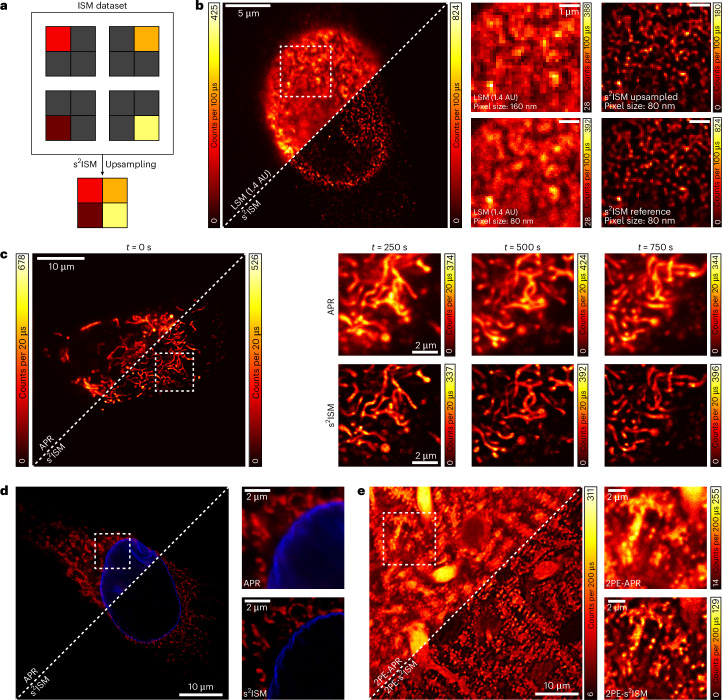
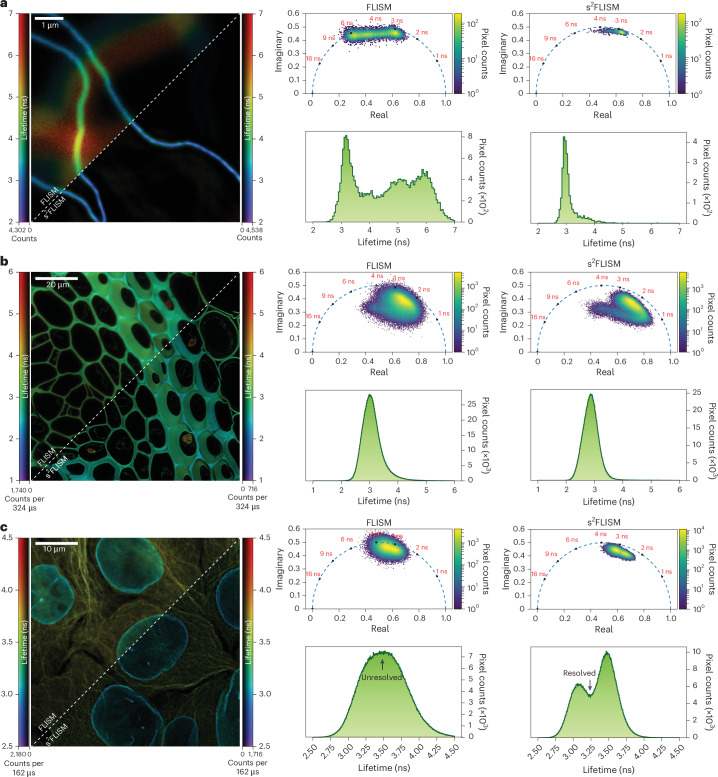
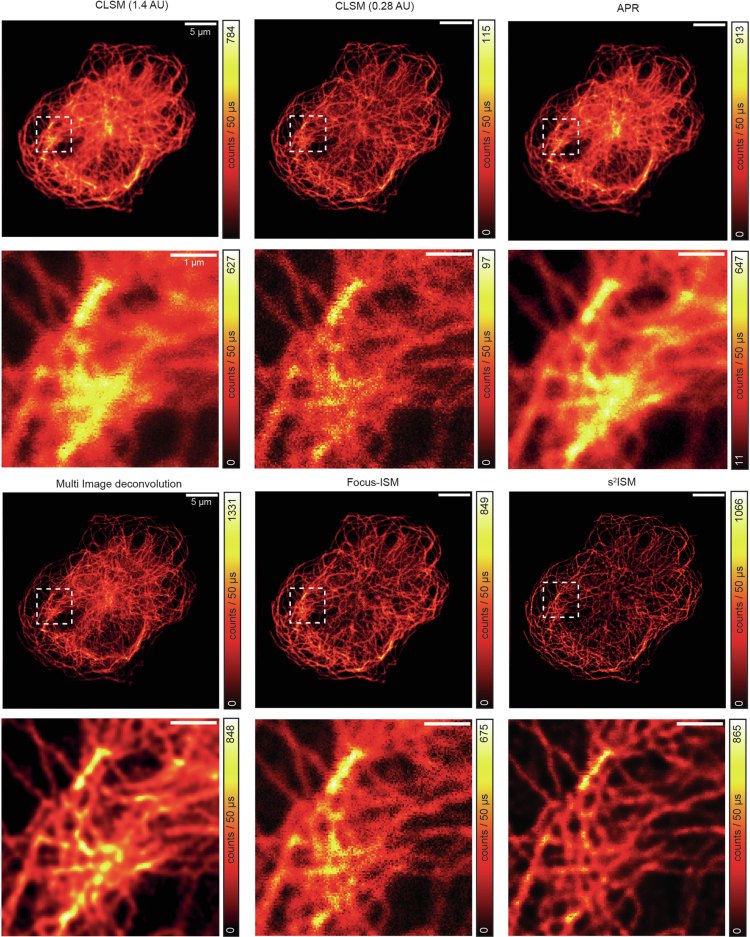
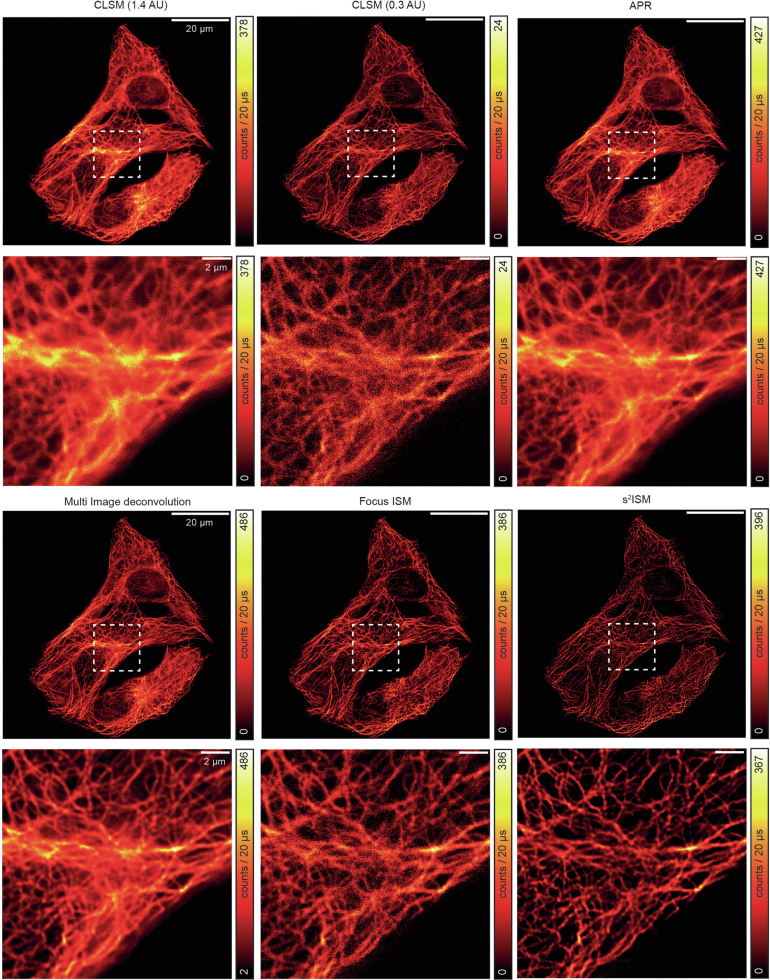
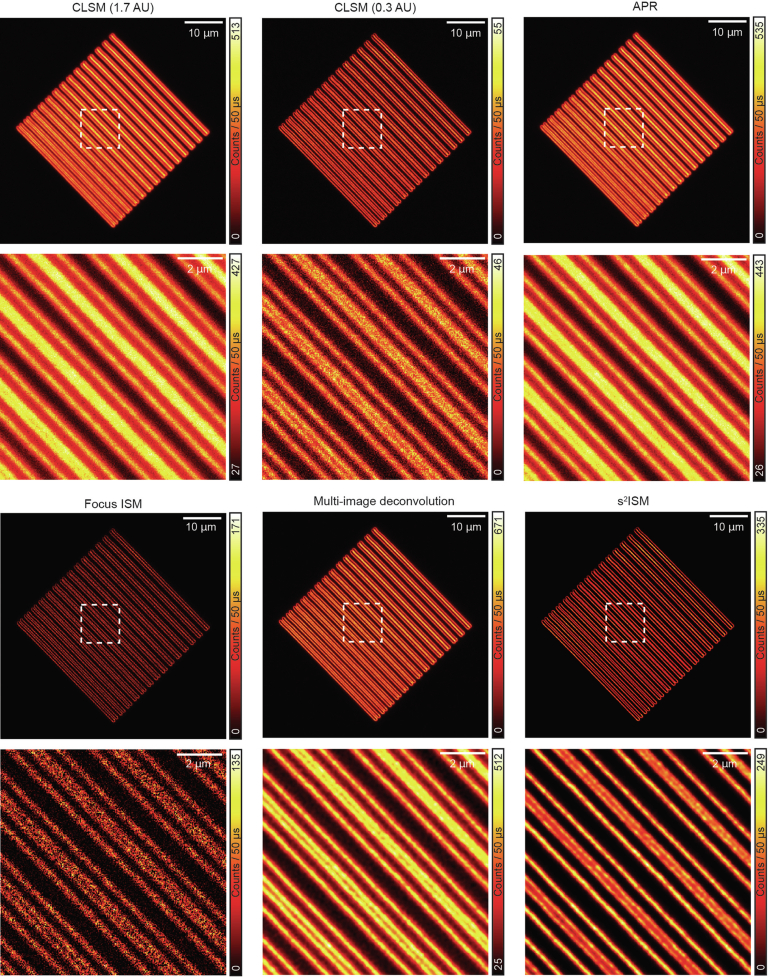
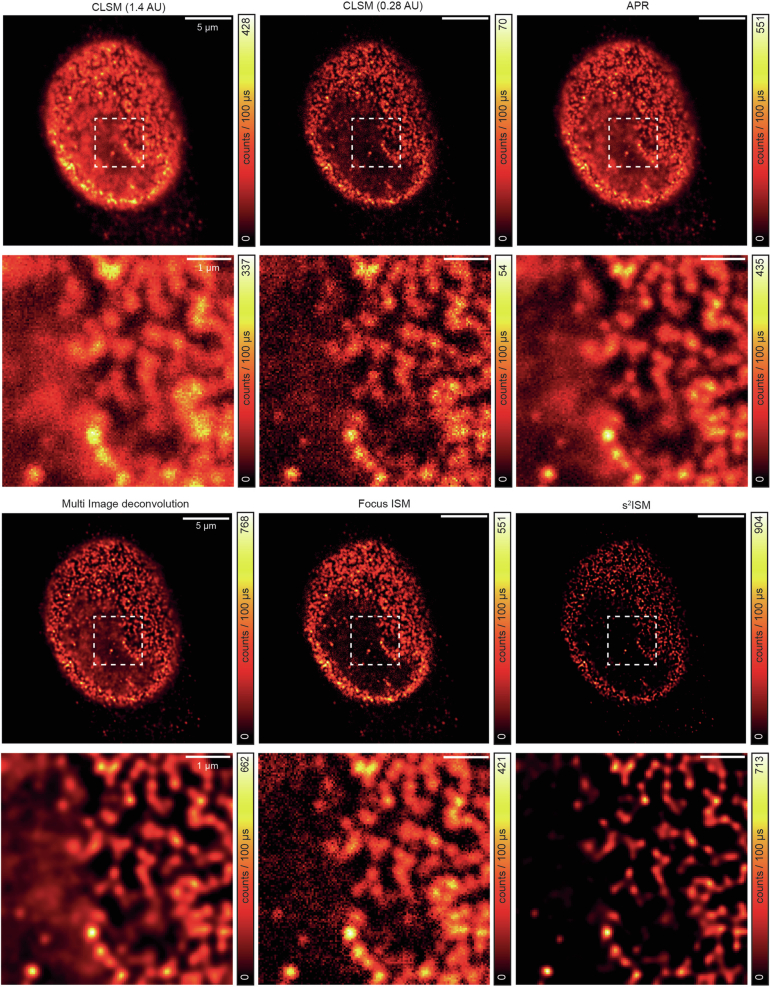
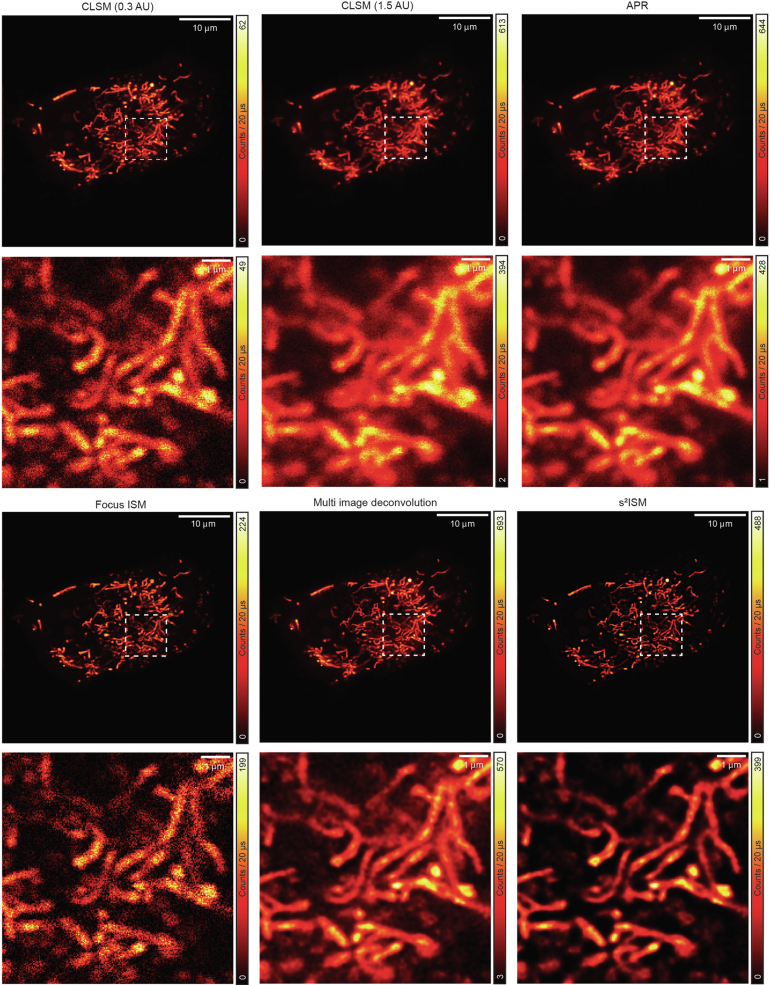
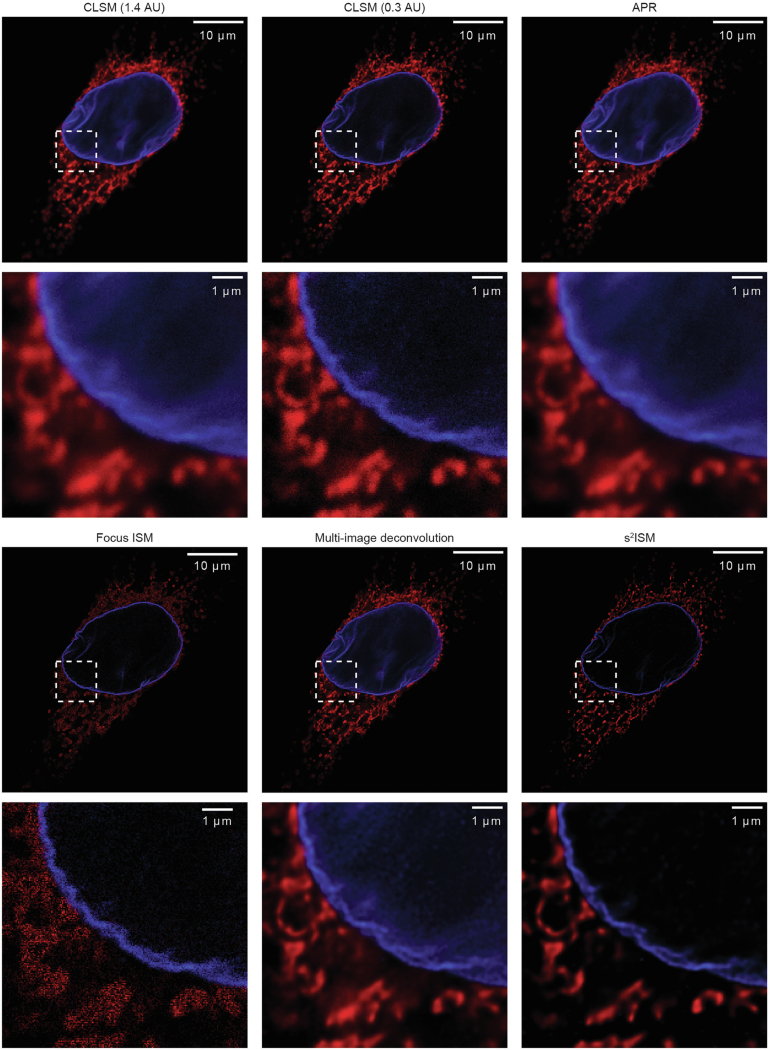
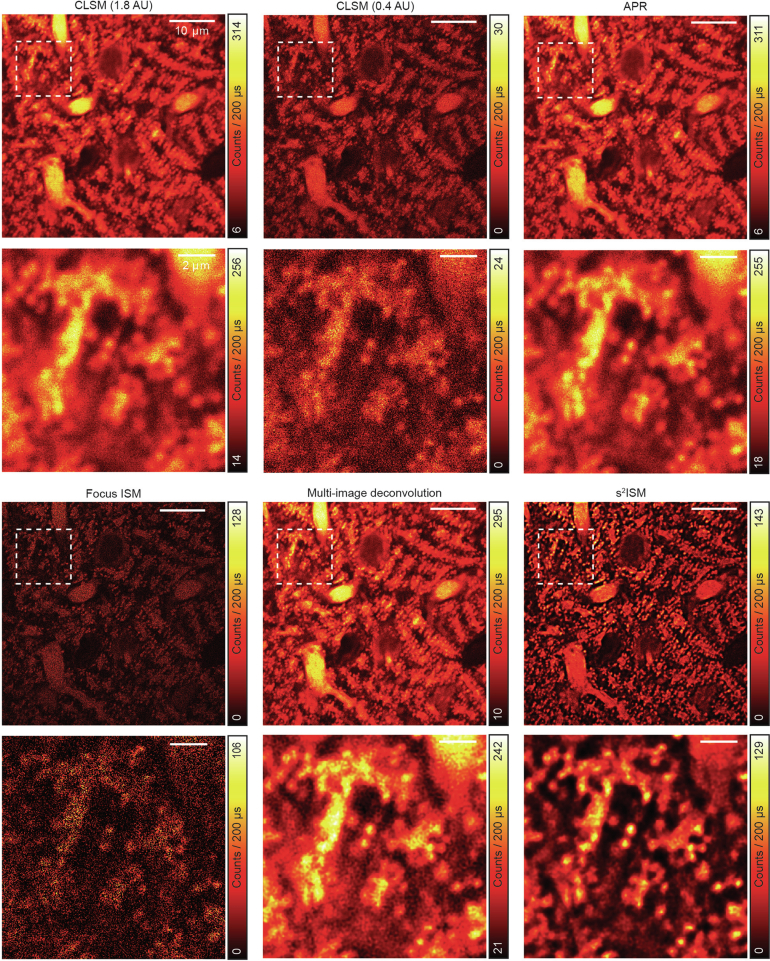
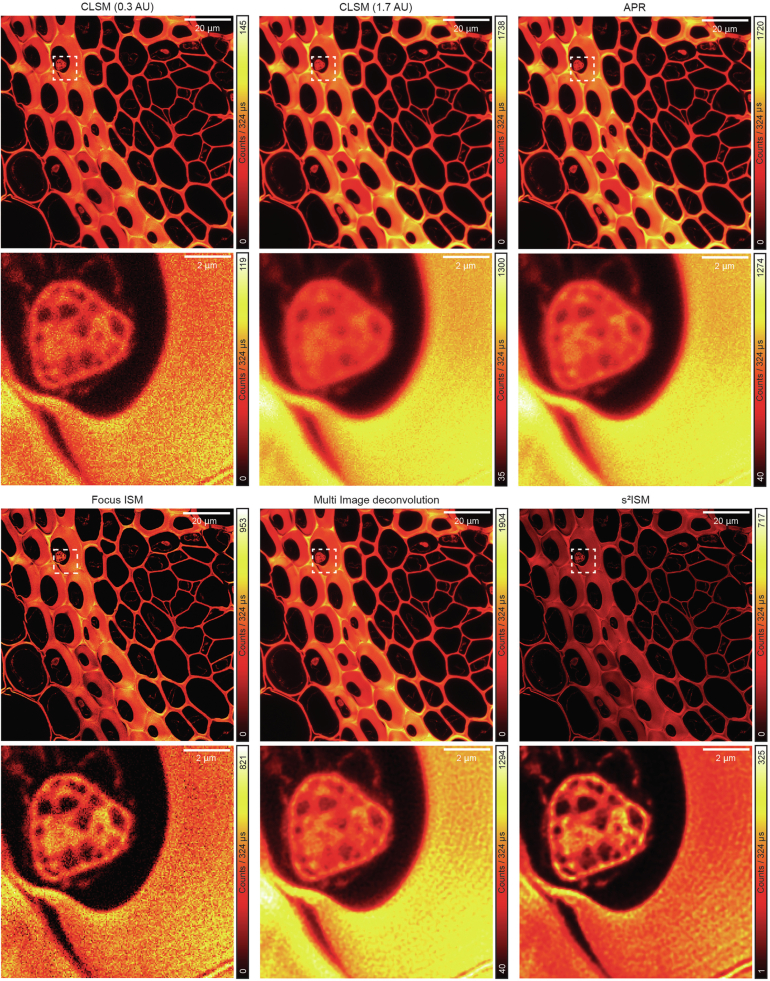
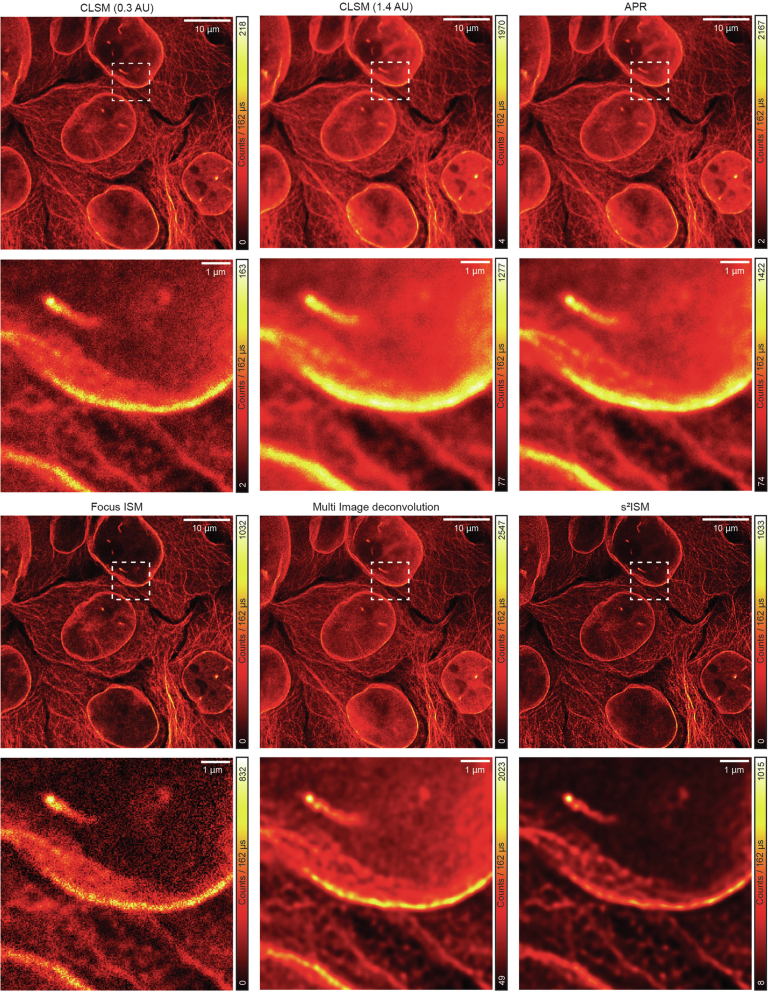
Fast detector arrays enable an effective implementation of image scanning microscopy, which overcomes the trade-off between spatial resolution and signal-to-noise ratio of confocal microscopy. However, current image scanning microscopy approaches do not provide optical sectioning and fail with thick samples unless the detector size is limited, thereby introducing a new trade-off between optical sectioning and signal-to-noise ratio. Here we propose a method that overcomes such a limitation. From single-plane acquisition, we reconstruct an image with digital and optical super-resolution, high signal-to-noise ratio and enhanced optical sectioning. On the basis of the observation that imaging with a detector array inherently embeds axial information, we designed a straightforward reconstruction algorithm that inverts the physical model of image scanning microscopy image formation. We present a comprehensive theoretical framework and validate our method with images of biological samples captured using a custom setup equipped with a single-photon avalanche diode array detector. We demonstrate the feasibility of our approach by exciting fluorescence emission in both linear and nonlinear regimes. Moreover, we generalize the algorithm for fluorescence lifetime imaging, fully exploiting the single-photon timing ability of the single-photon avalanche diode array detector. Our method outperforms conventional reconstruction techniques and can be extended to any laser scanning microscopy technique.

Keywords: Fluorescence imaging; Imaging and sensing; Super-resolution microscopy.


Conflict of interest statement

Competing interestsG.V. has a personal financial interest (co-founder) in Genoa Instruments, Italy. The other authors declare no competing interests.

Figures

Fig. 1
Fig. 1. ISM.
a, Sketch of an ISM device. The inset shows the fingerprints relative to the different axial positions of the sample. b, Simulated PSFs of an ideal ISM system at z = 0 nm (in focus) and z = 720 nm (out of focus) with λ = 640 nm and NA = 1.4. c, Sketch of the ISM image formation. The images of an in-focus sample appear brighter at the centre of the detector coordinate and dimmer at the periphery. The brightness of the images of the out-of-focus samples decays slower along the detector coordinate, encoding the axial information into the ISM dataset. The reconstruction algorithm builds two images from a single-plane dataset, one with the in-focus image and the background discarded. The out-of-focus sections of the sample are projected into a single image, which is subsequently discarded. d, Comparison of a confocal image with the ISM image reconstructed by the s2ISM algorithm on synthetic tubulin filaments.
Fig. 2
Fig. 2. Data-driven estimation of the parameters.
a, Simulated experiments at λ = 640 nm and z = 720 nm. Comparison of the APR image, s2ISM reconstruction and ground truth of the focal plane. b, Total number of photons per plane (top) and Kullback–Leibler divergence (DKL) of the reconstruction to the focal ground truth (bottom) at varying iteration numbers. c, DKL of the out-of-focus PSF dataset to the in-focus one. The maximum position defines the plane used for the s2ISM reconstruction. d, Experimental and fitted shift vectors from the inner 3 × 3 array detector. The fit returns the magnification, orientation and rotation parameters. e, Comparison of APR and s2ISM image of the tubulin network of a HeLa cell (mouse anti-α-tubulin combined with anti-mouse abberior STAR RED).
Fig. 3
Fig. 3. Lateral resolution and optical sectioning.
a, Confocal image (left) of the tubulin network of a HeLa cell (mouse anti-α-tubulin combined with anti-mouse abberior STAR RED) compared with the s2ISM reconstruction (right). b, Detail of the image in a (white dashed box) reconstructed using different algorithms. From left to right, the lateral resolution and SNR are improved. From top to bottom, optical sectioning is improved. Both multi-image deconvolution and s2ISM algorithms are stopped at 20 iterations. We excited the specimen using the laser wavelength λ = 640 nm. c, Compared images of a resolution target composed of gradually spaced lines. d, Corresponding modulation transfer function, experimentally measured by calculating the contrast of the dip relative to the two adjacent lines. When no dip is discernible, the contrast is set to zero. e, Compared single-plane images of a 3D stair of rings evenly spaced on the axial direction (Δz = 250 nm). On the bottom, we show the xz slice of a confocal 3D stack of the same target. The dashed line indicates the axial plane of the images above. f, Corresponding normalized optical sectioning function, calculated by summing the photon counts from each ring. We excited both targets using the laser wavelength λ = 488 nm.
Fig. 4
Fig. 4. Generalization of s2ISM.
a, Sketch of the upsampling working principle. The images of the ISM dataset are shifted, and the mutual redundancy can be used to fill the gaps and reconstruct an image on a finer grid than that generated by the acquisition process. b, Results of s2ISM reconstruction with and without upsampling at the same target pixel size of 80 nm. The sample is an immunostained HeLa cell for nuclear pore complexes on the nucleus surface (rabbit anti-Nup-153 combined with anti-rabbit abberior STAR 635P). c, Time series of a live HeLa cell with stained mitochondria (MitoTracker Orange). d, Multicolour imaging of a fixed HeLa cell with mitochondria and nuclear membrane immunostained with two different fluorophores (mouse anti-ATP synthase combined with anti-mouse Alexa 647 and rabbit anti-lamin B1 combined with anti-rabbit Alexa 488, respectively). e, 2PE imaging of Purkinje cells in a slice of a mouse’s cerebellum at a depth of roughly 10 μm.
Fig. 5
Fig. 5. FLIM with s2ISM.
a, Simulation of tubulin filaments with different lifetime values (numerical aperture, 1.4, λ = 640 nm). The in-focus filaments have a lifetime value of τ = 3 ns, whereas the out-of-focus (z = 720 nm) filaments have a lifetime value of either τ = 3 ns or τ = 6 ns. b, Experimental image of a rhizome of C. majalis stained with acridine orange, excited with λ = 488 nm. c, Experimental image of HeLa cells with tubulin stained with STAR RED (τ = 3.4 ns) and lamin A on the nuclear membrane stained with STAR 635 (τ = 2.8 ns). Both fluorophores are excited with the same source at λ = 640 nm. The intensity of each image is normalized to its maximum. The phasor plots and histograms are thresholded at 5% of the maximum intensity of the corresponding image. Lifetime values are calculated from the magnitude of the phasors.
Extended Data Fig. 1
Extended Data Fig. 1. Tubulin network of a HeLa cell.
Extended images from Fig. 2. Field-of-view: 35 μm × 35 μm. Image size: 875 × 875 pixels. Pixel dwell time: 50 μs. Excitation laser: λ = 640 nm, CW. Average power at the sample plane: 1.2 μW. s2ISM and multi-Image deconvolution iterations: 20.
Extended Data Fig. 2
Extended Data Fig. 2. Tubulin network of a group of HeLa cells.
Extended images from Fig. 3a–b. Field-of-view: 80 μm × 80 μm. image size: 2000 × 2000 pixels. Pixel dwell time: 20 μs. Excitation laser: λ = 640 nm, CW. Average power at the sample plane: 2.6 μW. s2ISM and multi-Image deconvolution iterations: 20.
Extended Data Fig. 3
Extended Data Fig. 3. Gradually spaced lines.
Extended images from Fig. 3a. Field-of-view: 60 μm × 60 μm. Image size: 1500 × 1500 pixels. Pixel dwell time: 50 μs. Excitation laser: λ = 488 nm, CW. Average power at the sample plane: 10.9 μW. s2ISM and multi-Image deconvolution iterations: 20.
Extended Data Fig. 4
Extended Data Fig. 4. Nuclear pore complexes in a HeLa cell.
Extended images from Fig. 4b. Field-of-view: 25 μm × 25 μm. Image size: 625 × 625 pixels. Pixel dwell time: 100 μs. Excitation laser: λ = 640 nm, CW. Average power at the sample plane: 14.7 μW. s2ISM and multi-Image deconvolution iterations: 20.
Extended Data Fig. 5
Extended Data Fig. 5. Live-cell imaging of mitochondria.
Extended images from a single frame of the sequence in Fig. 4c. Field-of-view: 60 μm × 60 μm. Image size: 1500 × 1500 pixels. Pixel dwell time: 20 μs. Excitation laser: λ = 561 nm, CW. Average power at the sample plane: 1.8 μW. Framerate: 25 seconds/frame. s2ISM and multi-Image deconvolution iterations: 10.
Extended Data Fig. 6
Extended Data Fig. 6. Multi-color imaging of a HeLa cell.
Extended images from Fig. 4d. Field-of-view: 65 μm × 65 μm. Image size: 1625 × 1625 pixels. Pixel dwell time: 20 μs for both channels. Blue excitation laser: λ = 488 nm, CW. Average power at the sample plane: 1.6 μW. Red excitation laser: λ = 640 nm, CW. Average power at the sample plane: 4.2 μW. s2ISM and multi-Image deconvolution iterations: 20.
Extended Data Fig. 7
Extended Data Fig. 7. Two-photon excitation imaging of Purkinje cells in a cerebellum slice.
Extended images from Fig. 4e. Field-of-view: 50 μm × 50 μm. Image size: 1250 × 1250 pixels. Excitation laser: λ = 900 nm, pulsed at 80 MHz. Average power at the sample plane: 10.8 mW. s2ISM and multi-Image deconvolution iterations: 20.
Extended Data Fig. 8
Extended Data Fig. 8. Convallaria Majalis rhizome.
Extended images from Fig. 5b. Field-of-view: 100 μm × 100 μm. Image size: 2000 × 2000 pixels. Pixel dwell time: 324 μs. Excitation laser: λ = 488 nm, pulsed at 40 MHz. Average power at the sample plane: 9.1 nW. s2ISM and multi-Image deconvolution iterations: 10.
Extended Data Fig. 9
Extended Data Fig. 9. Nuclei and tubulin network in Hela cells.
Extended images from Fig. 5c. Field-of-view: 50 μm × 50 μm. Image size: 1250 × 1250 pixels. Pixel dwell time: 162 μs. Excitation laser: λ = 640 nm, pulsed at 40 MHz. Average power at the sample plane: 0.7 μW. s2ISM and multi-Image decon- volution iterations: 10.

Similar articles

References

    1. Mertz, J. Optical sectioning microscopy with planar or structured illumination. Nat. Methods8, 811–819 (2011). - PubMed
    1. Zhang, J. et al. Optical sectioning methods in three-dimensional bioimaging. Light: Sci. Appl.14, 11 (2025). - PMC - PubMed
    1. Macias-Garza, F., Bovik, A. C., Diller, K. R., Aggarwal, S. J. & Aggarwal, J. K. The missing cone problem and low-pass distortion in optical serial sectioning microscopy. IEEE Trans. Acoust., Speech, Signal Process.2, 890–893 (1988).
    1. Mertz, J. Introduction to Optical Microscopy 2nd edn (Cambridge Univ. Press, 2019).
    1. Huisken, J., Swoger, J., Bene, F. D., Wittbrodt, J. & Stelzer, E. H. K. Optical sectioning deep inside live embryos by selective plane illumination microscopy. Science305, 1007–1009 (2004). - PubMed

LinkOut - more resources