. 2025 Aug 11;53(15):gkaf788.
doi: 10.1093/nar/gkaf788.

Internal ribosome entry sites enhance translation in trans in antisense non-coding SINEUP and circular RNAs

Affiliations

Internal ribosome entry sites enhance translation in trans in antisense non-coding SINEUP and circular RNAs

Sabrina D'Agostino et al. Nucleic Acids Res. .

Abstract

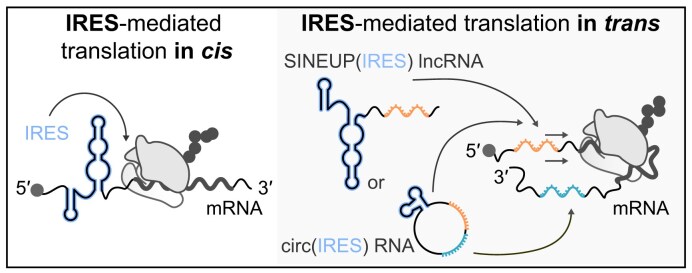
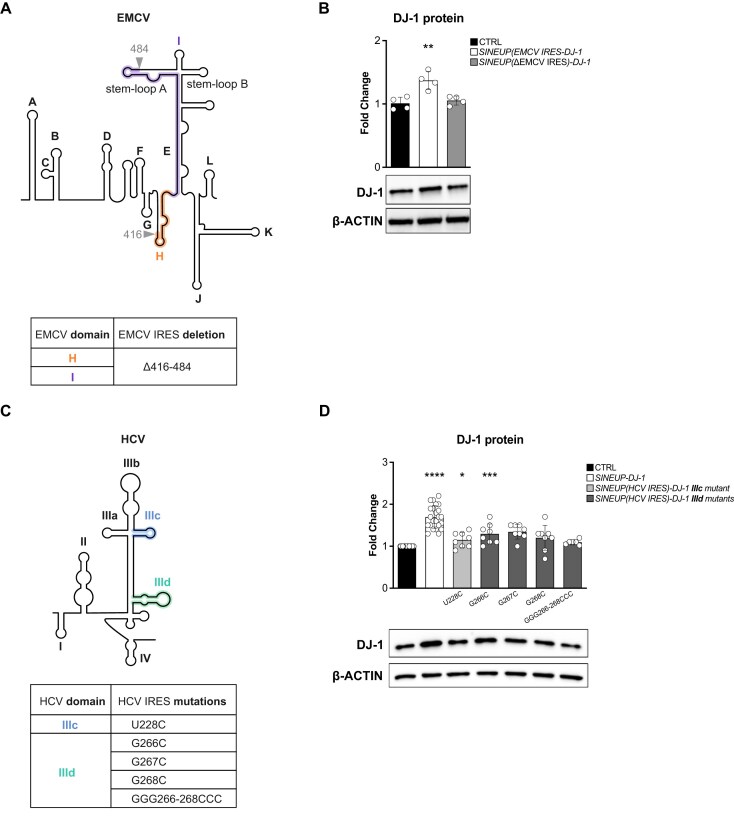
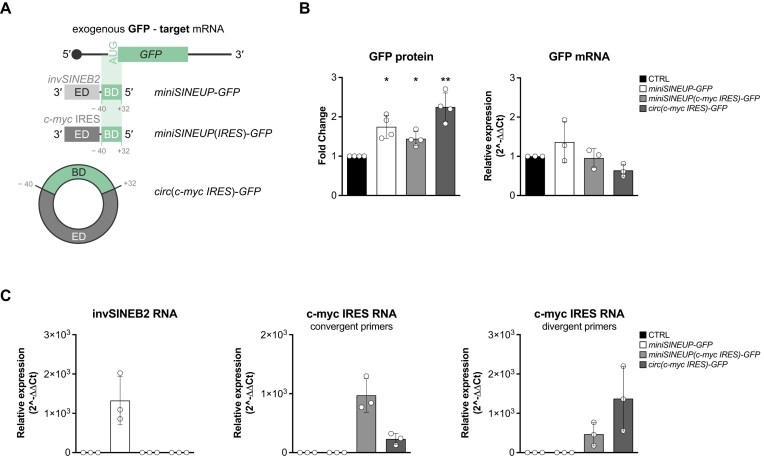
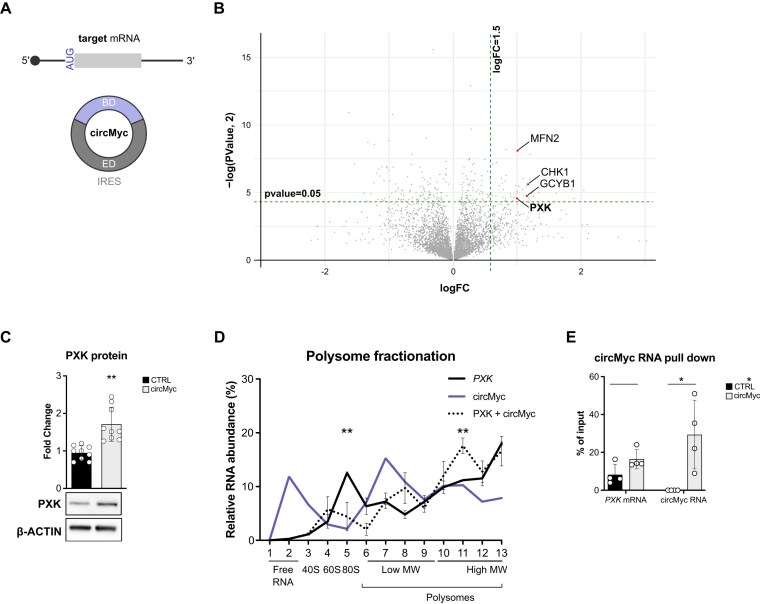
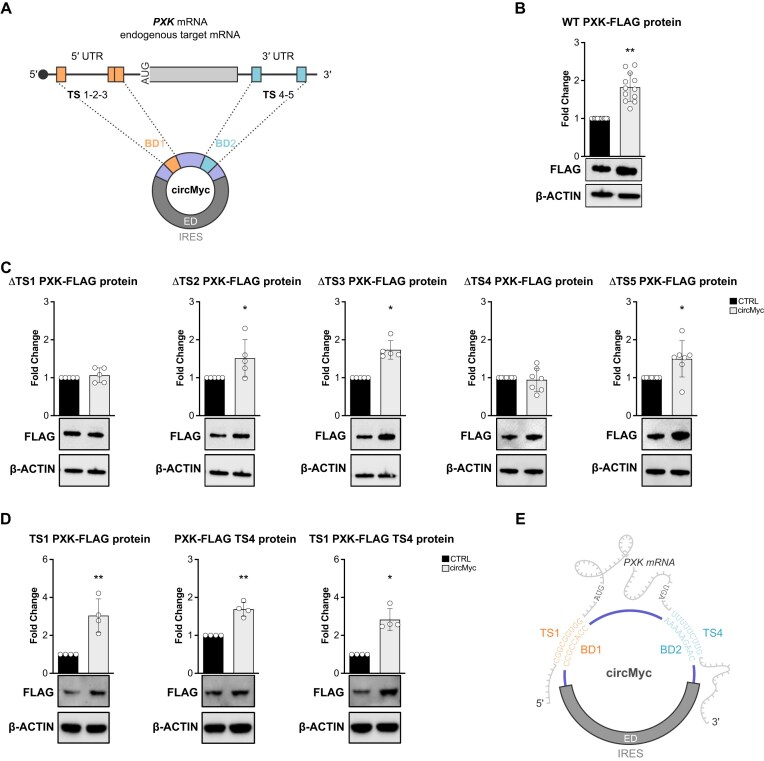
Sequences in the 5'-untranslated regions of cellular and viral mRNAs can function as internal ribosome entry sites (IRESs), driving cis-acting translation of the downstream protein-coding open reading frame. Here we demonstrate that RNA sequences with either newly identified or well-characterized IRES activity can also induce trans-acting translation of an independent mRNA species through an antisense sequence. SINEUPs are antisense long non-coding RNAs that enhance the translation of overlapping sense mRNAs in trans by employing two critical domains: the invSINEB2 sequence, which up-regulates translation (effector domain), and an antisense region providing target specificity (binding domain). First, we show that the invSINEB2 from the natural SINEUP AS Uchl1 RNA acts as an IRES when functioning in cis. Next, we establish that known viral and cellular sequences with IRES activity can operate in trans as an effector domain in synthetic SINEUPs. To identify natural IRES-containing non-coding RNAs with transactivity, we found that the non-coding hsa_circ_0 085 533 (circMyc), transcribed from the c-myc locus, enhances protein expression of PX Domain Containing Serine/Threonine Kinase Like (PXK) by promoting mRNA association with polysomes through antisense sequences. These results suggest that SINEUPs and some circular RNAs are trans-acting IRESs, expanding the repertoire of molecular mechanisms to regulate translation.


Conflict of interest statement

S.G., S.Z., P.C., and C.S. declare competing financial interests as co-founders of Harness Therapeutics, UK. S.G. and S.D. are co-inventors of a patent on the use of circular SINEUPs for therapy. S.G. and S.Z. are co-inventors of a patent covering the use of IRESs as an effector domain in SINEUPs.

Figures

Graphical Abstract
Graphical Abstract
Figure 1.
Figure 1.
SINEUP-DJ-1 increases DJ-1 protein translation. (A) Schematic representation of sense/antisense (S/AS) pairing of both natural and synthetic SINEUPs. The natural antisense AS Uchl1 is 5′ head-to-head divergent from its sense gene Uchl1 (target mRNA, blue). Its overlapping region (binding domain, BD, blue), consisting of 72 nucleotides, is positioned at –40/+32 relative to the start codon. The non-overlapping region contains a SINEB2 element in an inverted orientation (invSINEB2), which functions as the effector domain (ED, gray). The synthetic SINEUP-DJ-1 was designed based on the AS Uchl1 RNA structure to specifically target DJ-1 mRNA (target mRNA, light brown) while retaining the non-overlapping region. Its BD (light brown), comprising 44 nucleotides, is positioned at –40/+4 relative to the start codon. Negative controls, SINEUP-DJ-1 ΔED and SINEUP-DJ-1 ΔBD constructs, which lack the ED and BD, respectively, are also shown. (B) Synthetic SINEUP-DJ-1 activity. Constructs were transiently transfected into HEK293T cells and tested as described in the Materials and methods. SINEUP activity was assessed 48 h post-transfection and compared with the empty pCS2+ vector (CTRL). Whole-cell lysates were analyzed by western blotting using anti-DJ-1 and anti-β-ACTIN antibodies. Representative western blot images are shown. SINEUP-DJ-1-transfected cells showed increased levels of endogenous DJ-1 protein, whereas SINEUP-DJ-1 ΔED and SINEUP-DJ-1 ΔBD RNAs exhibited no activity. Plots represent the fold change in protein expression levels (mean ± SD) from independent biological replicates (n = 5). Statistical significance was determined using ordinary one-way ANOVA with Holm–Sidak's multiple comparisons test. *P < 0.05, **P < 0.01, ***P < 0.001, and ****P < 0.0001. Comparisons were made against the control condition unless otherwise specified. (C) SINEUP-DJ-1 RNA pull-down (RPD). SINEUP-DJ-1 was purified using a 115 nucleotide biotinylated RNA probe. As a negative control, RPD was performed in the absence of probes (data not shown). RT–qPCR results indicate the enrichment of SINEUP-DJ-1 and DJ-1 mRNA following SINEUP-DJ-1 RPD. The plot represents the percentage of enrichment (%) over the input (mean ± SD) from independent biological replicates (n = 5). Statistical significance was determined using unpaired t-test. *P < 0.05, **P < 0.01, ***P < 0.001, and ****P < 0.0001. Comparisons were made against the control condition unless otherwise specified. (D) Polysome fractionation profile. Total lysates were fractionated on sucrose gradients. Gradient fractions were separated using a UV detector, which continuously measured absorbance at 260 nm, generating a polysome profile. (E) Relative RNA abundance. Total lysates were fractionated on sucrose gradients. The relative distribution (%) of SINEUP-DJ-1 and SINEUP ΔBD RNAs was analyzed by RT–qPCR across 15 gradient fractions. RNA distributions are presented as the mean ± SD from independent biological replicates (n = 3). Statistical significance was determined using ordinary one-way ANOVA with Holm–Sidak's multiple comparisons test. *P < 0.05, **P < 0.01, ***P < 0.001, and ****P < 0.0001. (F) Relative DJ-1 mRNA abundance. Total lysates were fractionated on sucrose gradients. The relative distribution (%) of DJ-1 mRNA was analyzed in the presence of SINEUP-DJ-1 or SINEUP ΔBD by RT–qPCR across 15 gradient fractions. RNA distributions are presented as mean ± SD from independent biological replicates (n = 3). Statistical significance was determined using ordinary one-way ANOVA with Holm–Sidak's multiple comparisons test. *P < 0.05, **P < 0.01, ***P < 0.001, and ****P < 0.0001. (G) SINEUP-DJ-1 RNA localization. Radiolabeled SINEUP (blue line) and SARS-CoV-2 5′ UTR (red line) RNAs were incubated with nuclease-treated RRL and loaded onto a 7–47% sucrose gradient to assess their ability to bind different ribosome fractions. Ribosomal fractions were identified based on optical density at 260 nm (black line) and confirmed via native agarose gel electrophoresis. SINEUP-DJ-1 RNA localized to both the 40S and 80S ribosome-containing fractions. A representative experiment (n = 2) is shown. (H) Electrophoretic mobility shift assay (EMSA). Radiolabeled RNAs, including the SARS-CoV-2 5′ UTR and SINEUP-DJ-1, were incubated in the presence of 500 nM of purified yeast 40S and loaded onto a 1% native agarose gel. The SARS-CoV-2 5′ UTR was used as a negative control. Free RNAs are indicated by a black triangle; band shifts are indicated by a red triangle. EMSA confirms that SINEUP-DJ-1 binds ribosomal 40S. A representative experiment (n = 3) is shown.
Figure 2.
Figure 2.
The invSINEB2 sequence shows IRES activity in cis. (A) Schematic representation of pRUF dual-luciferase reporter vectors. The negative control, empty pRUF-MCS (NO IRES), contains the CDS of both Rluc (pale green) and Fluc (pale yellow), with an MCS in between. Rluc is constitutively expressed and translated in a cap-dependent manner, whereas Fluc expression depends on the presence of an upstream candidate sequence driving translation. The pRUF-c-myc IRES (c-myc IRES, dark gray) vector was used as a positive control. The AS Uchl1 invSINEB2 (light gray) and dirSINEB2 (gray) elements were tested as candidate sequences. (B) IRES activity (bicistronic plasmids). Luciferase activity was measured 48 h after transfection. IRES activity was calculated as the ratio of Fluc to Rluc (Fluc/Rluc) luminescence and normalized to the negative control (NO IRES). Results show that the invSINEB2 element induced Fluc protein translation in cis. Plots represent the IRES activity (mean ± SD) from independent biological replicates (n = 5) performed in duplicate. Statistical significance was determined using ordinary one-way ANOVA with Holm–Sidak's multiple comparisons test. *P < 0.05, **P < 0.01, ***P < 0.001, and ****P < 0.0001. Comparisons were made against the control condition unless otherwise specified. (C) Fluc/Rluc mRNA ratio (bicistronic plasmids). The Fluc/Rluc mRNA ratio was also calculated for each sample to confirm the absence of cryptic promoter activity, with no significant variation observed. (D) Validation of bicistronic transcript integrity. To confirm the absence of splicing events mediated by the inv/dirSINEB2-spacer sequences, cDNA was amplified using two different PCRs (PCR1 and PCR2). In PCR1, a pSV40 forward primer (annealing downstream of the transcription start site and upstream of the Rluc CDS, light gray arrows) was used in combination with a reverse primer targeting the Rluc CDS (gray arrows). PCR2 was performed using the same pSV40 forward primer and a reverse primer annealing to the Fluc CDS (pale yellow arrows). The resulting amplicons were visualized on an agarose gel. Double bands represent long and short amplicons derived from unprocessed and processed transcripts, respectively, due to an intronic sequence downstream of the pSV40 promoter in the pRUF vector backbone. All amplicons showed the expected sizes, confirming the transcription of a single “bicistronic” RNA for each construct. PCR2 further confirmed a single full-length transcript of ∼2, 2.4, and 2.3 kb for the NO IRES, c-myc IRES, and inv-dirSINEB2 constructs, respectively, demonstrating the absence of splicing events mediated by the inv/dirSINEB2-spacer sequences. (E) IRES activity (IVT mRNA). Bicistronic mRNAs were in vitro transcribed and transfected into HEK293T cells. NO IRES and c-myc IRES were used as negative and positive controls, respectively. Luciferase activity was measured 6 h post-transfection. IRES activity was represented as the Fluc/Rluc activity ratio and calculated relative to the negative control (NO IRES). Data show that the invSINEB2 element induced Fluc protein translation in cis. Plots represent the IRES activity (mean ± SD) from independent biological replicates (n = 4) performed in duplicate. Statistical significance was determined using ordinary one-way ANOVA with Holm–Sidak's multiple comparisons test. *P < 0.05, **P < 0.01, ***P < 0.001, and ****P < 0.0001. Comparisons were made against the control condition unless otherwise specified. (F) Schematic representation of circRNA reporter vectors. The pCDNA3.1(+) ZKSCAN1 MCS-WT Split GFP + SENSE vector consists of two complementary introns flanking two GFP exon fragments (in reversed order). The MCS is placed between the two reversed GFP exon fragments, allowing the evaluation of whether a sequence of interest can drive the formation of a circRNA encoding GFP protein upon backsplicing, thereby testing its ability to support cap-independent GFP translation. A circGFP RNA construct containing an IRES in an inverted orientation between the two GFP-coding fragments was used as a negative control. The c-myc IRES (dark gray) and invSINEB2 elements were cloned into the MCS. The c-myc IRES vector served as a positive control for cap-independent protein translation. (G) IRES activity (circGFP RNA). circGFP RNAs were transfected into HEK293T cells. circGFP RNA with an inverted IRES between the two GFP-coding fragments (NO IRES) and circGFP RNA containing the c-myc IRES were used as negative and positive controls, respectively. Fluorescence was measured 48 h post-transfection using a flow cytometer. Data show that the invSINEB2 element induced GFP protein translation in a cap-independent manner. Results are presented as the fluorescence percentage. Plots represent the IRES activity (mean ± SD) from independent biological replicates (n = 5) performed in duplicate. Statistical significance was determined using ordinary one-way ANOVA with Holm–Sidak's multiple comparisons test. *P < 0.05, **P < 0.01, ***P < 0.001, and ****P < 0.0001. Comparisons were made against the control condition unless otherwise specified. (H) RT–qPCR data corresponding to (G). Circular (left) and linear (right) RNA expression was detected via RT–qPCR. Plots represent the fold change in RNA expression levels (mean ± SD) from independent biological replicates (n = 3). Statistical significance was determined using ordinary one-way ANOVA with Holm–Sidak's multiple comparisons test. *P < 0.05, **P < 0.01, ***P < 0.001, and ****P < 0.0001. Comparisons were made against the control condition.
Figure 3.
Figure 3.
Cellular and viral IRESs increase DJ-1 protein synthesis acting as an ED in SINEUP. (A) Schematic representation of sense/antisense (S/AS) pairing of synthetic SINEUPs targeting DJ-1 mRNA. The canonical SINEUP-DJ-1 consists of both the BD of 44 nt (–40/+4 relative to the DJ-1 start codon, light brown) and the inverted SINEB2 (invSINEB2) element as the ED (light gray). SINEUP(c-myc IRES)-DJ-1, which retains the same BD, is designed to evaluate the potential of the c-myc IRES sequence as an alternative ED (light blue). (B) Synthetic SINEUP(c-myc IRES)-DJ-1 activity. Constructs were transiently transfected into HEK293T cells and analyzed as described in the Materials and methods. SINEUP activity was assessed 48 h post-transfection and compared with the empty pCS2+ vector (CTRL). Whole-cell lysates were analyzed by western blotting using anti-DJ-1 and anti-β-ACTIN antibodies. Representative western blot images are shown. Both SINEUP-DJ-1- and SINEUP(c-myc IRES)-DJ-1-transfected cells showed increased levels of endogenous DJ-1 protein (left panel). Plots represent the fold change in protein expression levels (mean ± SD) from independent biological replicates (n = 4). DJ-1 mRNA expression was assessed by RT–qPCR (right panel). Statistical significance was determined using ordinary one-way ANOVA with Holm–Sidak's multiple comparisons test. *P < 0.05, **P < 0.01, ***P < 0.001, and ****P < 0.0001. Comparisons were made against the control condition unless otherwise specified. (C) SINEUP RNA enrichment. Total lysates were fractionated on sucrose gradients. The relative distribution (%) of SINEUP-DJ-1 and SINEUP(c-myc IRES)-DJ-1 RNAs was analyzed by RT–qPCR across 15 gradient fractions. Data show an enrichment of SINEUP RNA in the 40S fraction. RNA distributions are presented as mean ± SD from independent biological replicates (n = 3). Statistical significance was determined using ordinary one-way ANOVA with Holm–Sidak's multiple comparisons test. *P < 0.05, **P < 0.01, ***P < 0.001, and ****P < 0.0001. (D) c-myc IRES enrichment. Total lysates were fractionated on sucrose gradients. The relative distribution (%) of c-myc IRES RNA was analyzed by RT–qPCR across 15 gradient fractions in the presence of either SINEUP(c-myc IRES)-DJ-1 or SINEUP-DJ-1. RNA distributions are presented as the mean ± SD from independent biological replicates (n = 3). Statistical significance was determined using ordinary one-way ANOVA with Holm–Sidak's multiple comparisons test. *P < 0.05, **P < 0.01, ***P < 0.001, and ****P < 0.0001. (E) Viral and cellular IRESs. The table shows the tested IRES types used in the experiment. The corresponding size (bp) and reference number (IRESite ID) are also provided. (F) Synthetic viral and cellular SINEUP(IRES)-DJ-1 activity. SINEUP(IRES)-DJ-1 constructs, which retain the same BD as SINEUP-DJ-1, are designed to evaluate the potential IRES activities of both viral (light gray) and cellular (dark gray) sequences as alternative EDs. Constructs were transiently transfected into HEK293T cells and analyzed as described in the Materials and methods. SINEUP activity was assessed 48 h post-transfection and compared with the empty pCS2+ vector (CTRL). Whole-cell lysates were analyzed by western blotting using anti-DJ-1 and anti-β-ACTIN antibodies. All SINEUP(IRES)-DJ-1-transfected cells showed a statistically significant increase in endogenous DJ-1 protein levels. Plots represent the fold change in protein expression levels (mean ± SD) from independent biological replicates (n = 4). Statistical significance was determined using ordinary one-way ANOVA with Holm–Sidak's multiple comparisons test. *P < 0.05, **P < 0.01, ***P < 0.001, and ****P < 0.0001. Comparisons were made against the control condition unless otherwise specified. (G) Synthetic EMCV and HCV SINEUP(IRES) activity (in vitro transcribed mRNA). SINEUP(IRES)-DJ-1 RNAs were in vitro transcribed and transfected into HEK293T cells. A scrambled sequence (CTRL) was used as a negative control. SINEUP activity was measured 24 h post-transfection. Whole-cell lysates were analyzed by western blotting using anti-DJ-1 and anti-β-ACTIN antibodies. Both SINEUP(EMCV IRES)-DJ-1 and SINEUP(c-myc IRES)-DJ-1in vitro transcribed-transfected cells showed a statistically significant increase in endogenous DJ-1 protein levels (left panel) with the same amounts of transfected RNAs (right panel). Plots represent the fold change in protein expression levels (mean ± SD) from independent biological replicates (n = 5). Statistical significance was determined using ordinary one-way ANOVA with Holm–Sidak's multiple comparisons test. *P < 0.05, **P < 0.01, ***P < 0.001, and ****P < 0.0001. Comparisons were made against the control condition unless otherwise specified.
Figure 4.
Figure 4.
Functional analysis of SINEUP(EMCV IRES)-DJ-1 and SINEUP(HCV IRES)-DJ-1 mutants. (A) EMCV secondary structure. Schematic representation of the secondary structure of the EMCV IRES. The key domains are highlighted: H-domain (orange) and I-domain (purple). The SINEUP(ΔEMCV IRES)-DJ-1 mutant was generated by introducing specific deletions within the EMCV IRES sequence, as detailed in the accompanying table. (B) Validation of SINEUP(EMCV IRES)-DJ-1 activity. HEK293T cells were transiently transfected with SINEUP(EMCV IRES)-DJ-1 or its deletion mutant [SINEUP(ΔEMCV IRES)-DJ-1] and analyzed as described in the Materials and methods. SINEUP activity was assessed 48 h post-transfection and compared with the empty pCS2+ vector (CTRL). Western blot analysis of whole-cell lysates using anti-DJ-1 and anti-β-ACTIN antibodies showed that SINEUP(EMCV IRES)-DJ-1 significantly increased DJ-1 protein levels, whereas the deletion mutant exhibited no activity. Representative western blot images are shown. Plots represent the fold change in protein expression levels (mean ± SD) from independent biological replicates (n = 4). Statistical significance was determined using ordinary one-way ANOVA with Holm–Sidak's multiple comparisons test. *P < 0.05, **P < 0.01, ***P < 0.001, and ****P < 0.0001. Comparisons were made against the control condition unless otherwise specified. (C) HCV IRES secondary structure. Schematic representation of the secondary structure of the HCV IRES, with key domains highlighted: IIIc domain (light blue) and IIId domain (light green). Mutated regions are numbered and listed in the accompanying table. SINEUP(HCV IRES)-DJ-1 mutants were generated by replacing the wild-type HCV IRES sequence with these mutated variants. The domain numbers indicate the localization of the modified regions within the HCV secondary structure. (D) Validation of SINEUP(HCV IRES)-DJ-1 activity. HEK293T cells were transiently transfected with bothSINEUP(HCV IRES)-DJ-1 IIIc (light gray) and SINEUP(HCV IRES)-DJ-1 IIId (dark gray) mutants. Data were analyzed as described in the Materials and methods. SINEUP activity was assessed 48 h post-transfection and compared with the empty pCS2+ vector (CTRL). SINEUP-DJ-1 served as a positive control. Western blot analysis of whole-cell lysates using anti-DJ-1 and anti-β-ACTIN antibodies showed that all mutants exhibited reduced activity compared with the positive control. Representative western blot images are shown. Plots represent the fold change in protein expression levels (mean ± SD) from independent biological replicates (n = 4). Statistical significance was determined using ordinary one-way ANOVA with Holm–Sidak's multiple comparisons test. *P < 0.05, **P < 0.01, ***P < 0.001, and ****P < 0.0001. Comparisons were made against the control condition unless otherwise specified.
Figure 5.
Figure 5.
Circularized SINEUP(IRES) RNA maintains its activity in trans. (A) Schematic representation of circularized SINEUP(IRES) RNA [circ(c-myc IRES)-GFP]. The synthetic miniSINEUP-GFP was designed to specifically target EGFP mRNA (target mRNA, green). Its BD (light green) consists of 72 nt and is positioned at –40/+32 relative to the start codon. The ED comprises only the invSINEB2 sequence. To generate miniSINEUP(c-myc IRES)-GFP, the c-myc IRES element replaced the invSINEB2 sequence while retaining the BD. Finally, circ(c-myc IRES)-GFP was constructed by inserting the complete miniSINEUP(c-myc IRES)-GFP sequence into the pcDNA3.1(+) ZKSCAN MCS Exon Vector to enable circularization. (B) Synthetic circ(c-myc IRES)-GFP activity. An EGFP-expressing vector was transiently co-transfected with the constructs of interest at a 6:1 ratio into HEK293T cells and analyzed as described in the Materials and methods. SINEUP activity was assessed 48 h post-transfection and compared with the empty pcDNA3.1(+) vector (CTRL). Relative fluorescence units (RFU) were measured and normalized to the negative control [CTRL, pcDNA3.1(+) vector]. miniSINEUP-GFP and miniSINEUP(c-myc IRES)-GFP served as positive controls to assess the SINEUP activity of circ(c-myc IRES)-GFP. The analysis demonstrated that circ(c-myc IRES)-GFP increased GFP protein levels more than its linear counterpart (left panel). Plots represent the fold change in protein expression levels (mean ± SD) from independent biological replicates (n = 4). GFP mRNA expression was assessed by RT–qPCR (right panel). (C) As transfection controls, expression levels of invSINEB2 and c-myc IRES RNAs were also evaluated via RT–qPCR. To detect circularization of circ(c-myc IRES)-GFP, divergent primers were designed spanning the back-splice junction, while convergent primers were used as controls for the linear miniSINEUP(c-myc IRES)-GFP. Data are presented as the mean ± SD from independent biological replicates (n = 3). Statistical significance was determined using ordinary one-way ANOVA with Holm–Sidak's multiple comparisons test. *P < 0.05, **P < 0.01, ***P < 0.001, and ****P < 0.0001. Comparisons were made against the control condition unless otherwise specified.
Figure 6.
Figure 6.
circMyc is an IRES-containing circRNA transcribed from the c-myc locus and it affects the cellular proteome upon overexpression. (A) Schematic representation of putative circMyc domains. This circRNA comprises the IRES sequence (gray) along with an upstream region, here represented as a putative mono- or multi-BD (light purple) specific to one or more endogenous target mRNAs (the 5′ UTR, CDS, and 3′ UTR are shown in the above scheme). (B) circMyc increases the levels of the target proteins. Both pcDNA3.1(+)-ZKSCAN-circMyc (circMyc) and pcDNA3.1(+)-ZKSCAN (CTRL, negative control) vectors were transiently transfected into HEK293T cells. Protein extracts were then analyzed by mass spectrometry, assuming that the majority of proteins exhibited no significant changes in expression, with only a smaller subset showing alterations (MLR method). The volcano plot illustrates protein expression levels following circMyc overexpression. The x-axis represents the log2 fold change (FC), which indicates the log2 ratio of mean protein expression levels between the treated and control samples. The y-axis displays the –log10 P-values. Proteins with logFC ≤ 0 are considered down-regulated, while those with logFC ≥ 0 are up-regulated. Proteins with an FC ≥ 1.5, which were validated by western blotting, are shown as red dots. A P-value of < 0.05 was considered statistically significant. (C) circMyc increases endogenous PXK protein levels. Both circMyc and CTRL vectors were transiently transfected into HEK293T cells. PXK FC was assessed 48 h post-transfection, and the whole-cell lysates were analyzed by western blotting using anti-PXK and anti-β-ACTIN antibodies. Representative western blot images are shown. circMyc-transfected cells showed increased levels of endogenous PXK protein, when compared with CTRL. Plots represent the FC in protein expression levels (mean ± SD) from independent biological replicates (n = 9). Statistical significance was determined using one-sample t-test. *P < 0.05, **P < 0.01, ***P < 0.001, and ****P < 0.0001. Comparisons were made against the control condition unless otherwise specified. (D) Polysome fractionation profile. Total lysates were fractionated on sucrose gradients. The relative distributions (%) of PXK mRNA, circMyc RNA, and PXK mRNA + circMyc RNA were analyzed by RT–qPCR in each of the 13 gradient fractions. RNA distributions are presented as the mean ± SD from independent biological replicates (n = 3). Statistical significance was determined using ordinary one-way ANOVA with Holm–Sidak's multiple comparisons test. *P < 0.05, **P < 0.01, ***P < 0.001, and ****P < 0.0001. (E) circMyc RNA pull-down (RPD). circMyc was purified using a biotinylated RNA probe of ∼ 20 nt. As a negative control, RPD was performed in the absence of probes (data not shown). RT–qPCR results indicate the enrichment of circMyc and PXK mRNA following circMyc RPD. Plots represent the percentage of enrichment (%) over the input (mean ± SD) from independent biological replicates (n = 6). Statistical significance was determined using unpaired t-test. *P < 0.05, **P < 0.01, ***P < 0.001, and ****P < 0.0001. Comparisons were made against the control condition unless otherwise specified.
Figure 7.
Figure 7.
circMyc increases PXK protein expression through the activity of two BDs. (A) Schematic representation of both PXK mRNA and circMyc predicted features. The diagram illustrates PXK mRNA, including its 5′ UTR, CDS (gray), and 3′ UTR, along with circMyc. Predicted antisense sequence pairing between PXK mRNA (TS) and circMyc (BD). BDs were identified based on a minimum perfect match of 8 nt. BD1 is predicted to target PXK mRNA at three distinct regions within the 5′ UTR (TS1, TS2, and TS3; orange), while BD2 may pair with two regions in the 3′ UTR (TS4 and TS5; blue). (B) circMyc increases PXK-FLAG protein levels. An PXK-FLAG-expressing vector was transiently co-transfected with both the negative control [CTRL, pcDNA3.1(+)-Laccase2 vector] or circMyc at a 12:1 ratio into HEK293T cells. The experiment was performed as described in the Materials and methods. SINEUP activity was assessed 48 h post-transfection and compared with the CTRL. Whole-cell lysates were analyzed by western blotting using anti-FLAG and anti-β-ACTIN antibodies. Representative western blot images are shown. circMyc-transfected cells exhibited increased levels of PXK-FLAG protein. Plots represent the fold change in protein expression levels (mean ± SD) from independent biological replicates (n = 12). Statistical significance was determined using one-sample t-test. *P < 0.05, **P < 0.01, ***P < 0.001, and ****P < 0.0001. Comparisons were made against the control condition unless otherwise specified. (C) circMyc activity on PXK-FLAG mutants. PXK-FLAG mutants were generated, individually deleting the identified TSs from PXK-flag (ΔTS1, ΔTS2, ΔTS3, ΔTS4, and ΔTS5). Mutant constructs were transiently co-transfected with circMyc or the negative control [CTRL, pcDNA3.1(+)-Laccase2 vector] at a 12:1 ratio into HEK293T cells and analyzed as described in the Materials and methods. PXK-FLAG co-transfected with circMyc was used as a positive control. SINEUP activity was assessed 48 h post-transfection and compared with CTRL. Whole-cell lysates were analyzed by western blotting using anti-FLAG and anti-β-ACTIN antibodies. Representative western blot images are shown. Deletion of TS1 from the PXK 5′ UTR or TS4 from the PXK 3′ UTR abolished the circMyc-mediated increase in PXK-FLAG protein levels. Plots represent the fold change in protein expression levels (mean ± SD) from independent biological replicates (n ≥ 5). Statistical significance was determined using one-sample t-test. *P < 0.05, **P < 0.01, ***P < 0.001, and ****P < 0.0001. Comparisons were made against the control condition unless otherwise specified. (D) Validation of TS1 and TS4 function. Three additional PXK-FLAG mutants were generated by individually replacing the 5′ UTR and/or 3′ UTR with only the TS of interest (TS1–PXK-FLAG, PXK-FLAG–TS4, and TS1-PXK-FLAG–TS4). These mutant constructs were transiently co-transfected with either circMyc or the negative control [CTRL, pcDNA3.1(+)-Laccase2 vector] at a 12:1 ratio into HEK293T cells and analyzed as described in the Materials and methods. PXK-FLAG co-transfected with circMyc was used as a positive control. SINEUP activity was assessed 48 h post-transfection and compared with CTRL. Whole-cell lysates were analyzed by western blotting using anti-FLAG and anti-β-ACTIN antibodies. Representative western blot images are shown. All PXK-FLAG mutant-transfected cells exhibited a significant increase in PXK-FLAG protein levels. These findings demonstrate that both TS1 and TS4 are individually sufficient to mediate circMyc-induced up-regulation of PXK-FLAG protein, although with different levels of efficiency. Plots represent the fold change in protein expression levels (mean ± SD) from independent biological replicates (n = 4). Statistical significance was determined using one-sample t-test. *P < 0.05, **P < 0.01, ***P < 0.001, and ****P < 0.0001. Comparisons were made against the control condition unless otherwise specified. (E) Schematic representation of circMyc–PXK mRNA pairing. The diagram depicts the predicted base-pairing interactions between circMyc and PXK mRNA, highlighting the actual pairing sites. TS1 interacts with BD1 (orange), while TS4 pairs with BD2 (blue). These interactions represent the molecular basis of circMyc-mediated regulation of PXK mRNA translation.

Similar articles

References

    1. Li G-W, Burkhardt D, Gross C et al. Quantifying absolute protein synthesis rates reveals principles underlying allocation of cellular resources. Cell. 2014; 157:624–35. 10.1016/j.cell.2014.02.033. - DOI - PMC - PubMed
    1. Sonenberg N, Hinnebusch AG Regulation of translation initiation in eukaryotes: mechanisms and biological targets. Cell. 2009; 136:731–45. 10.1016/j.cell.2009.01.042. - DOI - PMC - PubMed
    1. Jackson RJ, Hellen CUT, Pestova TV The mechanism of eukaryotic translation initiation and principles of its regulation. Nat Rev Mol Cell Biol. 2010; 11:113–27. 10.1038/nrm2838. - DOI - PMC - PubMed
    1. Pavitt GD Regulation of translation initiation factor eIF2B at the hub of the integrated stress response. WIREs RNA. 2018; 9::e1491. 10.1002/wrna.1491. - DOI - PubMed
    1. Spriggs KA, Bushell M, Willis AE Translational regulation of gene expression during conditions of cell stress. Mol Cell. 2010; 40:228–37. 10.1016/j.molcel.2010.09.028. - DOI - PubMed