. 2025 Dec;17(1):2545434.
doi: 10.1080/19490976.2025.2545434. Epub 2025 Aug 18.

Gut microbiota-mediated betaine regulates skeletal muscle fiber type transition by affecting m6A RNA methylation and Myh7 expression

Affiliations

Gut microbiota-mediated betaine regulates skeletal muscle fiber type transition by affecting m6A RNA methylation and Myh7 expression

Chao Yan et al. Gut Microbes. 2025 Dec.

Abstract

Skeletal muscle fiber composition is essential for maintaining muscle function and overall health. Growing evidence underscores the pivotal role of the gut-muscle axis in mediating the influence of gut microbiota on skeletal muscle development. However, the mechanisms underlying microbiota-mediated regulation of skeletal muscle fiber type remain unclear. Here, we employed multi-omics approaches, including RNA-seq, MeRIP-seq, 16S rRNA gene sequencing, and metabolomics, to investigate the causal relationship between the gut microbiota and skeletal muscle fiber transition. Our results demonstrate that the gut microbiota modulates skeletal muscle fiber transition by influencing N6-methyladenosine (m6A) methylation to regulate the expression of the slow-twitch fiber marker Myh7. Specifically, METTL3-dependent m6A methylation enhances Myh7 gene expression, leading to an increased proportion of slow-twitch fibers and a reduction in fast-twitch fibers. Furthermore, the microbiota-derived methyl donor betaine promotes Myh7 expression and Akkermansia muciniphila (AKK) abundance, and facilitates fast-to-slow fiber conversion via m6A modification. The transplantation of AKK significantly altered betaine levels and m6A modification, thereby promoting muscle fiber remodeling. In conclusion, these findings reveal that AKK-coordinated betaine drives skeletal muscle fiber conversion by modulating Myh7 mRNA expression. This study provides novel insights into the role of m6A RNA methylation in the gut-muscle crosstalk, highlighting potential therapeutic targets for muscle-related disorders.

Keywords: Betaine; Myh7; gut microbiota; m6A RNA methylation; myofiber-type transition.


Conflict of interest statement

No potential conflict of interest was reported by the author(s).

Figures
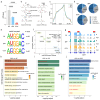
Figure 1.
Figure 1.
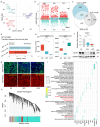
Gut microbiota regulates m6A RNA modification in skeletal muscle. (a) Quantification of the global m6A levels in GAS muscles from GF, SPF, and COV mice using ELISA (n = 3/group). (b) Schematic diagram of the MeRIP-seq workflow. (c) Density distribution of m6A peaks across transcript regions (including 5′-untranslated region (UTR), start codon, coding sequence (CDS), stop codon, and 3′-UTR) in GF, SPF, and COV mice (n = 3/group). (d) Genomic annotation of m6A peaks by transcript region (5‘-UTR, 1st exon, other exon, and 3‘-UTR) using ChIPseeker. (e) De novo motif analysis of m6A-enriched regions identified by HOMER. (f) Four-quadrant plot shows the distribution of genes with significant changes in both the RNA expression (|log2 FC| > 1 and FDR < 0.05) and m6A methylation (|log2 FC| > 1 and p-value < 0.05) levels, respectively. (g) IGV browser tracks views of the Myh7 m6A peak (IP vs. Input) in GAS muscles from GF, SPF, and COV mice. (h-j) GO analysis of transcripts with differential m6A peaks. “mRNA processing” enriched in the SPF (h) and COV (i) compared to the GF groups, “muscle system process” and “muscle contraction” enriched in the COV compared to the SPF groups (j). Data are presented as the mean ± SEM. ****p < 0.0001, was calculated by two-sided Student’s t-test for two groups comparisons and by one-way ANOVA for three groups comparisons.
Figure 2.
Figure 2.
Myh7 regulates skeletal muscle fiber transition in a gut microbiota manner. (a) PCA of transcriptomic profiles in GAS muscles among GF, SPF, and COV groups. (b) Volcano plots depicting DEGs in the GAS muscles among GF, SPF, and COV mice (|log2 FC| > 1, and FDR < 0.05). (c) Venn diagram showing the overlap of DEGs among the three pairwise comparisons. (d) GO enrichment analysis highlighting significant enrichment of DEGs in the biological process “transition between fast and slow fiber”. Myh7 was the only gene consistently enriched across all comparisons. (e) Transcript quantification of per kilobase million (TPM) of Myh7 and Myh4 in GAS muscles. (f) RT-qPCR (top) and Western blot (bottom) analysis showing the Myh7 mRNA and protein levels in GF, SPF, and COV mice. (g) Immunofluorescence staining of GAS muscle cross-sections for MYH7-positive (top) and MYH4-positive (bottom) fiber types. Scale bar: 20 μm. (h) WGCNA for gene clustering and module identification. (i) GO enrichment analysis of gene modules, with the green module enriched in the “transition between fast and slow fiber” pathway. Data are presented as the mean ± SEM. **p < 0.01, ***p < 0.001, ns indicates no significance, which was calculated by two-sided Student’s t-test for two groups comparisons and by one-way ANOVA for three groups comparisons.
Figure 3.
Figure 3.
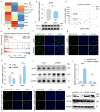
Mettl3 mediates muscle slow fiber transition by regulating Myh7 expression relying on gut microbiota. (a) Heatmap of RNA-seq profiles for core m6A methyltransferases in GAS muscles (n = 6/group). (b, c) RT-qPCR (b) and Western blot (c) analysis confirmed Mettl3 mRNA and protein expression levels in SPF and COV groups (n = 3 per group). (d) Pearson correlation between Mettl3 expression and the expression of Myh7 and Myh4. (e) Single-gene GSEA of Mettl3 in the RNA-seq of SPF and COV mice, showing positive enrichment of “transition between fast and slow fiber”. (f, g) Immunofluorescence assay of MYH7-positive (f) and MYH4-positive (g) fibers by Mettl3 knockdown in the C2C12 myoblasts. Scale bar: 50 μm. (h, i) RT-qPCR (h) and Western blot (i) analysis of Myh7 and Myh4 mRNA and protein expression in the Mettl3 knockdown and control groups. (j, k) Overexpression of Mettl3 in the C2C12 myoblasts results in increased MYH7-positive fiber type (j) and decreased MYH4-positive fiber type (k), as assessed by immunofluorescence assay. Scale bar: 50 μm. (l, m) RT-qPCR (l) and Western blot (m) analysis of Myh7 and Myh4 mRNA and protein expressions in the pcDNA3.1-Mettl3 and control (pcDNA3.1-NC) groups. Data are presented as the mean ± SEM. *p < 0.05, **p < 0.01, ***p < 0.001, ****p < 0.0001, were calculated by two-sided Student’s t-test for two groups comparisons and by one-way ANOVA for three groups comparisons.
Figure 4.
Figure 4.
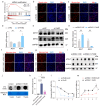
Ythdf2 regulates Myh7 expression during myofiber type transition in an m6A-dependent manner. (a) Single-gene GSEA of Ythdf2 showing “mRNA modification” enrichment in GAS muscles from SPF and COV mice. (b, c) Immunofluorescence assay of MYH7-positive (b) and MYH4-positive (c) fiber types following Ythdf2 knockdown in C2C12 differentiated myoblasts. Scale bar: 50 μm. (d, e) RT-qPCR (d) and Western blot (e) analysis of Myh7 and Myh4 mRNA and protein expressions in Ythdf2 knockdown. (f, g) Immunofluorescence assay of MYH7-positive (f) and MYH4-positive (g) fiber types following Ythdf2 overexpression in C2C12 myoblasts. Scale bar: 50 μm. (h-i) RT-qPCR (h) and Western blot (i) analysis of Myh7 and Myh4 mRNA and protein expression in Ythdf2 overexpression and control groups. (j) Dot blot assay demonstrating that Ythdf2 overexpression increased global m6A levels at two concentrations (5 and 10 µg/μL), with methylene blue staining as a loading control. (k) Dual-luciferase reporter assay confirming Ythdf2 binding to Myh7 mRNA. (l, m) RT-qPCR-based mRNA decay analysis of Myh7 stability in the C2C12 cells transfected with si-Ythdf2 and si-NC (l) and pcDNA3.1-Ythdf2 and pcDNA3.1-NC (m), followed by ActD treatment (5 µg/mL) at indicated time points. Data are presented as the mean ± SEM. *p < 0.05, **p < 0.01, ***p < 0.001, ****p < 0.0001, which was calculated by two-sided Student’s t-test for two groups comparisons and by one-way ANOVA for three groups comparisons.
Figure 5.
Figure 5.
Microbiota-derived betaine is a promising metabolite modulating skeletal muscle fiber remodeling. (a-c) PCA of metabolite contents by LC-MS/MS in colonic contents (a), serum (b), and GAS muscles (c) from GF, SPF, COV mice, and quality control (QC) samples (n = 6/group for the colon and serum, n = 6, 6, 4 for the GAS muscles). (d) Volcano plots displaying DEMs in colonic contents (left), serum (medium), and GAS muscles (right) among GF, SPF, and COV mice (VIP scores > 1 and p < 0.05). (e-g) Venn plots illustrating overlapped DEMs among the GF, SPF, and COV mice in the colonic contents (e), serum (f), and GAS muscles (g). (h-j) Heatmaps display the DEMs enriched in KEGG “metabolic pathway” of colonic contents in comparisons between SPF and GF mice (h), COV and GF mice (i), and COV and SPF mice (j). (k) Box plot showing the levels of betaine were significantly different in the colonic contents among the GF, SPF, and COV mice, in which displays median (center line), 75th (upper limit of box) and 25th percentiles (lower limit of box) and outliers (whiskers) if values do not exceed 1.5 × interquartile range. *p < 0.05, ns indicates no significance, by two-sided Student’s t-test for two groups comparisons and by one-way ANOVA for three groups comparisons.
Figure 6.
Figure 6.
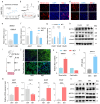
Betaine supplementation contributes to skeletal muscle fiber conversion via m6A RNA methylation. (a) Spearman correlation between betaine concentration and Mettl3 expression. (b) Schematic diagram of betaine treatment in differentiated C2C12 myoblasts. (c,d) Immunofluorescence assay of MYH7-positive (c) and MYH4-positive fiber types (d) following betaine treatment. Scale bar: 50 μm. (e-g) RT-qPCR analysis of Mettl3 (e), Myh7, and Myh4 (f), Ythdf1, Ythdf2, Ythdf3 (g) mRNA expression after betaine stimulation. (h) Western blot of METTL3, MYH7, MYH4, and YTHDF2 protein levels with GAPDH as the loading control in betaine-treated cells. (i) Scheme of betaine treatment in vivo (n = 10/group). (j) Immunofluorescence assay of GAS muscle cross-sections for MYH7-positive (top) and MYH4-positive (bottom) fiber types in vehicle (VEH), and betaine (BET) mice. Scale bar: 20 μm. (k) Quantification of the number of muscle fiber types in the VEH and BET groups. (l) Global m6A levels in GAS muscles from the VEH, and BET mice. (m) RT-qPCR analysis of Myh7, Myh4, Mettl3, and Ythdf2 mRNA expression in GAS muscles. (n) Western blot of MYH7, MYH4, METTL3, and YTHDF2 protein expression in GAS muscles upon in vivo betaine treatment; GAPDH used as internal control. Data are presented as the mean ± SEM. *p < 0.05, **p < 0.01, ***p < 0.001, ****p < 0.0001, ns indicates no significance, which was calculated by two-sided Student’s t-test for two groups comparisons and by one-way ANOVA for three groups comparisons.
Figure 7.
Figure 7.
AKK orchestrating betaine modulates skeletal muscle fiber characteristics via m6A RNA methylation. (a) Relative abundance of the top 10 bacterial genera in colonic contents between the SPF and COV groups. (b) PCA of gut microbiota profiles based on 16S rRNA gene sequencing in VEH and BET mice (n = 6/group). (c) Genus-level comparison of the top 10 microbial taxa between VEH and BET groups (n = 6/group). (d) Schematic of AKK transplantation in mice compared to the control (PBS) group in vivo. (e) Relative abundance of AKK in the AKK- and PBS-treated mice as assessed by RT-qPCR. (f) Immunofluorescence images showing increased MYH7-positive fiber-type and decreased MYH4-positive fiber-type in AKK-treated mice. Scale bar: 10 μm. (g) Global m6A levels in GAS muscles of the AKK-treated versus PBS-treated group. (h-j) RT-qPCR (h, i) and (j) Western blot analyses demonstrating increased expression of Myh7, Mettl3, and Ythdf2 and decreased Myh4 expression in the AKK group. (k) RDA revealed that AKK and lactobacillus were positively and negatively associated, respectively, with DEMs in “metabolic pathways” between COV and SPF mice. (l) Box plots showing increased betaine levels in the colonic contents between AKK-treated mice compared to PBS-treated controls, in which displays median (center line), 75th (upper limit of box) and 25th percentiles (lower limit of box) and outliers (whiskers) if values do not exceed 1.5 × interquartile range. Data are presented as the mean ± SEM. *p < 0.05, **p < 0.01, ***p < 0.001, ****p < 0.0001, ns indicates no significance, was calculated by two-sided Student’s t-test for two groups comparisons and by one-way ANOVA for three groups comparisons.
Figure 8.
Figure 8.
The mechanism of gut microbiota orchestrating betaine regulates skeletal muscle fiber via m6A RNA methylation and Myh7 expression in the gut-muscle axis (created with BioRender.com).

References

    1. Frontera WR, Ochala J.. Skeletal muscle: a brief review of structure and function. Calcif Tissue Int. 2015;96(3):183–25. doi: 10.1007/s00223-014-9915-y. - DOI - PubMed
    1. Schiaffino S, Reggiani C. Fiber types in mammalian skeletal muscles. Physiol Rev. 2011;91(4):1447–1531. doi: 10.1152/physrev.00031.2010. - DOI - PubMed
    1. Li JL, Zhang S, Li C, Zhang XX, Shan YH, Zhang ZY, Bo H, Zhang Y. Endurance exercise-induced histone methylation modification involved in skeletal muscle fiber type transition and mitochondrial biogenesis. Sci Rep. 2024;14(1):1–12. doi: 10.1038/s41598-024-72088-6. - DOI - PMC - PubMed
    1. Schiaffino S. Muscle fiber type diversity revealed by anti-myosin heavy chain antibodies. FEBS J. 2018;285(20):3688–3694. doi: 10.1111/febs.14502. - DOI - PubMed
    1. Wang T, Xu YQ, Yuan YX, Xu PW, Zhang C, Li F, Wang LN, Yin C, Zhang L, Cai XC, et al. Succinate induces skeletal muscle fiber remodeling via SUNCR1 signaling. EMBO Rep. 2019;20(9):e47892. doi: 10.15252/embr.201947892. - DOI - PMC - PubMed

LinkOut - more resources