. 2025 Aug 15;9(9):e0778.
doi: 10.1097/HC9.0000000000000778. eCollection 2025 Sep 1.

Secreted lumican from the tumor microenvironment potentiates HCC stemness and progression

Affiliations

Secreted lumican from the tumor microenvironment potentiates HCC stemness and progression

Kristy Kwan-Shuen Chan et al. Hepatol Commun. .

Abstract

Background: Extracellular matrix proteins are tightly linked to cancer progression. HCC frequently arises from chronic liver diseases with varying degrees of parenchymal fibrosis. Herein, we aimed to investigate the roles of secreted lumican, an extracellular matrix proteoglycan, in HCC.

Methods: Lumican expression in clinical liver tissue samples was analyzed. In vitro and in vivo functional assays were performed with cell lines. Co-culture systems were adopted to examine the roles of lumican in the interaction between HCC cells and liver fibroblasts. Downstream mechanisms were interrogated by transcriptomic and proteomic profiling.

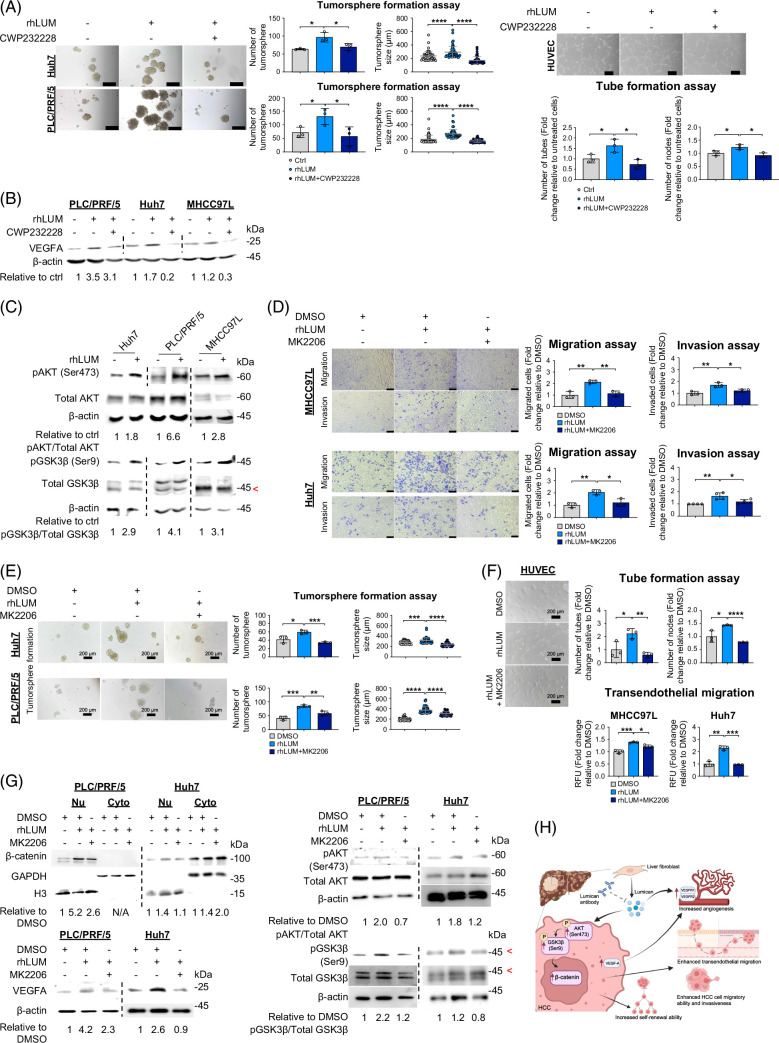
Results: Analyses of single-cell RNA-sequencing datasets collectively revealed high lumican expression in liver fibroblasts. Lumican expression was elevated in liver tissues with advanced fibrosis, and a higher lumican level in the non-tumor liver tissue was a poor prognosticator of HCC. Functionally, recombinant human lumican (rhLUM) promoted migration, invasion, and self-renewal of HCC cells, and enhanced angiogenesis in vitro. These effects were abrogated by anti-lumican antibody. The paracrine actions of lumican in the interplay between HCC cells and liver fibroblasts were supported with co-culture models, in which lumican was manipulated by genetic or antibody approaches. In vivo, recombinant lumican promoted neovascularization and tumor incidence. Profiling results revealed the enrichment of Wnt signaling, and mechanistic dissection uncovered the crosstalk between PI3K/AKT and Wnt/β-catenin pathways in rhLUM-treated HCC cells.

Conclusions: Secreted lumican promotes HCC self-renewal, tumor initiation, and progression by activating the AKT/GSK3β/β-catenin signaling cascade. Targeting secreted lumican is a potential therapeutic strategy for HCC.

Keywords: extracellular matrix proteins; fibroblasts; liver cancer.


Conflict of interest statement

The authors have no conflicts to report.

Figures

FIGURE 1
FIGURE 1
Lumican is highly expressed in liver fibroblasts. (A) UMAP plots of the cell clusters and lumican expression analyzed from integrated normal liver, cirrhotic liver, and HCC tissue datasets using the GepLiver database (http://www.gepliver.org/#/explore). Graph layouts were modified based on the originals, with the cell type annotation underneath the lumican expression UMAP plots. (B) Immunohistochemical staining for lumican in tumor (T) tissue and non-tumor (NT) liver tissue from HCC clinical samples. Scale bar of full-size image: 100 μm. Scale bar of inset: 50 μm. (C) Multiplex fluorescence immunohistochemistry of lumican (LUM), α-smooth muscle actin (αSMA), and vimentin in a clinical HCC sample. LUM (green), αSMA (orange), vimentin (red), and DAPI (blue). Representative cells with colocalization of LUM, αSMA, and vimentin were indicated by the white arrows. Scale bar: 50 μm. (D) Lumican mRNA expression in non-tumor (NT) liver tissue from 65 HCC clinical samples. Samples were categorized based on the status, non-cirrhotic (n=33) versus cirrhotic (n=32), of non-tumor liver tissue. Mann–Whitney U test. The line represents the median with the IQR. (E) Kaplan–Meier analysis of 5-year overall survival in HCC patients (HKU-QMH) stratified by median of lumican (LUM) mRNA expression level in non-tumor liver tissue. LUMlow (n=33) and LUMhigh (n=32) (left). Survival data are available in 65 HCC patients. Kaplan–Meier analysis of 5-year overall survival in HCC patients (TCGA-LIHC) stratified by a median of lumican mRNA expression level in non-tumor liver tissue. LUMlow (n=25) and LUMhigh (n=25) (right). Log-rank test. (F) Lumican mRNA expression in liver tissue collected from corn oil-treated C57BL/6J mice (n=4) and CCl4-treated C57BL/6J mice (n=5) (left). Representative image of H&E and trichrome stain of mouse liver tissue (middle). Scale bar: 250 μm. Immunofluorescent staining for lumican and vimentin in fibrotic liver tissue from the mice (right). Scale bar: 500 μm. Unpaired t test. The line represents mean±SD. (G) Lumican concentration (pg/mL) in conditioned medium collected from immortalized hepatocyte cell line (MIHA), liver fibroblasts (LF), HSC cell line (LX2), and HCC cell lines (n=3). Unpaired t test. The line represents mean±SD. *p<0.05, **p<0.01, ***p<0.001, and ****p<0.0001; n.d., not detectable. Abbreviations: CCl4, carbon tetrachloride; HKU-QMH, The University of Hong Kong—Queen Mary Hospital; LUM, lumican; NT, non-tumor; T, tumor; TCGA-LIHC, The Cancer Genome Atlas Liver Hepatocellular Carcinoma; UMAP, Uniform Manifold Approximation and Projection.
FIGURE 2
FIGURE 2
Fibroblast-derived lumican increases the metastatic potential of HCC cells. (A) Transwell migration and matrigel invasion assays in MHCC97L (upper) and Huh7 (lower) cells upon rhLUM (2 μg/mL) or in combination of rhLUM (2 μg/mL) and anti-LUM antibody (2 μg/mL) treatment (n=3). Unpaired t test. Data represents mean±SD. Scale bar: 200 μm. (B) Transendothelial migration of MHCC97L (n=3) and Huh7 cells treated with rhLUM (2 μg/mL) or in combination of rhLUM and anti-LUM antibody (2 μg/mL). Representative data of Huh7 is shown. The experiment was performed twice, each in triplicate. Unpaired t test. Data represents mean±SD. (C) Schematic diagram of the co-culture system. The figure is created with BioRender.com. (D) Transwell migration, Matrigel invasion assays, and transendothelial migration assays in MHCC97L (upper), Huh7 (lower) cells, or HCC cells co-cultured with siCtrl or siLUM liver fibroblasts (LFs). Representative data is shown for transwell assays. Scale bar: 200 μm. The experiment was performed at least twice, each in triplicate. Unpaired t test. Data represents mean±SD. (E) Transwell migration, Matrigel invasion assays, and transendothelial migration assay in MHCC97L (upper), Huh7 (lower) cells, or HCC cells co-cultured with LF treated with IgG control or anti-LUM antibody (2 μg/mL). Representative data is shown. Scale bar: 200 μm. The experiment was performed twice, each in triplicate. Unpaired t test. Data represents mean±SD. Scale bar: 200 μm. *p<0.05, **p<0.01, and ***p<0.001. Abbreviations: anti-LUM, anti-lumican antibody; rhLUM, recombinant human lumican.
FIGURE 3
FIGURE 3
Secreted lumican enhances angiogenesis. (A) Effect of rhLUM with or without anti-LUM antibody (2 μg/mL) on angiogenesis as determined by tube formation assay with HUVEC (n=3). Scale bar: 200 μm. (B) Tube formation assay in HUVEC co-cultured with siCtrl or siLUM liver fibroblasts (n=3 for siLUM #1). Representative data of siLUM #2 is shown. The experiment was performed twice, each in triplicate. Scale bar: 200 μm. (C) Tube formation assay in HUVEC co-cultured with liver fibroblasts treated with IgG control or anti-LUM antibody (2 μg/mL) (n=4). Scale bar: 200 μm. (D) Effect of recombinant mouse lumican (rmLUM) on angiogenesis as determined by Matrigel plug in vivo assay. Schematic diagram of the Matrigel plug assay (upper left). Image of the Matrigel plugs isolated from the Ctrl and rmLUM treatment group (lower left). Scale bar: 10 mm. Representative immunohistochemical staining of CD31 expression in the Matrigel plug of the Ctrl and rmLUM treatment group (upper right). Scale bar=100 μm. Quantification of the CD31-positive tubular structure in the gel area of the Ctrl and rmLUM treatment group (average of 5 high-power fields/plug; lower right). Unpaired t test. Data represents mean±SD. (E) Effect of anti-mouse lumican antibody (anti-LUM) on rmLUM-induced angiogenesis as determined by Matrigel plug in vivo assay. Schematic diagram of the Matrigel plug assay (upper left). Representative immunohistochemical staining of CD31 expression in the Matrigel plug of the Ctrl, rmLUM treatment, and rmLUM+anti-LUM treatment group (lower left). Scale bar=50 μm. Quantification of the CD31-positive tubular structure in the gel area of the ctrl (n=4), rmLUM treatment (n=4), and rmLUM+anti-LUM treatment (n=5) group (average of 5 high-power fields/plug; lower right). Unpaired t test. Data represents mean±SD. (F) Expression of VEGFA upon rhLUM treatment (2 μg/mL, 48 h) in PLC/PRF/5 cells, Huh7, and MHCC97L cells as determined by western blot. Quantification of fold change of VEGFA band intensity in the rhLUM-treated group against the untreated group was indicated beneath the western blot images. β-actin was used as the loading control. Representative data are shown. The experiment was performed twice. (G) mRNA expression of VEGFR1 and VEGFR2 in HUVEC cells upon rhLUM treatment (2 μg/mL, 48 h). Representative data is shown. The experiment was performed twice, each in triplicate. Unpaired t test. Data represents mean±SD. *p<0.05, **p<0.01, and ***p<0.001. Abbreviations: anti-LUM, anti-lumican antibody; Ctrl, control; rhLUM, recombinant human lumican; rmLUM, recombinant mouse lumican.
FIGURE 4
FIGURE 4
Secreted lumican promotes self-renewal and tumor initiation of HCC. (A) Tumorsphere assays in Huh7 (upper) and PLC/PRF/5 (lower) cells treated with rhLUM (2 μg/mL) or in combination of rhLUM (2 μg/mL) and anti-LUM antibody (2 μg/mL). Representative data is shown. The experiment was performed twice, each in triplicate. Scale bar: 500 μm. (B) Tumorsphere assays in Huh7 (upper) and PLC/PRF/5 (lower) cells co-cultured with liver fibroblasts (LFs), siCtrl, or siLUM cells. Representative data are shown. The experiment was performed twice, each in triplicate. Scale bar: 500 μm for siLUM #1 or 200 μm for siLUM #2. (C) Tumorpshere assays in Huh7 (upper) and PLC/PRF/5 (lower) cells co-cultured with LF treated with IgG control or anti-LUM antibody (2 μg/mL). Representative data is shown. The experiment was performed twice, each in triplicate. Number of tumorsphere: unpaired t test. Tumorsphere size: Mann–Whitney U test. Scale bar: 500 μm. (D) Images of the Huh7 (left), MHCC97L (middle), and PDX1 (right) tumors harvested from the mice treated with or without rhLUM. No HCC tumor was identified in the nodule on the right from the MHCC97L-Ctrl group upon histological examination. Scale bar: 10 mm. Data represents mean±SD. *p<0.05, **p<0.01, ***p<0.001, and ****p<0.0001. Abbreviations: anti-LUM, anti-lumican antibody; Ctrl, control; LFs, liver fibroblasts; rhLUM, recombinant human lumican; siCtrl, negative control siRNA; siLUM, lumican siRNA.
FIGURE 5
FIGURE 5
Transcriptomic and proteomic profiling reveal the enrichment of Wnt signaling in HCC cells treated with recombinant human lumican. (A) Volcano plot of protein-coding genes identified in the subcutaneous MHCC97L tumor harvested from mice treated with recombinant human lumican protein (rhLUM) by RNA-sequencing. Orange dots: upregulated genes (690 genes); green dots: downregulated genes (812 genes); grey dots: non-differentially expressed genes (15,229 genes). A differentially expressed gene is defined as |Log2(FC)|≥1 and FDR<0.05. (B) GO enrichment analysis of terms under response to stimulus enriched in upregulated differentially expressed genes in the rhLUM treatment group using Metascape. (C) Volcano plot of proteins identified in the rhLUM-treated MHCC97L cells by LC–MS/MS (left). Orange dots: upregulated proteins (281 proteins); blue dots: downregulated proteins (157 proteins); grey dots: non-differentially expressed proteins (4318 proteins). Differentially expressed proteins are defined as FC ≥1.2 or FC ≤0.83 and p<0.05. Reactome pathways enriched in upregulated differentially expressed proteins in the rhLUM treatment group using Metascape (right). (D) Western blot analysis of β-catenin expression in nuclear (Nu) and cytoplasmic (Cyto) fractions of MHCC97L, PLC/PRF/5, and Huh7 cells treated with or without rhLUM (2 μg/mL, 48 h), as well as PDX1 tumor tissue harvested from a mouse model treated with or without rhLUM. Pooled samples of all PDX1 tumor lysates from each group were used for western blot. Ctrl: untreated cells. Quantification of fold change of β-catenin band intensity in the rhLUM-treated group against the untreated group was indicated beneath the western blot images. H3 and GAPDH were used as the loading control for the nuclear fraction and cytoplasmic fraction, respectively. Representative data of MHCC97L, PLC/PRF/5, and Huh7 cells are shown. The experiment was performed twice. Abbreviations: Ctrl, control; FC, fold change; FDR, false discovery rate; LC–MS/MS, liquid chromatography–tandem mass spectrometry; rhLUM, recombinant human lumican.
FIGURE 6
FIGURE 6
Secreted lumican triggers crosstalk between the PI3K/AKT and Wnt/β-catenin pathways. (A) Tumorsphere assays in Huh7 (upper) and PLC/PRF/5 (lower) cells treated with or without rhLUM (2 μg/mL) or in combination of rhLUM (2 μg/mL) and CWP232228 (0.5 μM). Representative data is shown. The experiment was performed twice, each in triplicate. Scale bar: 300 μm. Tube formation assay in HUVEC (right) treated with or without rhLUM (2 μg/mL) or in combination of rhLUM (2 μg/mL) and CWP232228 (2 μM). Scale bar: 200 μm. Representative data are shown. The experiment was performed twice, each in triplicate. Unpaired t test. Data represents mean±SD. (B) Western blot analysis of VEGFA expression in PLC/PRF/5, Huh7, and MHCC97L cells treated with rhLUM (2 μg/mL, 48 h) or co-treatment of rhLUM (2 μg/mL, 48 h) and CWP232228 (2 μM, 48 h). Quantification of fold change of VEGFA band intensity in the rhLUM-treated group against the untreated group was indicated beneath the western blot images. β-actin was used as the loading control. Results of the blot with different exposure times were separated by a dashed line. Representative data is shown. The experiment was performed twice. (C) Western blot analysis of pAKT and pGSK3β protein expression in Huh7, PLC/PRF/5, and MHCC97L cells treated with rhLUM (2 μg/mL, 16 h). Quantification of fold change of pAKT and pGSK3 band intensity in the rhLUM-treated group against the untreated group was indicated beneath the western blot images. β-actin was used as the loading control. Results of the blot with different exposure times were separated by a dashed line. The arrow indicated the expected size of the GSK3β. Representative data are shown. The experiment was performed twice. (D) Transwell migration and matrigel invasion assays in MHCC97L (upper) and Huh7 (lower) cells upon rhLUM (2 μg/mL) or in combination of rhLUM (2 μg/mL) and MK2206 (5 μM) treatment. Representative data are shown. The experiment was performed at least twice, each in triplicate. (E) Tumorsphere assays in Huh7 and PLC/PRF/5 cells treated with rhLUM (2 μg/mL) or in combination of rhLUM (2 μg/mL) and MK2206 (5 μM for Huh7; 2 μM for PLC/PRF/5). Representative data is shown. The experiment was performed twice, each in triplicate. Number of tumorsphere: Unpaired t test. Tumorsphere size: Mann–Whitney U test. Scale bar: 200 μm. (F) Effect of rhLUM with or without MK2206 (10 μM) on angiogenesis as determined by tube formation assay with HUVEC (upper). Representative data is shown. Scale bar: 200 μm. The experiment was performed twice, each in triplicate. Transendothelial migration of MHCC97L and Huh7 cells treated with rhLUM (2 μg/mL) or in combination of rhLUM and MK2206 (5 μM) (lower). Representative data are shown. The experiment was performed twice, each in triplicate. Unpaired t test. Data represents mean±SD. (G) Western blot analysis of β-catenin expression in nuclear (Nu) and cytoplasmic (Cyto) fractions of PLC/PRF/5 and Huh7 cells treated with DMSO, rhLUM (2 μg/mL, 48 h), or co-treatment of rhLUM (2 μg/mL, 48 h) and MK2206 (5 μM for Huh7; 2 μM for PLC/PRF/5, 48 h) (upper left). H3 and GAPDH were used as the loading control for the nuclear fraction and cytoplasmic fraction, respectively. Western blot analysis of VEGFA expression in PLC/PRF/5 and Huh7 cells treated with rhLUM (2 μg/mL, 48 h) or co-treatment of rhLUM (2 μg/mL, 48 h) and MK2206 (5 μM for Huh7; 2 μM for PLC/PRF/5, 48 h) (lower left). Western blot analysis of pAKT and pGSK3β protein expression in PLC/PRF/5 and Huh7 cells treated with rhLUM (2 μg/mL, 16 h) or co-treatment of rhLUM (2 μg/mL, 16 h) and MK2206 (5 μM for Huh7; 2 μM for PLC/PRF/5, 16 h) (right). β-actin was used as the loading control. The arrow indicated the expected size of the GSK3β. Quantification of fold change of β-catenin, VEGFA, pAKT, and pGSK3β band intensity in the rhLUM-treated group or co-treatment group against the DMSO group was indicated beneath the western blot images. Representative data are shown. Each blot was separated by a dashed line. The experiment was performed twice. (H) Graphical summary of the study. The image is created with BioRender.com. *p<0.05, **p<0.01, ***p<0.001, and ****p<0.0001. Abbreviation: rhLUM, recombinant human lumican.

Similar articles

References

    1. Wang Q, Fiel MI, Blank S, Luan W, Kadri H, Kim KW, et al. Impact of liver fibrosis on prognosis following liver resection for hepatitis B-associated hepatocellular carcinoma. Br J Cancer. 2013;109:573–581. - PMC - PubMed
    1. Zhang Y, Wang R, Yang X. FIB-4 index serves as a noninvasive prognostic biomarker in patients with hepatocellular carcinoma: A meta-analysis. Medicine (Baltimore). 2018;97:e13696. - PMC - PubMed
    1. Qi M, Chen Y, Zhang GQ, Meng YJ, Zhao FL, Wang J, et al. Clinical significance of preoperative liver stiffness measurements in primary HBV-positive hepatocellular carcinoma. Future Oncol. 2017;13:2799–2810. - PubMed
    1. Baghy K, Tatrai P, Regos E. Proteoglycans in liver cancer. World J Gastroenterol. 2016;22:379–393. - PMC - PubMed
    1. Krishnan A, Li X, Kao WY, Viker K, Butters K, Masuoka H, et al. Lumican, an extracellular matrix proteoglycan, is a novel requisite for hepatic fibrosis. Lab Invest. 2012;92:1712–1725. - PMC - PubMed

LinkOut - more resources