. 2025 Oct 6;224(10):e202411167.
doi: 10.1083/jcb.202411167. Epub 2025 Aug 18.

Multiple golgins are required to support extracellular matrix secretion, modification, and assembly

Affiliations

Multiple golgins are required to support extracellular matrix secretion, modification, and assembly

George Thompson et al. J Cell Biol. .

Abstract

The secretion of extracellular matrix (ECM) proteins is vital to the maintenance of tissue health. One major control point of this process is the Golgi apparatus, whose dysfunction causes numerous connective tissue disorders. We therefore sought to investigate the role of two Golgi organizing proteins, GMAP210 and Golgin-160, in ECM secretion. CRISPR knockout of either protein had distinct impacts on Golgi organization, with Golgin-160 knockout causing Golgi fragmentation and vesicle accumulation, and GMAP210 loss leading to cisternal fragmentation, dilation, and the accumulation of tubulovesicular structures. Both golgins were required for fibrillar collagen organization and glycosaminoglycan synthesis suggesting nonredundant functions in these processes. Furthermore, proteomics analysis revealed both shared and golgin-specific changes in the secretion of ECM proteins. We therefore propose that golgins are collectively required to create the correct physical-chemical space to support efficient ECM protein secretion, modification, and assembly. This is the first time that Golgin-160 has been shown to be required for ECM secretion.


Conflict of interest statement

Disclosures: The authors declare no competing interests exist.

Figures

Figure S1.
Figure S1.
Generation of CRISPR/Cas9 mutant lines. (A) CRISPR design and resulting mutations in chosen KO clones. Top lines show gene sequence in WT and mutant (KO) clones with encoded amino acid sequence underneath. Purple lines indicate gRNA target sequence, scissors point to predicted Cas9 cut site, red letters in KO sequences indicate mutagenic base pair insertions, and purple letters in WT sequence indicate base pairs deleted in the mutant lines. Green amino acids are mutagenic changes arising after frameshift in KO lines, and * denotes a premature stop codon. (B) Maximum projection widefield images of WT and GMAP210 KO lines immunolabeled as indicated. GMAP210 antibodies were raised against amino acids 14–148 (N-term GMAP210), 159–365 (GMAP210), and 1760–1855 (C-term GMAP210). (C) Western blots of WT and GMAP210 KO cells probed with an antibody targeting amino acids 14–148 or GMAP210 (central well is an unsuccessful clone—X). (D) Maximum projection widefield images of WT and Golgin-160 KO clones labeled with GM130 (green, cis-Golgi) and Golgin-160 (magenta). (D) Western blot analysis of WT and Golgin-160 KO cell lysates probed with Golgin-160 antibodies and tubulin and GAPDH as loading controls. (D and E) Golgin-160 N-terminal and C-terminal antibodies raised against amino acids 1–350 and 1436–1498, respectively. Source data are available for this figure: SourceData FS1.
Figure 1.
Figure 1.
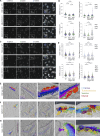
ECM organization is altered in golgin mutant cultures. (A and C) Confocal maximum projection images of non-permeabilized WT, GMAP210 KO (A), and Golgin-160 KO (C) RPE1 cell cultures immunolabeled for extracellular collagen type I (green), fibronectin-1 (magenta), and nuclei (DAPI, blue). Scale bars, 10 µm. (B and D) Quantification of fibril characteristics measured from images represented in A and C using the TWOMBLI ImageJ plug-in (see Materials and methods). Individual dots represent the mean of each biological replicate (n = 4), and bars represent the median of all experiments. (E) Decellularized ECM from WT, GMAP210 KO, and Golgin-160 KO cell cultures imaged by HS-AFM. Images are representative of 10 × 10 raster scans from biological replicates (n = 3). Scale bars, 10 µm. (F) TWOMBLI quantification of fibril characteristics measured from images represented in E. Individual dots are measurements from each tile in the raster scan, with each biological replicate color-coded (n = 4). Bars represent the median of all experiments. (B, D, and F) Data were subjected to a Shapiro–Wilk test for normality and then a nested one-way ANOVA with Dunnett’s test for multiple comparisons to generate P values. ANOVA, analysis of variance.
Figure 2.
Figure 2.
Collagen deposition in the matrix is impaired in golgin mutant cells. (A) Immunoblot for Col1a1 and total protein stain after SDS-PAGE of medium (M) and lysate (L) samples taken from WT and golgin KO cultures. (B) Immunoblot for Col1a1 and total protein stain after SDS-PAGE of the cell-derived matrix extracted from WT and golgin mutant cultures. (C i and ii) Quantification of Col1a1 intensity normalized against total cellular protein for i lysate samples as represented in A and ii matrix samples as represented in B. Dots show individual experiment result (n = 3), and bars show the mean and standard deviation. Data were subjected to a Shapiro–Wilk test for normality and then a nested one-way ANOVA with Dunnett’s test for multiple comparisons to generate P values. Source data are available for this figure: SourceData F2.
Figure S2.
Figure S2.
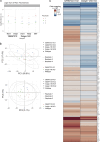
Matrisome analysis in mutant cells. (A) Principal component analysis of the mass spectrometry experiment shown in Fig. 3. (B and C) The Col4a2 sequence was split into its structural features, and abundance of relevant peptides was averaged within each feature and plotted for each mutant. Total Col4a2 abundance was normalized across conditions to investigate peptide-level variation. N = 3. (D) Western blots of medium (M) and lysate (L) fractions from WT and Golgin-160 KO cell cultures stably expressing pro-SBP-GFP-COL1A1. Blots probed with the LF39 antibody targeting the N-terminal propeptide domain of procollagen type I and GAPDH as a housekeeping protein. Source data are available for this figure: SourceData FS2.
Figure 3.
Figure 3.
ECM composition is altered in golgin KO cells. (A and B) Volcano plots showing log-fold change in cell-derived matrix protein abundance from GMAP210 KO (A) or Golgin-160 KO (B) cells compared with WT. Red-labeled points represent proteins with significantly changing abundance, with the Benjamini–Hochberg FDR-corrected P values <0.05, n = 3. Only proteins categorized as matrisome are represented on these plots (Shao et al., 2023). (i and ii) Results for two different clones per gene are shown. (C) Heat map comparing protein abundance changes between the two different golgin KOs after pooling both clones. Red and blue indicate increased and decreased abundance respectively. Color intensity is determined by the average log-fold change across mutants compared with WT.
Figure 4.
Figure 4.
Golgi organization is altered upon loss of GMAP210 or Golgin-160. (A and C) Maximum projection confocal images of WT and GMAP210 KO (A) and Golgin-160 KO (C) RPE1 cells immunolabeled for cis-Golgi (GM130, magenta), cis/medial-Golgi (giantin, green), and TGN (TGN46, blue) markers. Nuclei labeled with DAPI (grayscale). Scale bar, 10 µm. Inset scale bar, 1 µm. (B and D) Quantification of total giantin and TGN46 area and fragment number per cell from images represented in A and C. Individual dots represent one cell and are colored by replicate (n = 3). Bars show the median from each replicate experiment. Statistical analysis was performed using a Shapiro–Wilk normality test and a Kruskal–Wallis significance test. (E–G) Tomographic reconstructions of Golgi structures in WT (E), GMAP210 KO (F), and Golgin-160 KO (G) cells. Segmented membranes are labeled as cisternae (blue/purple), dilated structures (red), tubulovesicular structures (yellow), and vesicles (green). (E ii, F ii, iii, and G ii iii) Single-slice images with segmentation. (F ii and iii) Open arrows point to invaginations within spherical regions of tubulovesicular structures. (G ii and iii) Double-headed arrows indicate top-to-bottom fenestrations in cisternae, closed-headed arrows indicate budding structures at the nuclear envelope, and pink arrow shows frustrated budding/fusion intermediate. (E i, iii, iv, F i, iv, v, and G i, iv, v) 3D rendering of segmentation. (E–G i) Scale bar, 1 µm.
Figure S3.
Figure S3.
Early secretory pathway organization in golgin mutants. (A) Widefield images of MC3T3 cells transfected with Cas9 and gRNA targeting either Trip11 or Golga3 genes and stained for GMAP210 (Trip11) or Golgin-160 (Golga3) to identify KO cells (as indicated by an asterisk) and GM130. Inserts show GM130 label in a WT and a KO cell from a mixed population. Scale bar, 10 µM. (B and C) Confocal maximum projection images of WT and golgin KO cell lines stained for cis/medial-Golgi membrane (giantin, magenta) markers and either ERGIC (ERGIC53, green) (A) or COP1 (βCOP, green) structures (B). Scale bars, 10 µM.
Figure S4.
Figure S4.
Secretome analysis in mutant cells. (A) Log2 sum of raw peptide abundance in each proteomics replicate from the secretome analysis shown in Fig. 5. (B) Principal component analysis of the secretome data sets represented in Fig. 5. (C) Heat map comparing protein abundance changes between the two different golgin KOs in the secretome experiment. Red and blue indicate increased and decreased abundance, respectively, and intensity of color is determined by the average log fold change across mutants compared with WT.
Figure 5.
Figure 5.
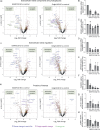
General secretion is differentially impacted by loss of GMAP210 or Golgin-160. (A) Volcano plots showing log-fold change in protein abundance in the media from KO versus WT cultures plotted against significance across three independent replicate experiments. The results from the two golgin KO clonal cell lines were pooled to increase power. Lines and dot colors on the graph are for P < 0.05 and >1 or less than −1 LogFC. Triangular points show hits, which pass an FDR-corrected P < 0.05. (i–iii) Structural ECM proteins (i), ECM regulators (ii), and other proteins of interest (iii) have been highlighted. Proteins significantly changed in the same way in both KO cultures are labeled in dark blue, while proteins impacted in a golgin-specific way are labeled in purple. The proteoglycan family is indicated by green text. (B–H) RT-PCR analysis of the gene expression of (B) BGN, (C) SPARC, (D) DCN, (E) ARHGDIB, (F) FAM20C, (G) PLOD1, and (H) THBS1. Expression levels normalized to the expression of the housekeeping gene YWHAZ. Individual data points represent biological replicate experiments (n = 3–4). Bars show the mean and standard deviation.
Figure S5.
Figure S5.
BGN-SBP-mSc localization in mutant cells. (A) Widefield maximum projections of cells stably expressing BGN-SBP-mSc (blue) and immunolabeled for the ERGIC (ERGIC53, green), cis/medial-Golgi (giantin, magenta), and TGN (TGN46, grayscale). Scale bar in main image, 10 µm; and insert, 1 µm. (B and C) Line-scan fluorescence intensity readings across Golgi elements measured at key time points in the RUSH assays shown in Figs. 6 and 7; and Videos 4, 5, 6, 7, 8, and 9. The region measured is shown in inset. Line traces show (B) BGN-SBP-mSc (magenta trace) or (C) SPARC-SBP-mSc accumulates adjacent to ManII-positive Golgi elements (green trace, middle column) and then colocalizes with ManII-BFP (right column). Fluorescence measurements are normalized to the maximal point of each trace to account for differential expression and photobleaching rates of each fluorescent protein. Arrows highlight peak for each protein. ManII, mannosidase II.
Figure 6.
Figure 6.
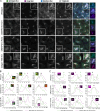
BGN can traffic efficiently in golgin KO cells. (A–C) BGN RUSH assay in WT (A), GMAP210 KO (B), and Golgin-160 KO (C) cells stably expressing BGN-SBP-mSc (magenta) and transiently transfected with an ER hook (not visible) and mannosidase II-BFP (green) prior to the experiment. Images are single-plane confocal images taken from time-lapse movies of BGN transport after release from the ER by biotin addition at T 00:00. Time after biotin addition is indicated in top left corner as mm:ss. (A i, B i, and C i) White arrows highlight the emergence of post-Golgi carriers. Scale bar, 10 µm. (A ii, B ii, and C ii) Crop showing incidence of ER–Golgi transport of BGN as highlighted by the arrow. Scale bar, 1 µm. (A iii, B iii, and C iii) Crop showing incidence of post-Golgi transport of BGN with carrier highlighted by the arrow. Scale bar, 1 µm. (D) Quantification of ER–Golgi transport, measured as time between biotin addition and the appearance of the BGN signal adjacent to mannosidase II-BFP label. (E) Quantification of Golgi transit time, measured as the time between BGN enrichment adjacent to mannosidase II-BFP signal and the emergence of a visible post-Golgi carrier. (D–E) All quantification performed on live movies as represented in A–C. Individual data points represent individual cells imaged across six independent experiments, and bars show the mean and standard deviation. (D) Data were subjected to a Shapiro–Wilk test for normality (failed) and then a nested one-way ANOVA with the Kruskal–Wallis test. (E) Data were subjected to a Shapiro–Wilk test for normality (passed) and then a nested one-way ANOVA with Dunnett’s test for multiple comparisons to generate P values.
Figure 7.
Figure 7.
SPARC traffics through alternative pathways in golgin KO cells. (A–D) SPARC RUSH assay in WT (A), GMAP210 KO (B), and Golgin-160 KO (C) cells stably expressing SPARC-SBP-mSc (magenta) and transiently transfected with an ER hook (not visible) and mannosidase II-BFP (green, outlined by white dashed line) prior to the experiment. Images are single confocal planes taken from time-lapse movies of SPARC transport after release from the ER by biotin addition at T 00:00. Time after biotin addition is indicated in the top left corner as mm:ss. White arrows indicate SPARC accumulation adjacent to the mannosidase II–positive membranes. Blue arrows highlight peripheral puncta that initiate vesicular ER–Golgi transport. Scale bars, 10 µm. (D i–iii) Quantification of (i) time to arrival at Golgi after biotin addition, (ii) Golgi transit time, measured as the time between SPARC enrichment adjacent to mannosidase II-BFP signal and the emergence of a visible post-Golgi carrier, and (iii) the number of cells in which post-Golgi carriers were identified within 45 min of imaging time, from movies represented in A–C. Individual data points represent individual cells imaged across four independent experiments, and bars show the mean and standard deviation. (i) Data were subjected to a Shapiro–Wilk test for normality (failed) and then a nested one-way ANOVA with a Kruskal–Wallis test. (ii) Data were subjected to a Shapiro–Wilk test for normality (passed) and then a nested one-way ANOVA with Tukey’s multiple comparison test. (E) Maximum projection confocal stacks of SPARC-SBP-mSc stable cell lines transfected with GM130-GFP to mark the Golgi. Scale bar, 10 µm.
Figure 8.
Figure 8.
BGN is undermodified in golgin KO cells. (A) Western blots of medium (M) and lysate (L) samples taken from WT, GMAP210 KO, and Golgin-160 KO cells stably expressing BGN-SBP-mSc, probed with anti-RFP, GAPDH, and anti-BGN antibodies. Medium samples were collected over 16 h. (B) Quantification of the ratio between extracellular (M) and intracellular (L) BGN in WT and KO cultures, as determined by densitometry of the blots shown in A. (C) Quantification of the ratio between 250- and 150-kDa BGN bands present in the blots represented in A. (B and C) Dots represent measurements from independent experiments, and bars show the mean and SD. Data were subjected to a Shapiro–Wilk test for normality (passed) and then a nested one-way ANOVA with Dunnett’s test for multiple comparisons to generate P values. (D and E) Western blots of medium and lysate samples from WT and KO lines stably expressing BGN-SBP-mSc. Medium samples were collected over 16 h and then treated with PNGase F (D) or chondroitinase ABC (E) prior to SDS-PAGE. Blots were probed with antibodies targeting the mScarlet-i tag (RFP antibody). (D) Arrows depict undigested (black) and PNGase F–digested (green) protein species. (F) Western blots of medium and lysate samples from WT and KO lines stably expressing BGN-SBP-mSc. Media were collected 5 h after the addition of DMSO (control) or nocodazole to cultures. Immunoblot for mScarlet-i tag (RFP antibody). Source data are available for this figure: SourceData F8.

Similar articles

References

    1. Adams, J.C. 2023. Passing the post: Roles of posttranslational modifications in the form and function of extracellular matrix. Am. J. Physiol. Cell Physiol. 324:C1179–C1197. 10.1152/ajpcell.00054.2023 - DOI - PMC - PubMed
    1. Adusumalli, R., Åsheim H.C., Lupashin V., Blackburn J.B., and Prydz K.. 2021. Proteoglycan synthesis in conserved oligomeric Golgi subunit deficient HEK293T cells is affected differently, depending on the lacking subunit. Traffic. 22:230–239. 10.1111/tra.12804 - DOI - PMC - PubMed
    1. Ahat, E., Song Y., Xia K., Reid W., Li J., Bui S., Zhang F., Linhardt R.J., and Wang Y.. 2022. GRASP depletion-mediated Golgi fragmentation impairs glycosaminoglycan synthesis, sulfation, and secretion. Cell. Mol. Life Sci. 79:199. 10.1007/s00018-022-04223-3 - DOI - PMC - PubMed
    1. Appenzeller-Herzog, C., and Hauri H.P.. 2006. The ER-Golgi intermediate compartment (ERGIC): In search of its identity and function. J. Cell Sci. 119:2173–2183. 10.1242/jcs.03019 - DOI - PubMed
    1. Arab, M., Chen T., and Lowe M.. 2024. Mechanisms governing vesicle traffic at the Golgi apparatus. Curr. Opin. Cell Biol. 88:102365. 10.1016/j.ceb.2024.102365 - DOI - PubMed

MeSH terms

LinkOut - more resources