. 2025 Aug 18;21(8):e1013324.
doi: 10.1371/journal.pcbi.1013324. eCollection 2025 Aug.

Mechanistic computational modeling of sFLT1 secretion dynamics

Affiliations

Mechanistic computational modeling of sFLT1 secretion dynamics

Amy Gill et al. PLoS Comput Biol. .

Abstract

Constitutively secreted by endothelial cells, soluble FLT1 (sFLT1 or sVEGFR1) binds and sequesters extracellular vascular endothelial growth factors (VEGF), thereby reducing VEGF binding to VEGF receptor tyrosine kinases and their downstream signaling. In doing so, sFLT1 plays an important role in vascular development and in the patterning of new blood vessels in angiogenesis. Here, we develop multiple mechanistic models of sFLT1 secretion and identify a minimal mechanistic model that recapitulates key qualitative and quantitative features of temporal experimental datasets of sFLT1 secretion from multiple studies. We show that the experimental data on sFLT1 secretion is best represented by a delay differential equation (DDE) system including a maturation term, reflecting the time required between synthesis and secretion. Using optimization to identify appropriate values for the key mechanistic parameters in the model, we show that two model parameters (extracellular degradation rate constant and maturation time) are very strongly constrained by the experimental data, and that the remaining parameters are related by two strongly constrained constants. Thus, only one degree of freedom remains, and measurements of the intracellular levels of sFLT1 would fix the remaining parameters. Comparison between simulation predictions and additional experimental data of the outcomes of chemical inhibitors and genetic perturbations suggest that intermediate values of the secretion rate constant best match the simulation with experiments, which would completely constrain the model. However, some of the inhibitors tested produce results that cannot be reproduced by the model simulations, suggesting that additional mechanisms not included here are required to explain those inhibitors. Overall, the model reproduces most available experimental data and suggests targets for further quantitative investigation of the sFLT1 system.


Conflict of interest statement

The authors have declared that no competing interests exist.

Figures
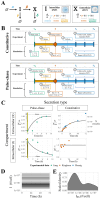
Fig 1
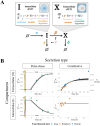
Fig 1. Modeling sFLT1 secretion with ordinary differential equations (ODEs).
(A) Model of sFLT1 secretion dynamics describing the impact of production (rate α), secretion (rate constant β), intracellular degradation (γ), and extracellular degradation (δ) on the concentrations of intracellular (I) and extracellular (X) sFLT1 as a system of ordinary differential equations (ODEs). Created with BioRender.com. (B) Comparison of simulation (top row) and experimental (bottom row) approaches for studying sFLT1 secretion in the constitutive secretion scenario (left column) and pulse-chase secretion scenario (right column). (C) Simulated time courses (n = 100) of extracellular (X, top) and intracellular (I, bottom) sFLT1 secretion for pulse-chase (left) and constitutive (right) cases using the ODE model. X was normalized to its value at 8h (upper left) or 24h (upper right), while I was normalized to its value at 0h. The highlighted region (P) marks the 20-minute pulse. (D) Number of intracellular sFLT1 (I) molecules per cell over time and (E) distribution of steady state intracellular sFLT1 (ISS) during simulations of constitutive secretion using the ODE model.
Fig 2
Fig 2. Modeling sFLT1 secretion with delay differential equations (DDEs).
(A) Model of sFLT1 secretion dynamics as a system of delay differential equations (DDEs), extending the ODE model (Fig 1A) with a fixed maturation delay (τ) affecting secretion and intracellular degradation processes. Created with Biorender.com. (B) Simulated time courses (n=594) of extracellular (X, top) and intracellular (I, bottom) sFLT1 secretion for pulse-chase (left) and constitutive (right) cases using the base DDE model. X was normalized to its value at 8h (upper left) or 24h (upper right), while I was normalized to its value at 0h. The highlighted region (P) marks the 20-minute pulse.
Fig 3
Fig 3. Comparing candidate models of sFLT1 secretion.
(A) Structure of candidate model equations and equation term options for each process when present or absent in a given model. In the production decay term, the value of [chase] is 1 during the chase phase of pulse-chase simulations and 0 otherwise. (B) Top: Processes included (filled) or excluded (empty) in each model. ε: internalization, κ: production decay, τ: maturation delay. Middle: Cost (goodness of fit) of each model, defined as the sum of squared differences (SSD) between experimental data points and the lowest cost simulation of each model, with colors indicating the contribution of each experimental dataset. X: extracellular sFLT1, I: intracellular sFLT1. Bottom: Corrected Akaike Information Criterion (AICC) scores for each model. All models are fit to the same number of observations (n=26), while the number of parameters k varies by model. (C) Impact of additional processes on the best-fit cost of the candidate models. Model nodes (points) are plotted as minimum model cost versus number of parameters k. Edges (arrows) represent transitions between candidate model structures by adding the labeled process (τ (maturation delay): pink arrows, κ (production decay): blue arrows, ε (internalization): gray arrows. The vertical height of each arrow represents the decrease in cost from adding the labeled process to a given model.
Fig 4
Fig 4. Properties of optimized parameter sets from the DDE model of sFLT1 secretion.
(A) Distributions of initial (yellow) and optimized (black) model parameter values for the delay differential equation model after filtering for low-cost fits (n = 594). Y axes are normalized such that each distribution has a maximum density of 1. (B) Correlations between α, β, and γ values in optimized parameter sets. Each point represents the observed values of the listed parameters in a single run of the delay differential equation model after filtering for low-cost fits (n  = 594). (C) Distributions of initial (yellow) and optimized (black) values of calculated compound parameters c1 = αβ and c2 = β + γ for the delay differential equation model after filtering for low-cost fits (n = 594). (D-G) Correlation between intracellular steady state sFLT1 (ISS) and (D) α/(β + γ), (E) α, (F) β, (G) γ. Dashed lines indicate theoretical bounds (min(ISS) =c1/c22, min(α) =c1/c2, min(β) = min(γ) = 0, max(β) = max(γ) = 0; see S2 Text. Bounds and highlighted trendlines are calculated using median values of c1 and c2 (Table 1).
Fig 5
Fig 5. Analysis of simulated sFLT1 kinetic process fluxes.
(A) Reaction network graph showing process fluxes (Φ). (B) Equations for process fluxes. (C) Process fluxes over time during simulation of constitutive sFLT1 secretion. (D) Rates of change of extracellular sFLT1 (dX/dt = Φ(Secr) − Φ(XDeg)) and intracellular sFLT1 (dI/dt  = Φ(Prod) − Φ(Secr) − Φ(IDeg)) during constitutive secretion. (E) Constitutive flux distributions for time-constant processes. (F) Process fluxes over time during simulation of pulse-chase sFLT1 secretion. (G) Rates of change of extracellular and intracellular sFLT1 during pulse-chase secretion. In C, D, F, and G, each line represents a different optimized parameter set. Prod = production, Secr = secretion, IDeg = intracellular degradation, XDeg = extracellular degradation.
Fig 6
Fig 6. Local and global univariate sensitivity analysis of the sFLT1 secretion DDE model.
(A) Relative sensitivity of sFLT1 secretion output variables to local changes in input parameters during simulation of constitutive secretion. The base case is the median parameter set, and all other cells represent the observed fractional increase in the output variable per fractional increase in the parameter. X72h: extracellular sFLT1 after 72 hours; I72h: intracellular sFLT1 after 72 hours; T50_X: time to half-steady-state for extracellular sFLT1. (B) Global univariate sensitivity analysis of extracellular and intracellular sFLT1 showing the effect of multiplying each input parameter by a scaling factor during constitutive secretion. The base case (scaling factor 1) is the median parameter set from the optimized parameter sets (Table 1).
Fig 7
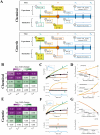
Fig 7. Simulated chemical inhibition and genetic downregulation of sFLT1 secretion.
(A) Simulation timeline schematic for chemical inhibition (top) and genetic downregulation (bottom) of constitutive secretion. p=p represents change of parameter values to apply inhibitor effect. (B) Effects of chemical inhibition of individual parameters by 90% on extracellular sFLT1 (X) and intracellular sFLT1 (I) at 18h and 72h, expressed as log2 fold changes relative to the control (uninhibited) case. (C) Time courses for absolute concentrations of extracellular (X) and intracellular (I) sFLT1 with 90% chemical inhibition of each parameter. The impact of inhibiting each process is how different each line is from the prediction of the median, unmodified parameter set (black line). The inset magnifies the trend for inhibition of α. Black points, experimental ELISA data for the uninhibited case [29]. (D) Annotated curves for chemical inhibition of β (red) and γ (orange) reproduced from (C). Horizontal lines indicate experimentally observed relative changes in extracellular (X18h) and intracellular (I18h) sFLT1 18 hours after drug addition. Vertical lines indicate the fraction inhibition of the target parameter required to reproduce experimental results. (E) Effects of genetic downregulation of individual parameters by 90%, as described in (B). (F) Time courses for absolute concentrations of extracellular (X) and intracellular (I) sFLT1 with 90% genetic downregulation of each parameter, as described in (C). (G) Annotated curves for genetic downregulation of β (red) and γ (orange), as described in (D).
Fig 8
Fig 8. Simulating chemical and genetic inhibition of sFLT1 secretion from different initial parameter sets.
(A) Annotated curves for chemical inhibition of β (secretion, first 3 columns) and γ (intracellular degradation, rightmost column) at 18 hours. Horizontal lines indicate experimentally observed relative changes in extracellular (X18h) and intracellular (I18h) sFLT1 18 hours after addition of brefeldin, chlorpromazine, TATNSF700, or chloroquine. Colored vertical lines mark the fraction inhibition required to match the observed change in sFLT1 when starting from the parameter set with the matching β value. (B) Annotated curves for genetic inhibition of β (secretion rate constant) at 18 hours post media change. Horizontal lines indicate experimentally observed relative changes in extracellular (X18h) and intracellular (I18h) sFLT1 after 18 hours after media change in cells transfected with siRNA targeting the listed secretion-linked protein 48 hours previously [13]. Colored vertical lines mark the fraction inhibition required to match the observed change in sFLT1 when starting from the parameter set with the matching β value.

Update of

Similar articles

References

    1. Uhlén M, Fagerberg L, Hallström BM, Lindskog C, Oksvold P, Mardinoglu A, et al. Proteomics. tissue-based map of the human proteome. Science. 2015;347(6220):1260419. doi: 10.1126/science.1260419 - DOI - PubMed
    1. Palade G. Intracellular aspects of the process of protein synthesis. Science. 1975;189(4200):347–58. doi: 10.1126/science.1096303 - DOI - PubMed
    1. Uhlén M, et al. The human secretome. Sci Signal. 2019;12:eaaz0274. - PubMed
    1. Munro S. Localization of proteins to the Golgi apparatus. Trends Cell Biol. 1998;8:11–5. - PMC - PubMed
    1. Sun X, Mahajan D, Chen B, Song Z, Lu L. A quantitative study of the Golgi retention of glycosyltransferases. J Cell Sci. 2021;134(20):jcs258564. doi: 10.1242/jcs.258564 - DOI - PubMed

MeSH terms

Substances

LinkOut - more resources