. 2025 Aug 18;21(8):e1013391.
doi: 10.1371/journal.pcbi.1013391. eCollection 2025 Aug.

A feedforward mechanism for human-like contour integration

Affiliations

A feedforward mechanism for human-like contour integration

Fenil R Doshi et al. PLoS Comput Biol. .

Abstract

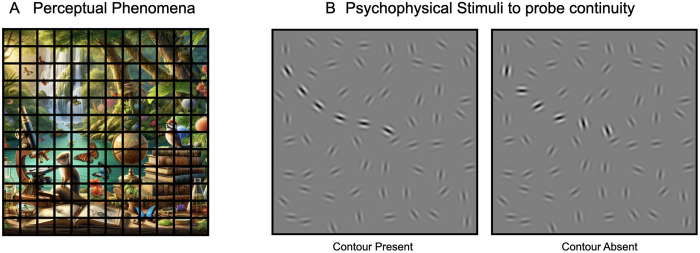
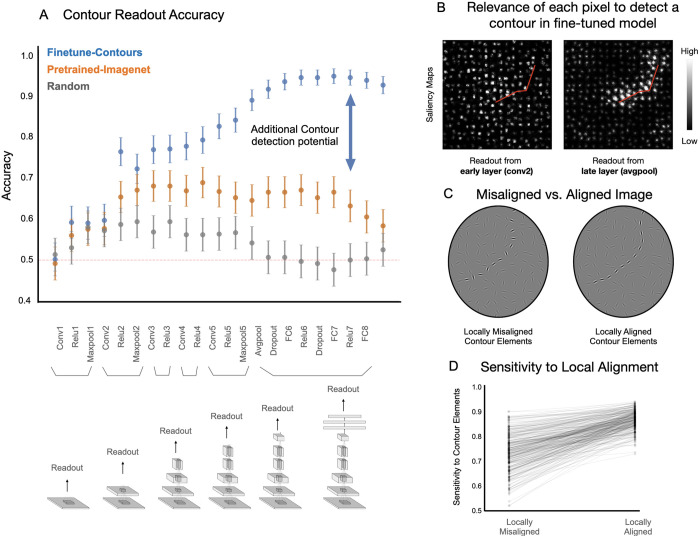
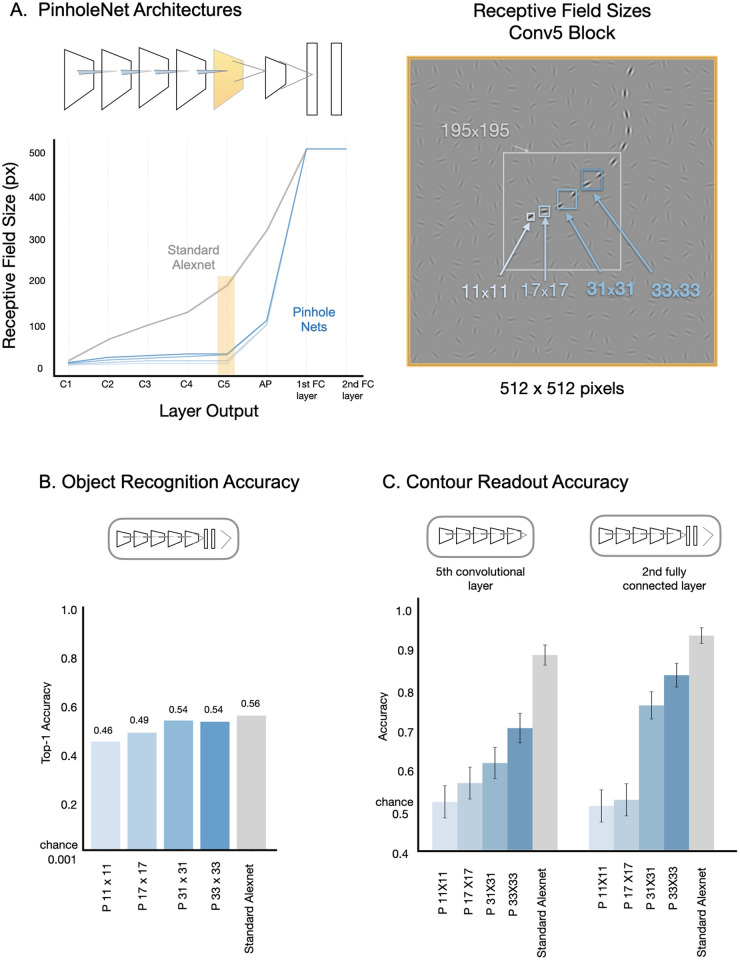
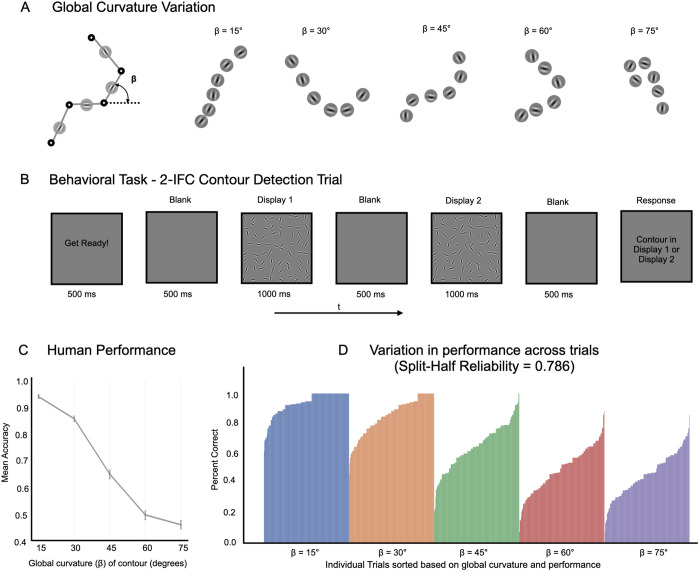
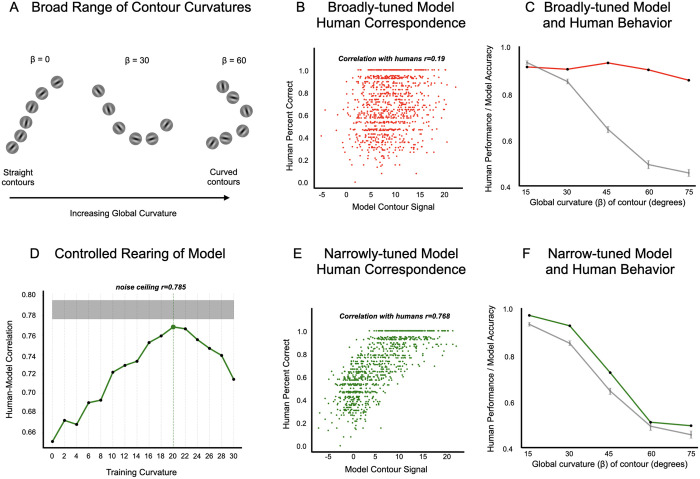
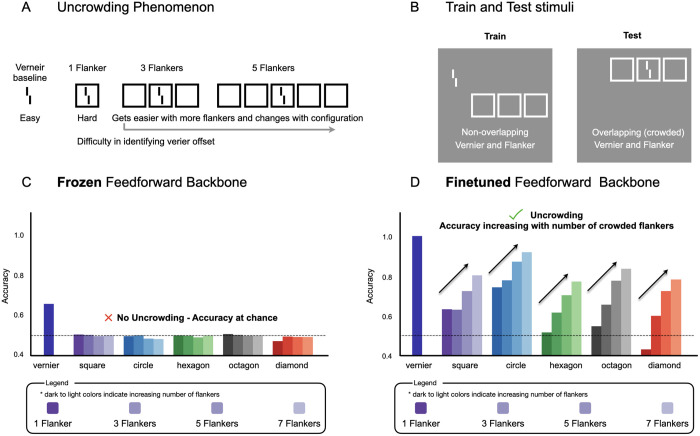
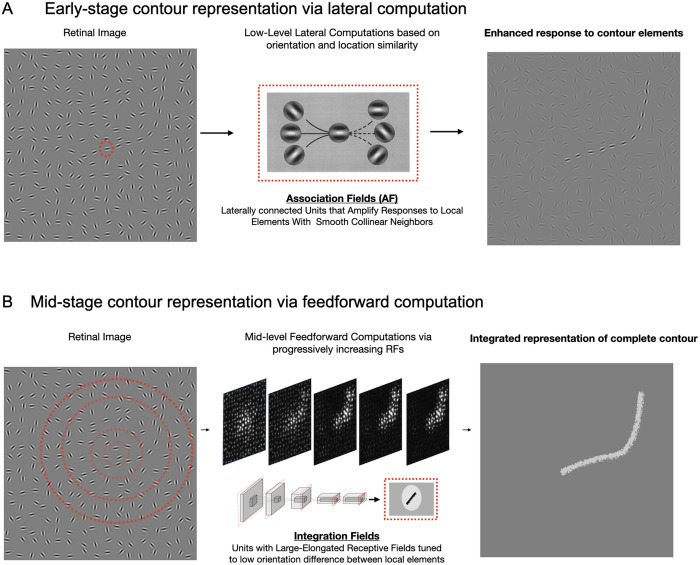
Deep neural network models provide a powerful experimental platform for exploring core mechanisms underlying human visual perception, such as perceptual grouping and contour integration-the process of linking local edge elements to arrive at a unified perceptual representation of a complete contour. Here, we demonstrate that feedforward convolutional neural networks (CNNs) fine-tuned on contour detection show this human-like capacity, but without relying on mechanisms proposed in prior work, such as lateral connections, recurrence, or top-down feedback. We identified two key properties needed for ImageNet pre-trained, feed-forward models to yield human-like contour integration: first, progressively increasing receptive field structure served as a critical architectural motif to support this capacity; and second, biased fine-tuning for contour-detection specifically for gradual curves (~20 degrees) resulted in human-like sensitivity to curvature. We further demonstrate that fine-tuning ImageNet pretrained models uncovers other hidden human-like capacities in feed-forward networks, including uncrowding (reduced interference from distractors as the number of distractors increases), which is considered a signature of human perceptual grouping. Thus, taken together these results provide a computational existence proof that purely feedforward hierarchical computations are capable of implementing gestalt "good continuation" and perceptual organization needed for human-like contour-integration and uncrowding. More broadly, these results raise the possibility that in human vision, later stages of processing play a more prominent role in perceptual-organization than implied by theories focused on recurrence and early lateral connections.


Conflict of interest statement

The authors have declared that no competing interests exist

Figures

Fig 1
Fig 1. Visual grouping and contour integration in human perception.
(A) Demonstration of the phenomena where observers can group boundaries from the same object despite occlusions. This panel was generated using OpenAI’s DALL.E. (B) Psychophysical stimuli to examine the ‘continuity’ principle underlying contour integration (Field et al., 1993). The left panel displays a contour-present stimulus containing a subset of gabor patches (i.e., contour elements) systematically aligned to suggest an extended, coherent contour amidst randomly oriented background patches. The right panel displays a contour-absent stimulus with identical gabor patches, except the contour patches are also randomly oriented, eliminating the perception of the continuous contour. Contour patches are highlighted for illustrative clarity.
Fig 2
Fig 2. Contour integration capacity in feedforward CNNs.
(A) Accuracy on contour detection for the held-out test set across different readout layers – gray indicating randomly initialized models, orange for models pretrained on Imagenet for object recognition, and blue for finetuned models. Error bars denote 95% confidence intervals for readout accuracy. (B) Saliency maps from two fine-tuned models, highlighting pixel relevance for detecting the contour within an example image; location of the contour is highlighted in red for illustrative purposes. (C) Example image pair with misaligned and aligned contour elements. Contour patches are highlighted for illustrative clarity. (D) Plot showing the fine-tuned model’s sensitivity to elements making up the contour (for aligned display), or elements at the same locations in misaligned display. Each pair is connected via a gray line. Overall the plot depicts the sensitivity to local alignment of contour elements.
Fig 3
Fig 3. Impact of receptive field size and progression on contour integration in feedforward models.
(A) left: shows the receptive field progression over the layers (blue lines), relative to the standard Alexnet model (gray); right: shows the size of the receptive fields of units in the 5th Convolutional block the final stage of the backbone before the fully-connected layers. (B) Top-1 object recognition accuracy on the ImageNet validation set for PinholeNet models with varying receptive field sizes (blue bars), as well as the standard Alexnet model (gray bar). (C) Contour detection accuracy for readout from the 5th convolutional layer (left), and the 2nd fully-connected layer (right) in PinholeNets (blue bars) and the standard Alexnet model (grey bar) on the held-out test set. The error bars denote the 95% confidence intervals for readout accuracy.
Fig 4
Fig 4. Human sensitivity to global curvature.
(A) Variation in global curvature (β) across a range of contour stimuli used in the study, with β values set at 15°, 30°, 45°, 60°, and 75°, demonstrating straighter to more curved contours. (B) Sequence of a 2-IFC contour detection trial where participants identify the display containing the contour. (C) Mean accuracy of participants for contour detection across varying β conditions, with error bars representing 95% confidence intervals of the mean accuracy bootstrapped across participants. (D) Bar graph showing the variability in human performance across individual trials within each β condition.
Fig 5
Fig 5. Model and human behavioral correspondence for contour integration.
(A) Contour stimuli containing global curvatures (β) spanning a broad range. (B) Scatter-plot depicting the correlation between the broadly-tuned model’s contour signal strength and human percent correct across trials, showing weak correspondence (Pearson’s r = 0.1907). (C) Line plot illustrating the broadly-tuned model’s performance against human performance for different global curvature levels, highlighting the model’s insensitivity to increasing curvature. The broadly-tuned model’s performance is shown in red and human performance is shown in grey. (D) Line plot illustrating the correlation of models, that were trained on curvatures within a specific narrow range (resulting in narrowly-tuned models), with humans, peaking at β = 20° and approaching noise ceiling (r = 0.785). (E) Scatter-plot depicting the correlation between the narrowly-tuned (at 20°) model’s contour signal strength and human percent correct across trials, showing strong correspondence (Pearson’s r = 0.768). (F) Line plot illustrating the narrowly-tuned model’s (at 20°) performance against human performance for different global curvature levels, highlighting the human-like sensitivity to curvature. The narrowly-tuned model’s performance is shown in green and human performance is shown in grey.
Fig 6
Fig 6. Fine-tuning a purely feedforward network reveals a capacity for visual uncrowding.
(A) A schematic of the uncrowding phenomenon. Identifying the offset of a vernier target is easy when presented in isolation (baseline), becomes difficult when surrounded by a single flanker (crowding), and becomes easier again as more identical flankers are added to the configuration (uncrowding). (B) The out-of-distribution training and testing paradigm. Models were trained on non-overlapping stimuli, where the vernier and flanker configurations appeared in the same image but were spatially separate and tested on overlapping (crowded) stimuli, where the vernier was centered within the flanker configuration. (C) Performance of a VGG19 architecture with a frozen, pretrained backbone. While the model can identify the vernier in isolation, its accuracy drops to chance level for all crowded conditions, regardless of the number of flankers. The model fails to exhibit uncrowding, consistent with prior reports on the limits of pretrained feedforward architectures. (D) Performance of a VGG19 network with a fine-tuned backbone. Accuracy is high for the isolated vernier, drops with a single flanker, and then systematically increases as more flankers are added. The results shown are from the model with the clearest emergent uncrowding.
Fig 7
Fig 7. Computational mechanisms underlying human contour integration.
(A) Low-level computations amplify responses to local elements that are part of a contour in the retinal image. This is facilitated by lateral connections between units with collinear tunings conceptualized as Association Fields (B) Mid-level feedforward computations focus on identifying potential candidates for an extended contour in the retinal image. This is facilitated by units with progressively increasing receptive fields (RFs) that are tuned to low orientation differences, allowing for the integration of local features into coherent extended contours.

Similar articles

Cited by

References

    1. Biederman I. Recognition-by-components: a theory of human image understanding. Psychol Rev. 1987;94(2):115–47. doi: 10.1037/0033-295X.94.2.115 - DOI - PubMed
    1. Biederman I, Ju G. Surface versus edge-based determinants of visual recognition. Cogn Psychol. 1988;20(1):38–64. doi: 10.1016/0010-0285(88)90024-2 - DOI - PubMed
    1. Marr D, Nishihara HK. Representation and recognition of the spatial organization of three-dimensional shapes. Proc R Soc Lond B Biol Sci. 1978;200(1140):269–94. doi: 10.1098/rspb.1978.0020 - DOI - PubMed
    1. Nakayama K, Shimojo S. Experiencing and perceiving visual surfaces. Science. 1992;257(5075):1357–63. doi: 10.1126/science.1529336 - DOI - PubMed
    1. Nakayama K, He ZJ, Shimojo S. Visual surface representation: A critical link between lower-level and higher-level vision. 1995.

LinkOut - more resources