. 2025 Aug 18;19(8):e0013433.
doi: 10.1371/journal.pntd.0013433. eCollection 2025 Aug.

Impact of climate change on the spread of fascioliasis into the extreme south of South America

Affiliations

Impact of climate change on the spread of fascioliasis into the extreme south of South America

Pablo Fernando Cuervo et al. PLoS Negl Trop Dis. .

Abstract

The impact of global warming on the transmission of fascioliasis, a highly pathogenic zoonotic snail-borne disease, was already highlighted during the 2010's. However, since then, only a few studies have tried to relate the climatic change with the uprise of outbreaks in endemic areas of animal or human fascioliasis. This might be because assessing the consequences of a changing climate on the spread of fascioliasis is extremely challenging, as it presents the widest latitudinal, longitudinal and altitudinal distribution known for a snail-borne disease. In the Americas, where it is only caused by Fasciola hepatica, the disease is widespread throughout the continent, except in its southernmost extremity in the Patagonia region, which was believed to be due to the too low temperatures. Though, recent empirical evidence indicates an ongoing spread of the disease into more southern latitudes. The present study aims to assess the long-term evolution of climate change factors and forecast indices throughout this extreme South American region to conclude whether their impact might have been the cause of the southward expansion of the fascioliasis endemic area. The use of seasonal-trend decomposition analyses and of spatial interpolation techniques demonstrated a remarkable climatic change in the Patagonia region allowing to clarify the southern spread of the disease. This is the first study highlighting a clear link between the consequences of a changing climate and the spread of a fascioliasis endemic area and its transmission risk to extreme latitudes. Moreover, it provides some crucial recommendations and concerns regarding the application and interpretation of two widely applied climatic forecast indices. If current climate trends persist, this geographical expansion is expected to progress further. These findings not only provide critical insight into local disease dynamics but also underscore the broader implications of climate-driven changes in the distribution of snail-borne diseases globally.


Conflict of interest statement

The authors have declared that no competing interests exist.

Figures

Fig 1
Fig 1. Study area, indicating the location of the meteorological stations analyzed, and the area where the southern expansion of F. hepatica occurred during the last decades, between latitudes 46° and 50° S (red dotted lines).
Base layer image by Natural Earth is in the public domain (https://www.naturalearthdata.com/about/terms-of-use/), and countries geopolitical shapes from GADM are freely available for academic use and other non-commercial use (https://gadm.org/license.html).
Fig 2
Fig 2. Heatmaps indicating the monthly data availability of the main climatic factors (maximum temperature, mean temperature, minimum temperature, and precipitation) relevant for the calculation of the fascioliasis forecast indices for the 1956–2021 period for each meteorological station.
The colour ramps indicate the magnitude of the climatic factor, and the grey colour indicates the absence of data. For an improved readability, it is suggested to visualize this figure in its digital version.
Fig 3
Fig 3. Flowchart illustrating the main methodological and data processing steps.
Main outputs are colored in purple.
Fig 4
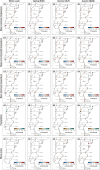
Fig 4. Climate diagrams during the 65-year period analyzed (1956-2021) of five meteorological stations, representing the latitudinal and longitudinal geographical gradient of the area where the geographical spread of the disease has been recently described.
Each plot indicates: (a) the station; (b) the period of years represented by the data; (c) the geographical coordinates in decimal degrees; (d) altitude in meters; (e) the mean yearly temperature; (f) the mean yearly precipitation; (g) the mean maximum temperature during the warmest month; (h) the mean minimum temperature during the coldest month; (i) the mean monthly temperature curve; (j) the mean maximum monthly temperature curve; (k) the potential evapotranspiration as proposed by Hargreaves and Samani (1985) [52]; (l) the mean monthly precipitation curve; (m) the wet and (n) dry seasons; (o) the months when the mean monthly potential evapotranspiration exceeds 100 mm; (p) the months with a mean minimum temperature under 0 °C; (q) the mean duration of the period without freezing and (r) the 10 °C temperature threshold below which fascioliasis transmission due to F. hepatica is unlikely. Months labels in the X-axis are presented as July (J), August (A), September (S), October (O), November (N), December (D), January (J), February (F), March (M), April (A), May (M) and June (J).
Fig 5
Fig 5. Monthly evolution during the 65-year period analyzed (1956-2021) of the climatic forecast indices of five meteorological stations included in the study, representing the latitudinal and longitudinal geographical gradient of the area where the geographical spread of the disease has been described recently.
Each plot indicates: (a) the station; (b) the period of years represented by the data; (c) the geographical coordinates in decimal degrees; (d) altitude in meters; (e) the mean monthly curve of the Wet-day indicator (Mt index); (f) the critical transmission threshold of the Mt index; (g) the mean monthly curve of the cumulative Water-Budget-Based System indicator (Wb-bs index); (h) the critical transmission threshold of the Wb-bs index; (i) the mean yearly value of the Mt index; (j) the maximum monthly value recorded of the Mt index; (k) the mean yearly value of the cumulative Wb-bs index; (l) and the maximum monthly value recorded of the cumulative Wb-bs index. Months labels in the X-axis are presented as July (J), August (A), September (S), October (O), November (N), December (D), January (J), February (F), March (M), April (A), May (M) and June (J).
Fig 6
Fig 6. Spatial distribution in the Patagonia region of annual trends during the 65-year period analyzed (1956-2021) for (a) mean maximum temperature (MMT), (b) mean environmental temperature (MET), (c) mean minimum temperature (MmT), (d) precipitation (Prcp), (e) daily temperature range (DTR), (f) summer days (SU), (g) frost days (FD), (h) icing days (ID), (i) transmission days (Tavg10) (j) and Wb-bs index.
The gradient of colors denotes the intensity of change. Stations with trends significant at the 0.05 level are marked with an upward or downward triangle denoting positive and negative trends, respectively. Circles depict non-significant trends. Country’s geopolitical shapes from GADM are freely available for academic use and other non-commercial use (https://gadm.org/license.html). For an improved readability, it is suggested to visualize this figure in its digital version.
Fig 7
Fig 7. Spatial distribution in the Patagonia region of seasonal trends during the 65-year period analyzed (1956-2021) for (a) mean maximum temperature, (b) mean environmental temperature, (c) mean minimum temperature, (d) precipitation, and (e) Wb-bs index.
The gradient of colors denotes the intensity of change. Stations with trends significant at the 0.05 level are marked with an upward or downward triangle denoting positive and negative trends, respectively. Circles depict non-significant trends. Country’s geopolitical shapes from GADM are freely available for academic use and other non-commercial use (https://gadm.org/license.html). For an improved readability, it is suggested to visualize this figure in its digital version.
Fig 8
Fig 8. Annual change during the 65-year period analyzed (1956-2021) of mean environmental temperature and Wb-bs index in two selected meteorological locations (Gobernador Gregores and San Julian) placed between latitudes 48° and 50° S, where the geographical spread of the fascioliasis transmission area has occurred.
In each panel, picture (1) shows the mean environmental temperature annual trend, represented by the observed values (grey columns), the observed trend obtained from the Seasonal-Trend decomposition procedure (black line), and the regression line (red-slashed line) (the slashed grey line depicts the 10 °C threshold required for the life cycle of Fasciola hepatica to progress). Picture (2) shows the trend of the annual number of days with mean temperature above 10 °C, represented by the observed values (black dots), and the regression line obtained from generalized linear models (red-slashed line). Picture (3) represents the mean monthly change of the Wb-bs index by intervals of 10 years (the slashed grey line depicts the value of 600, which indicates risk of transmission. Picture (4) shows the Wb-bs index annual trend, represented by the observed values (grey columns), the observed trend obtained from the Seasonal-Trend decomposition procedure (black line), and the regression line (red-slashed line) (the slashed grey line depicts the value of 600, which indicates risk of transmission). For an improved readability, it is suggested to visualize this figure in its digital version.
Fig 9
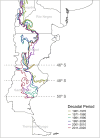
Fig 9. Southern spread during the 65-year period analyzed (1956-2021) of the fascioliasis endemic area as delimited by the Water-budget-based system (Wb-bs) climatic forecast index.
Contour lines per decade represent the minimum Wb-bs value required for transmission to occur (Wb-bs transmission threshold = 600), obtained from interpolated continuous layers representing Wb-bs mean maximum values per decade. Country’s geopolitical shapes from GADM are freely available for academic use and other non-commercial use (https://gadm.org/license.html).

Similar articles

References

    1. Mas-Coma S, Valero MA, Bargues MD. Human and Animal Fascioliasis: Origins and Worldwide Evolving Scenario. Clin Microbiol Rev. 2022;35(4):e0008819. doi: 10.1128/cmr.00088-19 - DOI - PMC - PubMed
    1. Mas-Coma S, Valero MA, Bargues MD. Fascioliasis. In: Toledo R, Fried B, editors. Digenetic trematodes. 3rd ed. Cham: Springer International Publishing; 2024. pp. 157–201. doi: 10.1007/978-3-031-60121-7 - DOI
    1. Hayward AD, Skuce PJ, McNeilly TN. The influence of liver fluke infection on production in sheep and cattle: a meta-analysis. Int J Parasitol. 2021;51(11):913–24. doi: 10.1016/j.ijpara.2021.02.006 - DOI - PubMed
    1. Fanke J, Charlier J, Steppin T, von Samson-Himmelstjerna G, Vercruysse J, Demeler J. Economic assessment of Ostertagia ostertagi and Fasciola hepatica infections in dairy cattle herds in Germany using Paracalc®. Vet Parasitol. 2017;240:39–48. doi: 10.1016/j.vetpar.2017.03.018 - DOI - PubMed
    1. Köstenberger K, Tichy A, Bauer K, Pless P, Wittek T. Associations between fasciolosis and milk production, and the impact of anthelmintic treatment in dairy herds. Parasitol Res. 2017;116(7):1981–7. doi: 10.1007/s00436-017-5481-3 - DOI - PMC - PubMed