. 2025 Jul 2;26(4):bbaf418.
doi: 10.1093/bib/bbaf418.

Protein language model pseudolikelihoods capture features of in vivo B cell selection and evolution

Affiliations

Protein language model pseudolikelihoods capture features of in vivo B cell selection and evolution

Daphne van Ginneken et al. Brief Bioinform. .

Abstract

B cell selection and evolution play crucial roles in dictating successful immune responses. Recent advancements in sequencing technologies and deep-learning strategies have paved the way for generating and exploiting an ever-growing wealth of antibody repertoire data. The self-supervised nature of protein language models (PLMs) has demonstrated the ability to learn complex representations of antibody sequences and has been leveraged for a wide range of applications including diagnostics, structural modeling, and antigen-specificity predictions. PLM-derived likelihoods have been used to improve antibody affinities in vitro, raising the question of whether PLMs can capture and predict features of B cell selection in vivo. Here, we explore how general and antibody-specific PLM-generated sequence pseudolikelihoods (SPs) relate to features of in vivo B cell selection such as expansion, isotype usage, and somatic hypermutation (SHM) at single-cell resolution. Our results demonstrate that the type of PLM and the region of the antibody input sequence significantly affect the generated SP. Contrary to previous in vitro reports, we observe a negative correlation between SPs and binding affinity, whereas repertoire features such as SHM and isotype usage were strongly correlated with SPs. By constructing evolutionary lineage trees of B cell clones from human and mouse repertoires, we observe that SHMs are routinely among the most likely mutations suggested by PLMs and that mutating residues have lower absolute likelihoods than conserved residues. Our findings highlight the potential of PLMs to predict features of antibody selection and further suggest their potential to assist in antibody discovery and engineering.

Keywords: B cells; antibodies; protein language models; repertoire; somatic hypermutation.


Figures

Figure 1
Figure 1
Contextual information influences SPs of antibody repertoires. (a) Four publicly available single-cell V(D)J sequencing datasets with accompanying functional data were used to obtain paired heavy and light chain BCR sequences for five mice and five human samples following immune challenges. Created in BioRender https://BioRender.com/g80m989. (b) Total cell count (top) and distribution of clonal expansion (bottom) per sample. Each section corresponds to a unique clone, and the size corresponds to the fraction of cells relative to the total repertoire. The black color highlights the fraction of clones containing one cell. I = individual, M = mouse. (c) Pearson’s correlation between the SP of the heavy chains based on the input sources for four representative PLMs.
Figure 2
Figure 2
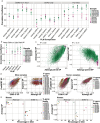
Correlation between SPs calculated with six different PLMs. (a) Pearson correlation between the heavy chain SP calculated with the different PLMs for each of the three input sources. (b) Correlation between the heavy and light chain SPs of the full V(D)J sequences. (c) Correlation between the SPs calculated with Ablang2 based on the paired heavy and light chain (x-axis) and only the heavy chain (left y-axis) or light chain (right y-axis). (d) SPs calculated with different PLMs for mice (left) and human (right) samples, colored by the V-gene family. (e) The average SP per V-gene family and the percentage of unique sequences of this V-gene family in the OAS database for the mice (left) and human (right) samples.
Figure 3
Figure 3
Correlation between SPs and features of B cell repertoire evolution. (a) Distribution of SPs of BCRs from certain isotypes for a general PLM (left) and an antibody-specific PLM (right). T-test significance: *** = adjusted P-value below 0.001. (b) The average SP per isotype and the percentage of unique sequences of this isotype in the OAS database for the mouse samples. (c) The average SP per isotype and the percentage of unique sequences of this isotype in the OAS database for the human samples. (d) Pearson correlation between normalized clonal expansion (number of cells per clonotype divided by the sample size) and SP for ESM-C (left) and Ablang2 (right). (e) Pearson correlation between the amount of SHM (Hamming distance from the germline) and SP for ESM-C (left) and Ablang2 (right).
Figure 4
Figure 4
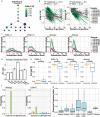
SHM coincides with pseudolikelihoods (SPs) and per-residue likelihoods (RLs). (a) Representative lineage tree colored by ESM-C heavy chain SP. Numbers in the nodes indicate the number of cells. (b) Pearson correlation between ESM-C and Ablang2 SP and the total edge length to the germline (Levenshtein distance) for each sequence in all trees. (c) The RL ranks of the substitutions along the edges of the lineage trees. The average rank is used for edges with multiple substitutions. (d) Mean substitution RL rank for each sample (dots) and average of all samples (bars) per PLM. (e) Difference in average RL between conserved and mutating residues. T-test significance: **** = adjusted P-value < 0.0001. (f) Example distribution of the RLs for one position in a BCR sequence for Ablang2 and ESM-C. (g) The Shannon evenness index of the RL distributions of all positions in all sequences per PLM.
Figure 5
Figure 5
SP correlation with binding affinity. (a) Spearman correlation between polyclonal binding affinity against OVA and heavy chain ESM-C SP and Ablang2 paired chain SP for three mouse samples. (b) Spearman correlation between polyclonal binding affinity against SARS-Cov-2 S protein and heavy chain ESM-C SP and Ablang2 paired chain SP for seven individuals from Kim et al. [27] (c) Lineage tree of the largest IgG clone of Mouse1 colored by heavy chain ESM-C SP (left) and Ablang2 paired SP (right). (d) Lineage tree of the largest IgG clone of Mouse1 colored by binding affinity to OVA. (e) Spearman correlation between monoclonal binding affinity to OVA and heavy chain ESM-C SP and Ablang2 paired SP for the largest IgG clones of Mouse1. The color indicates Levenshtein distance to the germline sequence.

Similar articles

Cited by

References

    1. Eisen HN, Sykulev Y, Tsomides TJ. Antigen-specific T-cell receptors and their reactions with complexes formed by peptides with major histocompatibility complex proteins. Adv Protein Chem 1996;49:1–56. 10.1016/S0065-3233(08)60487-8 - DOI - PubMed
    1. Hozumi N, Tonegawa S. Evidence for somatic rearrangement of immunoglobulin genes coding for variable and constant regions. Proc Natl Acad Sci U S A 1976;73:3628–32. 10.1073/pnas.73.10.3628 - DOI - PMC - PubMed
    1. Xu JL, Davis MM. Diversity in the CDR3 region of V(H) is sufficient for most antibody specificities. Immunity 2000;13:37–45. 10.1016/S1074-7613(00)00006-6 - DOI - PubMed
    1. Eisen HN, Siskind GW. Variations in affinities of antibodies during the immune response. Biochemistry 1964;3:996–1008. 10.1021/bi00895a027 - DOI - PubMed
    1. Miho E, Yermanos A, Weber CR. et al. Computational strategies for dissecting the high-dimensional complexity of adaptive immune repertoires. Front Immunol [Internet] 2018;9. Available from: https://pubmed.ncbi.nlm.nih.gov/29515569/ - PMC - PubMed

LinkOut - more resources