. 2025 Aug 16:86:103826.
doi: 10.1016/j.redox.2025.103826. Online ahead of print.

Macrophages and macrophage extracellular vesicles confer cancer ferroptosis resistance via PRDX6-mediated mitophagy inhibition

Affiliations

Macrophages and macrophage extracellular vesicles confer cancer ferroptosis resistance via PRDX6-mediated mitophagy inhibition

Naisheng Zheng et al. Redox Biol. .

Abstract

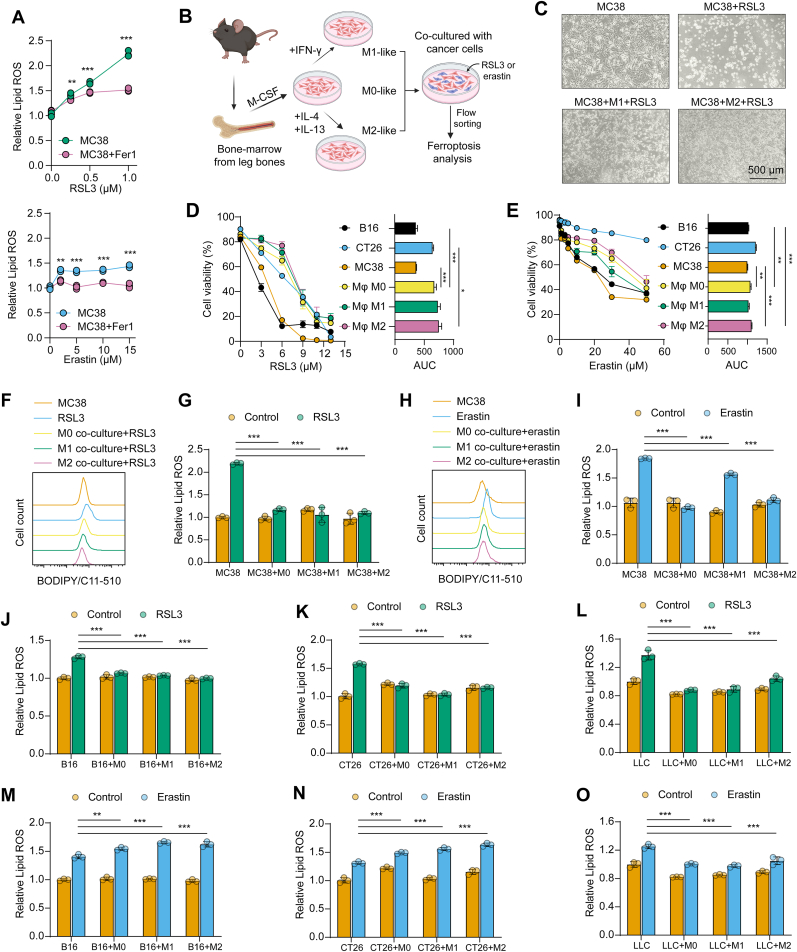
Ferroptosis has emerged as a promising therapeutic target in cancer therapy, with the tumor microenvironment (TME) playing a pivotal role in regulating ferroptosis. Although macrophages contribute to ferroptosis regulation within TME, the underlying mechanisms remain unclear. In this study, we demonstrate that macrophages consistently attenuate GPX4 inhibitor-induced lipid peroxidation and cell death in various tumor cell lines, whereas their resistance to cysteine transport inhibitor-triggered ferroptosis varies across cell types. This tumor protection from ferroptosis is mediated through macrophage-tumor cell contact and the delivery of macrophage-derived extracellular vesicles (Mφ-EV). Transcriptomic and proteomic analyses revealed that macrophages and Mφ-EV enhance glutathione metabolism in tumor cells. Notably, Mφ-EV are uniquely enriched with the glutathione metabolism-related protein PRDX6. Mechanistically, the glutathione peroxidase activity of PRDX6 elevates intracellular reduced glutathione, suppresses lipid peroxidation, and thereby mitigates ferroptosis. Furthermore, macrophage-derived PRDX6 reduces mitochondrial superoxide accumulation, alleviates ferroptosis-induced mitophagy, and enhances tumor cell viability, ultimately promoting tumor growth. Together, our findings provide a novel mechanism of ferroptosis resistance in TME, wherein macrophages confer tumor cell resilience by bypassing GPX4 inhibition.

Keywords: Extracellular vesicles; Ferroptosis; Macrophages; Mitophagy; Peroxiredoxin 6.


Conflict of interest statement

Declaration of competing interest Authors declare no conflict of interest.

Figures

Image 1
Graphical abstract
Fig. 1
Fig. 1
Macrophages inhibit GPX4-dependent ferroptosis in tumor cells (A) Flow cytometry analysis of lipid peroxidation in MC38 cells. The cells were treated with increasing concentrations of RSL3 (up) and erastin (below) in the absence or presence of 5 μM ferrostatin 1 (Fer1) for 24 h. Lipid peroxidation was measured by BODIPY/C11 staining. Each point represents one of three independent experiments. We compared the readouts at each time point using Student's t-test, ∗p < 0.05, ∗∗p < 0.01, ∗∗∗p < 0.001. (B) Scheme of macrophages polarization and co-culture system of macrophages and cancer cells. (C) Morphology of MC38 cells after treatment with RSL3 in the presence of macrophages. Cancer cells were cultured with M1-or M2-like macrophages in 1:1 ratio for 24 h, RSL3 was added at 3 μM for 24 h. Representative picture of one of three independent experiments. (D,E) Flow cytometry analysis of cell viability in cancer cells (B16, MC38, CT26) or Mφ (M0, M1, M2 polarization) treated with increasing concentrations of RSL3 (D) and erastin (E). Each experiment group has three independent samples. Area under the curve (AUC) were compared with one-way ANOVA and Tukey's test, ∗p < 0.05, ∗∗p < 0.01, ∗∗∗p < 0.001. (F–I) Flow cytometry analysis of lipid peroxidation (LipidROS) in MC38 cells measured by BODIPY/C11. Like in panels B and C, the cells were treated with 3 μM RSL3 (F,G) or 10 μM erastin (H,I) for 24 h in the presence of M0, M1-and M2-like macrophages at cell number ratio 1:1. Data are shown as histograms (F,H) and summarized data (G,I). Data was analyzed between RSL3-or erastin-treated samples with ANOVA and Dunnett's test versus MC38 group as a control, ∗p < 0.05, ∗∗p < 0.01, ∗∗∗p < 0.001. (J-O) Flow cytometry analysis of lipid peroxidation in cancer cell lines co-cultured with macrophages. B16 (J,M), CT26 (K,N), and LLC (L,O), cells were co-cultured with Mφ in the presence of RSL3 (JL) or erastin (MO) and analyzed like in panels F–I using ANOVA and Dunnett's test with RSL3-or erastin-treated samples group as a control, ∗p < 0.05, ∗∗p < 0.01, ∗∗∗p < 0.001. Column bars show the mean and SD.
Fig. 2
Fig. 2
Macrophages suppress lipid peroxidation in cancer cells by extracellular vesicles (A) Scheme of transwell co-culture system. Macrophages and cancer cells were separated by 0.4 μM membrane to avoid macrophages migration. (BE) Flow cytometry analysis of RSL3-induced (B,C) or erastin-induced (D,E) lipid peroxidation in MC38 (B,D) or B16 (C,E) cells from transwell co-culture system. (F) Morphology of Mφ-EV assessed by transmission electron microscopy. (GI) Flow cytometry analysis of RSL3-induced lipid peroxidation in MC38 (G) or B16 (H) or CT26 (I) cells pre-treated with 10 μg Mφ-EV or not. (J,K) Representative fluorescence pictures of lipid peroxidation stained by BODIPY/C11 in MC38 (J) or B16 (K) cells pre-treated with 10 μg Mφ-EV or not. (LN) Flow cytometry analysis of erastin-induced lipid peroxidation in MC38 (L) or B16 (M) or CT26 (N) pre-treated with 10 μg Mφ-EV or not. Each point represents one of three independent experiments. Data were analyzed between RSL3-or erastin-treated samples with ANOVA and Dunnett's test, ∗p < 0.05, ∗∗p < 0.01, ∗∗∗p < 0.001. Column bars show mean and SD.
Fig. 3
Fig. 3
Macrophages upregulate glutathione metabolic pathways in cancer cells (A,B) Transcriptome analysis of the top 20 up-regulated KEGG enrichment pathways in MC38 sorted from the co-culture system without (A) or with (B) RSL3 treatment. (CE) Transcription changes of glutathione metabolism genes in MC38 (C), B16 (D) or CT26 (E) cells sorted from Mφ co-culture system. The statistical significance of the differences was assessed using the Student's t-test, ∗p < 0.05, ∗∗p < 0.01, ∗∗∗p < 0.001. Each point represents one of three independent experiments. Column bars show mean and SD. (F) Venn diagram of proteins numbers and overlap3ing proteins numbers from M1-EV and M2-EV by liquid chromatography-tandem mass spectrometry proteomic profiling. (G) Scatter diagram of overlaping proteins from M1-EV and M2-EV, and PRDX6 abundance. (H) PRDX6 expression in macrophages and Mφ-EV. The picture shows one of three representative experiments. Calnexin is presented as a positive marker for Mφ but a negative marker of EV. (I–N) Protein expression and quantification compared to β-actin of ACSL4, GPX4, xCT and PRDX6 in MC38 (I,L), B16 (J,M) or CT26 (K,N) cells from the macrophage (I–K) or Mφ-EV (LN) co-culture system with or without RSL3 treatment. We calculated the ratio of intensity of a given protein band to the intensity of beta-actin band, and treated the control lane (first lane in each immunoblotting) as intensity = 1. Data shown are from the representative experiment of three independent replicates.
Fig. 4
Fig. 4
Macrophages and Mφ-derived extracellular vesicles inhibit ferroptosis and promote PRDX6 expression in tumors (A) Timeline of clodronate liposome (CL) and RSL3 treatment for MC38 subcutaneous mouse model. (BD) Harvested tumors (B), individual tumor growth curves (C) and average tumor growth curves (D) of MC38 tumors collected from mice treated with vehicle, CL, RSL3 or combination of both compounds, N = 5 per group. (E,F) Quantified percentage (E) and representative flow cytometry scatter diagrams (F) of F4/80+ macrophages in CD45+ immune cells gate from MC38 tumors. (G,H) Quantification of lipid peroxidation (G) and representative flow cytometry scatter diagrams of BODIPY/C11 dye (H) in MC38 tumors. (I) Representative immunohistology images of GPX4, 4-HNE, PRDX6 and F4/80 expression in the tumor samples. (J) Timeline of treatment of MC38 tumor-bearing mice with M2 macrophages extracellular vesicles (M2-EV) and RSL3. (KM) Harvested tumor images (K), individual tumor growth curves (L) and tumor mean volume curves (M) of MC38 tumors collected from experiment shown in panel (J), N = 5 mice per group. (N,O) Quantified percentage (N) and representative flow cytometry scatter diagrams (O) of F4/80+ macrophages in CD45+ gate from MC38 tumors obtained from experiment (J). (P,Q) Quantified lipid peroxidation (P) and representative flow cytometry scatter diagrams of BODIPY/C11 dye (Q) of total cells from MC38 tumors. (R) Representative immunohistochemistry images of GPX4, 4-HNE, PRDX6 and F4/80 expression in the tumor samples from experiment depicted in panel (J). Data were analyzed with ANOVA and Tukey's comparing with each other group, ∗p < 0.05, ∗∗p < 0.01, ∗∗∗p < 0.001. Column error bars show mean and SD.
Fig. 5
Fig. 5
PRDX6-dependent ferroptosis resistance relies on glutathione peroxidase activity (A) Scheme of the enzyme activities of PRDX6 and the strategies to inhibit them. (BD) Flow cytometry analysis of RSL3-induced lipid peroxidation in B16 (B), CT26 (C) or MC38 (D) cells overexpressing (OE) PRDX6 versus negative control (NC) cells. The cells were treated with vehicle or 10 μM MJ33. (E) Diagram of PRDX6 overexpression plasmid and mutation site details of C47A, R132A and H39A mutant PRDX6. (F–K) Flow cytometry analysis of lipid peroxidation (F–H) and cell viability (I–K) in B16 (F,I), CT26 (G,J), MC38 (H,K) cells with PRDX6 knockdown. The cells were next transfected with wildtype (WT) or mutant PRDX6 (C47A, R132A, H39A) and treated with increasing concentrations of RSL3. Areas under the curve (AUC) were compared with one way ANOVA and Tukey's test, ∗p < 0.05, ∗∗p < 0.01, ∗∗∗p < 0.001. Column error bars show the mean and SD. (LN) Analysis of GSH/GSSG in B16 (L), CT26 (M) or MC38 (N) cells with the PRDX6 manipulations following RSL3 treatment. Data were analyzed between the same treatment samples with ANOVA and Dunnett's test, using WT PRDX6 as control, ∗p < 0.05, ∗∗p < 0.01, ∗∗∗p < 0.001. Column error bars show the mean and SD.
Fig. 6
Fig. 6
Cancer PRDX6 overexpression limits ferroptosis and reverses macrophage depletion effect (A-C) Tumor mean volume curves (A), harvested tumor image (B), and individual tumor growth curve (C) of MC38 tumors with PRDX6 overexpression (OE) or negative control (NC). The animals were treated with RSL3+PLX3397 (R + P) or vehicle. N = 5 per group. (D,E) Quantified percentage of F4/80+ macrophages in CD45+ gate (D) and representative flow cytometry scatter diagrams of F4/80+ macrophages (E) from MC38 tumors. (F,G) Quantified lipid peroxidation (F) and representative flow cytometry scatter diagrams of BODIPY/C11 dye (G) of total cells from MC38 tumors. (H) Representative immunohistochemistry images of PRDX6, 4-HNE and F4/80 expression in harvested tumor tissues. (I,J) Quantification of CD8+ and CD4+ T cells ratio (I) and representative flow cytometry scatter diagrams of CD8+ and CD4+ T cells (J) from MC38 tumors treatment. (KM) Tumor means volume curve (K), harvest tumor image (L) and individual tumor growth curve (M) of PRDX6 knockout (KO) and negative control (NC) MC38 tumors which are treated with single RSL3 (R) or RSL3+PLX3397 (R + P) or vehicle. n = 5 per group. (N,O) Quantified lipid peroxidation (N) and representative scatter diagrams of BODIPY/C11 dye (O) of MC38 tumors as indicated treatment. (P,Q) Quantified percentage (P) and representative flow cytometry scatter diagrams (Q) of F4/80+ macrophages in CD45+ immune cells from MC38 tumors as indicated. (R) Representative immunohistology images of 4-HNE, PRDX6 and F4/80 expression in the tumor slice of indicated six groups above. Data were analyzed with ANOVA and Tukey's comparing with each other group, ∗p < 0.05, ∗∗p < 0.01, ∗∗∗p < 0.001. Column error bars show mean and SD.
Fig. 7
Fig. 7
Macrophage extracellular vesicles and PRDX6 inhibited cancer cell mitophagy (A,B) Volcano plot (A) and quantification (B) of phosphorylated proteins in MC38 treated with M2-EV for 8h versus not treated MC38 cells. Data are merged from 3 independent experiments. (C) Top 10 up- and down-regulated KEGG pathways of M2-EV treated MC38 cells vs not treated controls. (D) Significantly down-regulated phosphorylated proteins in the mitophagy-animal term from panel (C). (E,F) Representative pictures of mitophagy, lysosome, and mitochondria fluorescence in M2-EV treated MC38 cells (E) or PRDX6 overexpressed (PRDX6 OE/OE) MC38 cells (F) treated with vehicle or RSL3. (G) SQSTM1, BNIP3, BNIP3L expression in PRDX6 KO or NC MC38 cells which treated with RSL3 or MitoTempo. Data shown are from the representative experiment of three independent replicates. (H) Representative morphology of mitochondria and mitophagy in negative control MC38 cells and PRDX6 knockdown (PRDX6 KD) MC38, PRDX6 OE MC38, M2-EV-treated or 100 μM MitoTempo-treated MC38 cells cultured with 2 μM RSL3. Data shown are from the representative replicate of three independent experiments.

Similar articles

References

    1. Dixon Scott J., et al. Ferroptosis: an iron-dependent form of nonapoptotic cell death. Cell. 2012;149(5):1060–1072. - PMC - PubMed
    1. Yang W.S., et al. Peroxidation of polyunsaturated fatty acids by lipoxygenases drives ferroptosis. Proc. Natl. Acad. Sci. 2016;113(34):E4966–E4975. - PMC - PubMed
    1. Lei G., Zhuang L., Gan B. Targeting ferroptosis as a vulnerability in cancer. Nat. Rev. Cancer. 2022;22(7):381–396. - PMC - PubMed
    1. Liu K., et al. Ferroptosis: the entanglement between traditional drugs and nanodrugs in tumor therapy. Adv. Healthcare Mater. 2023;12(12) - PubMed
    1. Roh J.-L., et al. Induction of ferroptotic cell death for overcoming cisplatin resistance of head and neck cancer. Cancer Lett. 2016;381(1):96–103. - PubMed

LinkOut - more resources