. 2025 Aug 18;8(10):e202402820.
doi: 10.26508/lsa.202402820. Print 2025 Oct.

Dysregulated SASS6 expression promotes increased ciliogenesis and cell invasion phenotypes

Affiliations

Dysregulated SASS6 expression promotes increased ciliogenesis and cell invasion phenotypes

Eleanor Hargreaves et al. Life Sci Alliance. .

Abstract

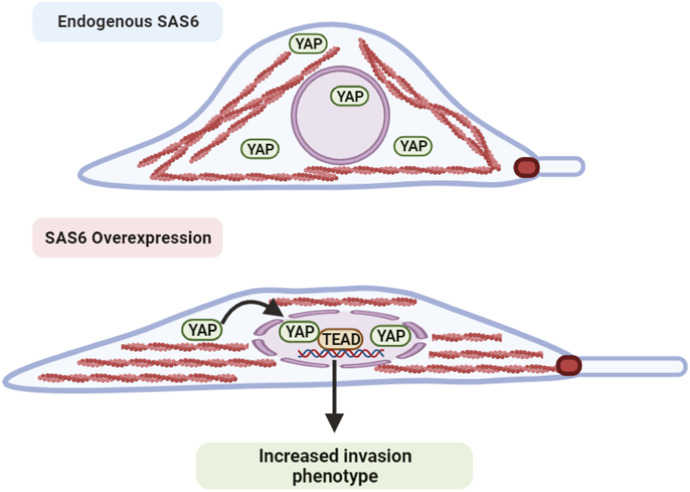
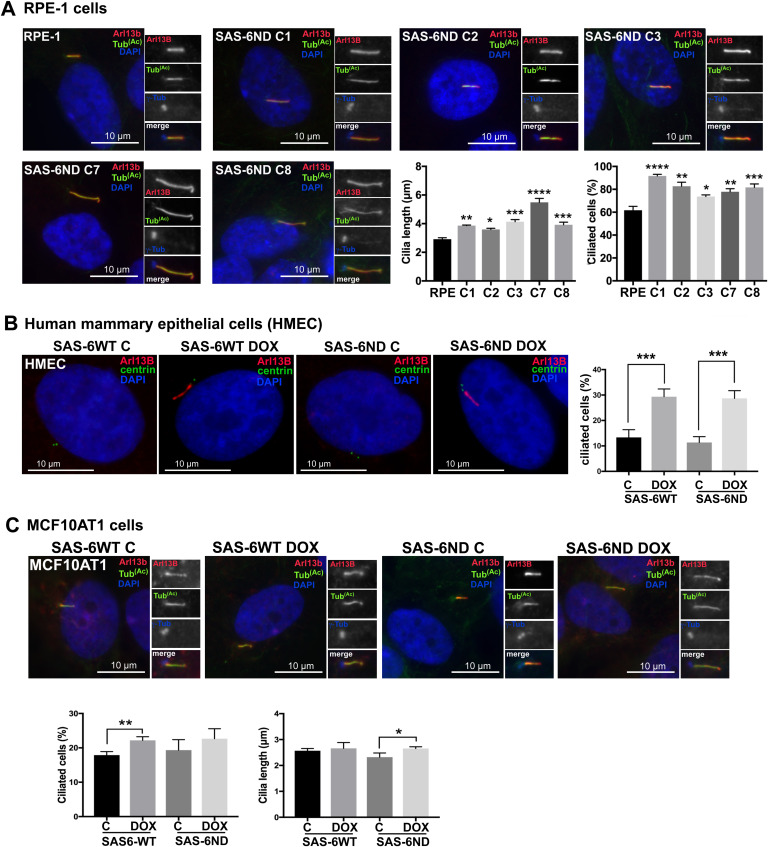
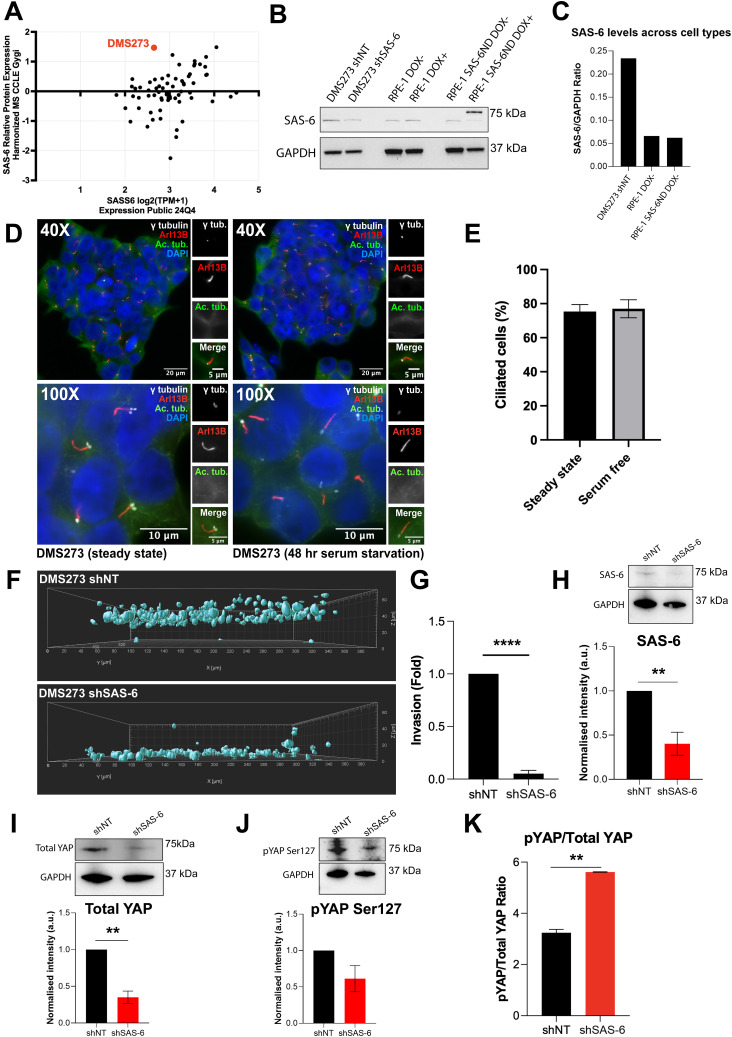
Centriole and/or cilium defects are characteristic of cancer cells and have been linked to cancer cell invasion. However, the mechanistic bases of this regulation remain incompletely understood. Spindle assembly abnormal protein 6 homolog (SAS-6) is essential for centriole biogenesis and cilium formation. SAS-6 levels decrease at the end of mitosis and G1, resulting from APCCdh1-targeted degradation. To examine the biological consequences of unrestrained SAS-6 expression, we used a nondegradable SAS-6 mutant (SAS-6ND). This led to an increase in ciliation and cell invasion and caused an up-regulation of the YAP/TAZ pathway. SAS-6ND expression resulted in cell morphology changes, nuclear deformation, and YAP translocation to the nucleus, resulting in increased TEAD-dependent transcription. SAS-6-mediated invasion was prevented by YAP down-regulation or by blocking ciliogenesis. Similarly, down-regulation of SAS-6 in DMS273, a highly invasive and highly ciliated lung cancer cell line that overexpresses SAS-6, completely blocked cell invasion and depleted YAP protein levels. Thus, our data provide evidence for a defined role of SAS-6 in cell invasion through the activation of the YAP/TAZ pathway.


Conflict of interest statement

The authors declare that they have no conflict of interest.

Figures

None
Graphical abstract
Figure 1.
Figure 1.. Nondegradable SAS-6 (SAS-6ND) is stable throughout the cell cycle and promotes increased ciliogenesis.
(A) SAS-6 protein structure showing a stretch of human SAS-6 protein and the conserved KEN box (shown in red). hSAS-6ND was generated by replacing the KEN box with an alanine stretch (red). (B) Western blot showing the expression of SAS-6ND (top) with alpha tubulin as a loading control. (C) Endogenous SAS-6 expression at different cell cycle stages (indicated). RPE-1 cells expressing GFP-centrin (green), stained with an antibody for endogenous SAS-6 (red). DNA is marked with DAPI (blue). Note that endogenous SAS-6 is absent in G1. (D) Nondegradable SAS-6 (SAS-6ND) expression throughout the cell cycle. Centrin-GFP is shown in green, and Myc-tagged SAS-6ND (9E10-antibody) is shown in red. DAPI is shown in blue. (E) SAS-6ND expression in ciliated cells. The primary cilium is marked with Arl13B (red in the main panel, blue in the inset). Centrin-GFP is shown in green, and Myc-tagged SAS-6ND is shown in red. DAPI is shown in blue. An inset with both the mother centriole (basal body) and the daughter centriole is shown, with a cartoon depicting SAS-6 localization (right). D stands for distal and P for proximal. (F) Ciliation in control cells and cells expressing SAS-6ND. A quantification of cilium length is shown in the right panel. t test, P < 0.0001. Note the increase in cilium length in the presence of SAS-6ND. (G) Quantification of cilia number in control cells and cells expressing SAS-6ND. t test, P < 0.001. Data are representative of five independent experiments.
Figure S1.
Figure S1.. SAS-6 ND promotes increased ciliogenesis in RPE-1 cells, HMECs, and MCF10AT1 cells.
(A) Ciliation in control RPE-1 cells and different clones of cells overexpressing the SAS-6ND mutant (indicated as C1, C2, C3, C7, and C8). Cells were treated with doxycycline (1 μg/ml) to induce expression. Cilia are marked with Arl13B (red) and acetylated tubulin (green). The centrosome is labeled with γ-tubulin (blue). DNA is marked with DAPI in blue (indicated). t test significance for one-way ANOVA is indicated (∗P < 0.05, ∗∗P < 0.01, ∗∗∗P < 0.001, ∗∗∗∗P < 0.0001). (B) Ciliation in human mammary epithelial cells overexpressing SAS-6. Cells were transduced with a stable Tet-inducible vector for either WT or nondegradable SAS-6ND. Cells were treated with vehicle or doxycycline as indicated (1 μg/ml). Cilia are marked with Arl13B (red), centrin is shown in green, and DNA is stained with DAPI (blue). A quantification of ciliation (percent) is shown on the right-hand side. t test, P < 0.001. (C) Ciliation in MCF10AT1 cells overexpressing SAS-6. (B) Cells were transduced as in (B) and subjected to doxycycline treatment or control. Cilia are marked with Arl13B (red) and acetylated tubulin (green). The centrosome is labeled with γ-tubulin (blue). DNA is marked with DAPI (indicated). A quantification of ciliated cells and cilium length is shown in the panels below. t test, P < 0.01 and P < 0.05 (shown).
Figure S2.
Figure S2.. SAS-6 overexpression does not induce centrosome amplification.
(A) Representative images of RPE-1 and RPE-1 SAS-6ND cells both treated with or without 1 μg/ml doxycycline for 6 d. Cells expressing centrin-GFP (green) were stained for cilia with acetylated tubulin (white) and CP110 (red). DNA is marked with DAPI (blue). (B) Quantification of centrin foci in RPE-1 and RPE-1 SAS-6ND cells treated with or without 1 μg/ml doxycycline. Data are representative of three repeats. Error bars represent the SD. Two-way ANOVA (P > 0.05). (C) Quantification of CP110 foci in RPE-1 and RPE-1 SAS-6ND cells treated with or without 1 μg/ml doxycycline. Data are representative of three repeats. Error bars represent the SD. Two-way ANOVA, P > 0.05.
Figure S3.
Figure S3.. Doxycycline treatment induces increased cilium number and length in SAS-6ND cells.
(A) Representative images of RPE-1 and RPE-1 SAS-6ND cells treated with 1 μg/ml doxycycline for 3 or 6 d. Cells are stained for cilia with acetylated tubulin (white) and Arl13B (red). Centrioles are labeled with GFP-centrin (green). DNA is marked with DAPI (blue). (B) Quantification of the cilium number in RPE-1 and RPE-1 SAS-6ND cells treated with 1 μg/ml doxycycline for 3 or 6 d. Data are representative of three repeats. Error bars represent the SD. t test, *P < 0.05. (C) Quantification of the cilium length in RPE-1 and RPE-1 SAS-6ND cells treated with 1 μg/ml doxycycline for 3 or 6 d. Data are representative of three repeats. Error bars represent the SD. Two-way ANOVA, **P < 0.01.
Figure S4.
Figure S4.. SASS6 overexpression correlates with poor prognosis.
(A, B, C, D) TCGA analysis. Kaplan–Meier curves of patient survival probability (OS) correlated to high SASS6 expression over time (years). High expression is indicated in red and low expression in black. The number of patients remaining in each category (low versus high) is shown below the graph. HR indicates hazard ratio, which measures the risk of having SASS6 overexpression compared with the low-expressing group. An HR higher than 1 indicates high risk. (A, B, C, D) P-values are shown. Shown are analyses done in TCGA adrenocortical carcinoma (A), low-grade glioma (B), renal papillary cell carcinoma (C), and hepatocellular carcinoma (D) cohorts. (E) Table summarizing TCGA data analysis. CI95L, CI95U. P-values and total patient numbers (n) are shown. Note that our analysis also confirmed previous results in kidney renal clear cell carcinoma and lung adenocarcinoma.
Figure 2.
Figure 2.. SAS-6 overexpression leads to invasion that depends on the presence of cilia.
(A) Cell protrusion assay in RPE-1 cells transduced with tetracycline-inducible SAS-6ND. Confocal image of cell protrusions in 3-μm transwell filters for three different SAS-6ND–overexpressing clones (indicated). Panels show representative images of the top and the bottom of the filter. A control, non–doxycycline-treated condition is shown. The actin cytoskeleton is marked with phalloidin (red). DAPI marks DNA (blue). Scale bar, 10 μm. A Western blot with the levels of Myc-tagged SAS-6ND expression is shown on the top right. α-Tubulin is used as a loading control. The graph shows the quantification of cell protrusions in the presence of SAS-6ND. Error bars represent the SD. t test is indicated, ∗∗∗P < 0.001. (B) Collagen invasion assay in SAS-6ND–overexpressing RPE-1 cells. Panels show confocal images at 5 and 40 micron. Actin is shown in red, and DNA is marked with Hoechst in blue. Scale bar, 20 μm. A Western blot with SAS-6ND levels is shown on the top right, and GAPDH is used as a loading control. A quantification of invasion is shown in the lower right. t test, ∗∗∗P < 0.001. Data are representative of four independent experiments. (C) Collagen invasion assay in MCF10AT1 cells, overexpressing either SAS-6WT or SAS-6ND (indicated). A Western blot with the expression of the Myc-tagged construct is shown (lower panels) with a c-Myc Western blot and α-tubulin loading control (indicated). t test, ∗∗P < 0.01, ∗∗∗∗P < 0.0001. Data are representative of two independent experiments with four replicas. (B, D) Collagen invasion assay in RPE-1 cells as shown in (B), upon down-regulation of SCLT1, a protein required to form cilia. The invasion index is shown on the right. Error bars represent the SD. t test is indicated, ∗∗∗∗P < 0.001. Data are representative of two independent experiments with four replicas. Western blots show the levels of Myc-tagged SAS-6ND and SCLT1 levels (indicated). α-Tubulin is used as a loading control.
Figure S5.
Figure S5.. SCLT1 knockdown does not impact the cell cycle profile.
RPE-1 and RPE-1 SAS-6ND cells transfected with control siRNA (siNT) or siRNA targeting SCLT1 (siSCLT1) were seeded at equal density. After 48 h, cells were fixed and stained with propidium iodide (PI) and their cell cycle profiles were assessed via flow cytometry.
Figure S6.
Figure S6.. SCLT1 knockdown reduces primary cilia but does not affect centrosome amplification.
(A) RPE-1 and RPE-1 SAS-6ND cells transfected with control siRNA (siNT) or siRNA targeting SCLT1 (siSCLT1) were lysed and analyzed for the expression of SAS-6ND and SCLT1 by Western blot. Vinculin was used as a loading control. The quantification of protein levels relative to the loading control is shown. Data are representative of two independent repeats. Error bars represent the SD. Two-way ANOVA, *P < 0.05, **P < 0.01. (B) Representative images of RPE-1 and RPE-1 SAS-6ND cells transfected with control siRNA or SCLT1 siRNA (indicated). Cilia are marked with acetylated tubulin (white), centrioles are marked with centrin-GFP (green), and CP110 is shown in red. DNA is marked with DAPI (blue). (C, D) Quantification of centrin foci (C) or CP110 foci (D) in RPE-1 and RPE-1 SAS-6ND cells transfected with siRNA control (siNT) or siRNA for SCLT1 (siSCLT1). Data are representative of three independent repeats. Error bars represent the SD. Two-way ANOVA, *P < 0.05, **P < 0.01. (E, F) Representative images of ciliation in SCLT1 knockdown cells with the corresponding controls (indicated). (F) Quantification is shown in (F). Data are representative of three independent repeats. Error bars represent the SD. Two-way ANOVA, ****P < 0.0001. (G) Quantification of cilium length for three independent experiments is shown in (G). Error bars represent the SD. Two-way ANOVA, *P < 0.05, **P < 0.01.
Figure 3.
Figure 3.. SAS-6 invasion phenotype is associated with the activation of the YAP/TAZ pathway.
(A) Gene set enrichment analysis of microarray data. Normalized enrichment score, nominal P-value (NOM pval), and false discovery rate q-value (FDR qval) are shown for each indicated gene set. Data are representative of two independent experiments. (B) Enrichment plot for the dataset “TEAD DEPENDENT YAP TARGET GENES COMMON BETWEEN YAP AND TAZ” showing an enrichment score curve. Normalized enrichment score: 1.65291. (C) Heat map with the list of genes driving the change. Note the increase in YAP downstream targets CTGF and CYR61. (D) qRT-PCR showing the mRNA levels of YAP/TAZ target genes, CTGF (t test, P < 0.05) (left) and CYR61 (t test, P < 0.05) (right). Ct values were normalized to GAPDH, and expression was calculated as a fold change relative to controls. Data represent the mean ± SEM of three independent experiments performed in triplicate. (E) Western blot showing the expression of SAS-6ND with and without doxycycline (indicated). (F) Immunostaining for YAP in cells transduced with SAS-6ND, treated with vehicle control (top) or doxycycline (lower panels). Note the increase in nuclear YAP in cells overexpressing SAS-6ND. Scale bar, 10 μm. (G) Quantification of the nuclear/cytoplasmic ratio in control cells (SAS-6ND, -dox) and cells overexpressing SAS-6ND (+dox). t test, P < 0.001. Note that SAS-6ND–overexpressing cells have increased nuclear YAP. (H) Tukey’s boxplots showing luciferase activity of YAP reporter 8xGTIIC-luc (Firefly/Renilla) indicative of YAP/TAZ activation in control or cells induced with doxycycline to express SAS-6ND (t test, P < 0.05). (I) Western blot showing YAP protein levels upon treatment with vehicle control or verteporfin (10 μg/ml) in control cells or doxycycline-induced cells expressing SAS-6ND (indicated). A quantification for three independent experiments is shown below. (J) Collagen invasion assay in control or doxycycline-induced cells expressing SAS-6ND upon treatment with verteporfin (10 μg/ml). N = 4 experiments.
Figure S7.
Figure S7.. SAS-6 overexpression promotes YAP/TAZ pathway activation.
(A) Immunostaining for YAP in human mammary epithelial cells (HMECs) transduced with SAS-6WT, treated with vehicle control (top) or doxycycline (lower panels). Note the increase in nuclear YAP in cells overexpressing SAS-6. Quantification is shown on the right, P < 0.05. Scale bar, 10 μm. (B) Immunostaining for YAP in human mammary epithelial cells transduced with SAS-6ND, treated with vehicle control (top) or doxycycline (lower panels). Note the increase in nuclear YAP in cells overexpressing SAS-6. Quantification is shown on the right, P < 0.05. Scale bar, 10 μm. (A, B, C) Western blot showing SAS-6 overexpression for (A) and (B). Myc-tagged SAS-6 is detected with 9E10 antibody (indicated), and a loading control of α-tubulin is shown (lower panel). (D) TEAD-dependent transcription in RPE-1 cells. Tukey’s boxplots showing luciferase activity of YAP reporter 8xGTIIC-luc (Firefly/Renilla) indicative of YAP/TAZ activation in control cells or cells induced with doxycycline to express SAS-6ND (t test, P < 0.05).
Figure S8.
Figure S8.. SAS-6 overexpression promotes nuclear YAP accumulation.
(A) Representative images of RPE-1 cells treated with or without 1 μg/ml doxycycline for 6 d and then stained for YAP (red). DNA is marked with DAPI (blue). (B) Quantification of the nuclear/cytoplasmic ratio of YAP in RPE-1 cells with or without doxycycline treatment, presented as a fold change of the control (−Dox). Data are representative of three independent repeats. Error bars represent the SD. t test, P > 0.05. (C) Representative images of RPE-1 SAS-6ND cells treated with or without 1 μg/ml doxycycline for 6 d and then stained for YAP (red). DNA is marked with DAPI (blue). (D) Quantification of the nuclear/cytoplasmic ratio of YAP in RPE-1 SAS-6ND cells with or without doxycycline treatment, presented as a fold change of the control (−Dox). Data are representative of three independent repeats. Error bars represent the SD. t test, *P < 0.05.
Figure S9.
Figure S9.. YAP depletion blocks SAS-6ND–mediated invasion.
(A) Representative images from a collagen invasion assay. Cells were allowed to invade into a collagen matrix for 24 h, followed by fixation with PFA containing DAPI to stain nuclei. Images display rendered nuclear masks with their respective Z-positions and corresponding invasion fold quantification. Data are based on three biological replicates, each with three technical replicates. Images were analyzed using Imaris. (B) Quantification is shown in (B). (C) Western blots showing total YAP, pYAP (Ser127), and SAS-6 levels after YAP knockdown using siRNA. GAPDH is used as a loading control (indicated). (D, E, F, G) Densitometric quantifications are shown for SAS-6 (D), total YAP (E), phospho-YAP serine 127 (F), and the ratio of phospho-YAP to total YAP (G). All error bars represent the SD of the mean from three independent biological replicates. (H, I) Graphs showing nuclear sphericity (H) and nuclear height (I) in Z after SAS-6 overexpression and/or YAP knockdown. Data are based on three biological replicates. t test, P < 0.0001.
Figure 4.
Figure 4.. Cell invasion is sensitive to SAS-6 depletion in a lung cancer cell line.
(A) Plot showing SASS6 expression from RNA-seq data (DepMap Public 24Q4, log2[TPM+1]) versus SAS-6 relative protein expression (Harmonized MS CCLE Gygi), filtered by lung cancer. DMS273 is highlighted in red. (B, C) Western blot analysis showing SAS-6 expression across different cell types with densitometric quantification of SAS-6 relative to GAPDH for each cell line (shown in (C)). (D) Representative images of DMS273 cells grown in steady-state and serum-free conditions, taken at 40X and 100X. Cells are stained for cilium markers Arl13B (red) and acetylated tubulin (green). Centrioles are marked with γ-tubulin (white) and DNA with DAPI (blue). (E) Quantification of cilia (percent) in DMS273 cells grown in complete medium (steady state) or serum starved for 48 h (serum-free). Data are representative of three biological repeats. Error bars represent the SD. t test, P > 0.05. (F) Representative images from a collagen invasion assay in DMS273 cells transduced with nontargeting shRNA or SAS-6 shRNA (indicated). Cells were allowed to invade into a collagen matrix for 24 h, followed by fixation with PFA containing DAPI to stain nuclei. Images display rendered nuclear masks with their respective Z-positions and corresponding invasion fold quantification. Data are based on three biological replicates, each with three technical replicates. Images were analyzed using Imaris. (G) Quantification is shown in (G). (H, I, J) Representative Western blots and densitometric quantifications are shown for SAS-6 (H), total YAP (I), and phospho-YAP serine 127 (pYAP Ser127) (J). (K) Ratio of pYAP to total YAP for the experiments shown. All error bars represent the SD of the mean from three independent biological replicates. t test, *P < 0.05 or **P < 0.01 is indicated.
Figure 5.
Figure 5.. SAS-6 promotes actin cytoskeleton changes and cell flattening.
(A) Actin cytoskeleton staining in uninduced cells (control) or cells expressing SAS-6ND (indicated). Phalloidin-rhodamine is shown in orange. DNA is marked with DAPI (blue). (A, B) Actin alignment analysis showing cells from inset selection in (A). The hue is related to the orientation, and the saturation is coding for coherency. Note more aligned pixels and higher coherency values in cells overexpressing SAS-6ND (right panel). (C) Actin alignment quantification with CellProfiler shows increased alignment in SAS-6ND–expressing cells. Data are representative of 6 independent experiments. (D) Three-dimensional rendering of cells overexpressing SAS-6ND. Cross section is shown where SAS-6ND–expressing cells show decreased nuclear height. (D, E) Quantification of the nuclear aspect ratio for cells shown in (D), as a ratio of the vertical to horizontal axis of the nucleus. Data are representative of three independent experiments. (F, G, H) CellProfiler quantifications show a significant decrease in nuclear solidity (as a ratio of the nuclear area/convex hull area) (F), and nuclear form factor (as a ratio of the area/perimeter) (G), and a concomitant increase in nuclear compactness (H), in SAS-6ND cells. t test, P < 0.05 for all graphs is shown. Data are representative of six independent experiments. (I) Schema of SAS-6 effects on the actin cytoskeleton, YAP/TAZ pathway, and cell invasion.

References

    1. Adams SD, Csere J, D’Angelo G, Carter EP, Romao M, Arnandis T, Dodel M, Kocher HM, Grose R, Raposo G, et al. (2021) Centrosome amplification mediates small extracellular vesicle secretion via lysosome disruption. Curr Biol 31: 1403–1416.e7. 10.1016/j.cub.2021.01.028 - DOI - PMC - PubMed
    1. Arquint C, Nigg EA (2016) The PLK4-STIL-SAS-6 module at the core of centriole duplication. Biochem Soc Trans 44: 1253–1263. 10.1042/BST20160116 - DOI - PMC - PubMed
    1. Bergwell M, Smith A, Smith E, Dierlam C, Duran R, Haastrup E, Napier-Jameson R, Seidel R, Potter W, Norris A, et al. (2023) A primary microcephaly-associated sas-6 mutation perturbs centrosome duplication, dendrite morphogenesis, and ciliogenesis in Caenorhabditis elegans. Genetics 224: iyad105. 10.1093/genetics/iyad105 - DOI - PMC - PubMed
    1. Bettencourt-Dias M, Hildebrandt F, Pellman D, Woods G, Godinho SA (2011) Centrosomes and cilia in human disease. Trends Genet 27: 307–315. 10.1016/j.tig.2011.05.004 - DOI - PMC - PubMed
    1. Brodowska K, Al-Moujahed A, Marmalidou A, Meyer Zu Horste M, Cichy J, Miller JW, Gragoudas E, Vavvas DG (2014) The clinically used photosensitizer Verteporfin (VP) inhibits YAP-TEAD and human retinoblastoma cell growth in vitro without light activation. Exp Eye Res 124: 67–73. 10.1016/j.exer.2014.04.011 - DOI - PMC - PubMed

MeSH terms

LinkOut - more resources