. 2025 Aug 18;15(1):289.
doi: 10.1038/s41398-025-03514-0.

Multivariate genome-wide association analysis of dyslexia and quantitative reading skill improves gene discovery

Collaborators, Affiliations

Multivariate genome-wide association analysis of dyslexia and quantitative reading skill improves gene discovery

Hayley S Mountford et al. Transl Psychiatry. .

Abstract

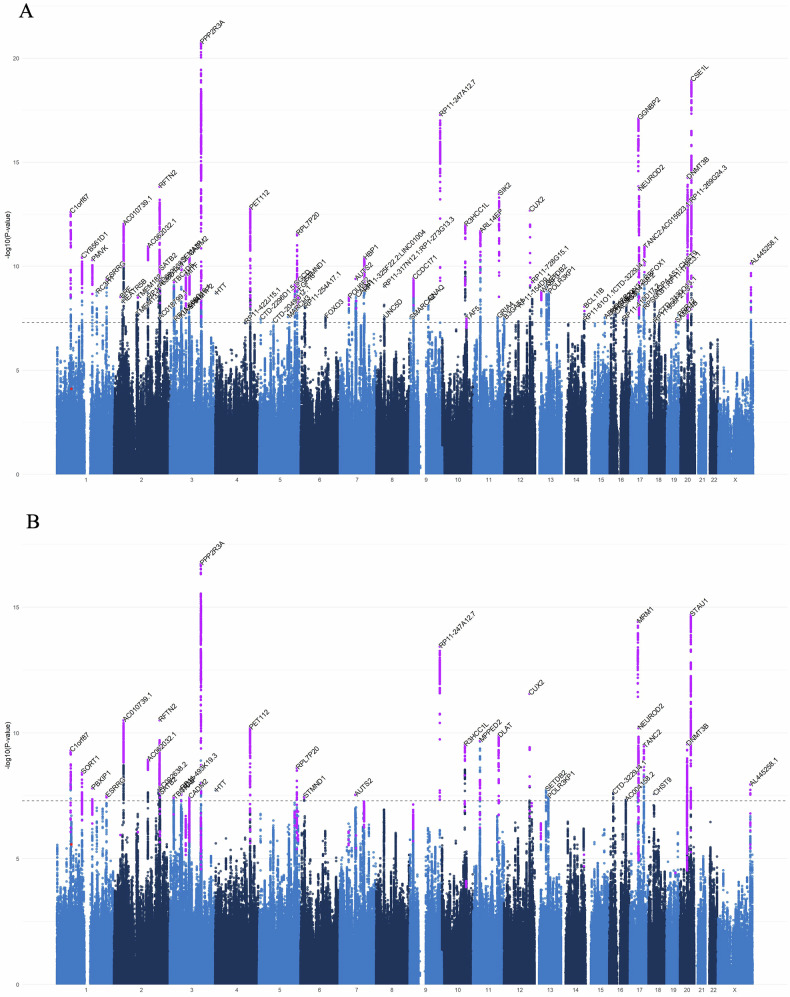
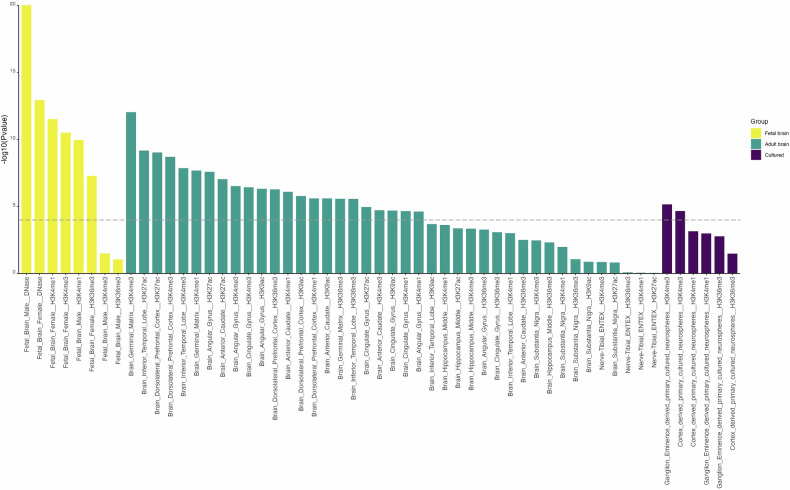
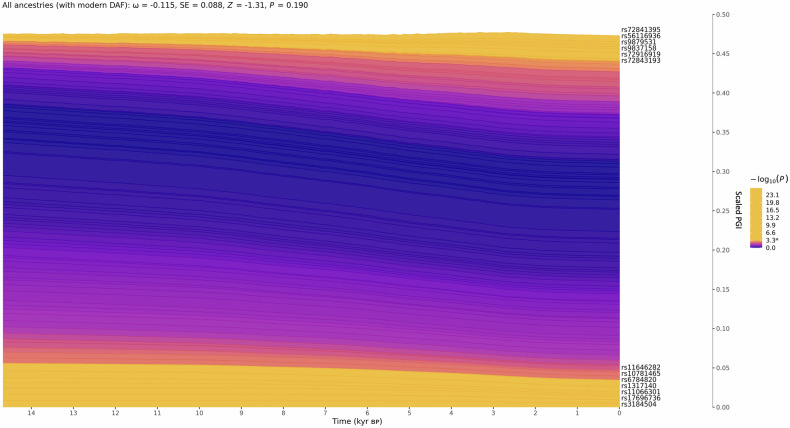
The ability to read is an important life skill and a major route to education. Dyslexia, characterized by difficulties with accurate/ fluent word reading, and poor spelling is influenced by genetic variation, with a twin study heritability estimate of 0.4-0.6. Until recently, genomic investigations were limited by modest sample size. We used a multivariate genome-wide association study (GWAS) method, MTAG, to leverage summary statistics from two independent GWAS efforts, boosting power for analyses of dyslexia; the GenLang meta-analysis of word reading (N = 27,180) and the 23andMe, Inc., study of dyslexia (Ncases = 51,800, Ncontrols = 1,087,070). We increased the effective sample size to 1,228,832 participants, representing the largest genetic study of reading-related phenotypes to date. Our analyses identified 80 independent genome-wide significant loci, including 36 regions which were not previously reported as significant. Of these 36 loci, 13 were novel regions with no prior association with dyslexia. We observed clear genetic correlations with cognitive and educational measures. Gene-set analyses revealed significant enrichment of dyslexia-associated genes in four neuronal biological process pathways, and findings were further supported by enrichment of neuronally expressed genes in the developing embryonic brain. Polygenic index analysis of our multivariate results predicted between 2.34-4.73% of variance in reading traits in an independent sample, the National Child Development Study cohort (N = 6410). Polygenic adaptation was examined using a large panel of ancient genomes spanning the last ~15 k years. We did not find evidence of selection, suggesting that dyslexia has not been subject to recent selection pressure in Europeans. By combining existing datasets to improve statistical power, these results provide novel insights into the biology of dyslexia.


Conflict of interest statement

Competing interests: PF, AA and the 23andMe Research Team are employed by and hold stock or stock options in 23andMe, Inc. All other authors declare no conflicts of interest. Ethics approval and consent to participate: The study made use of existing data sets with all original studies stating relevant ethical approval and informed consent from participants. Ethical approval for this study was granted by the University of Edinburgh School of Philosophy, Psychology and Language Sciences research ethics committee (PPLSREC 29-1819/8), and was carried out in accordance with the principles of the Declaration of Helsinki.

Figures

Fig. 1
Fig. 1. Regions associated with dyslexia and reading ability.
Manhattan plot of the multivariate GWAS of A dyslexia and B reading ability. The y axis indicates the -log10 P value for association. The threshold for genome-wide significance (P < 5 × 10−8) is represented by a dashed grey line. Significant loci that were previously reported in the GenLang word reading GWAS [9] are represented in red, and those reported in the dyslexia GWAS [11] are shown in purple.
Fig. 2
Fig. 2. Genetic correlations of dyslexia with selected relevant phenotypes.
Significant (P ≤ 1.77 × 10−5) genetic correlations (rg) between multivariate analysis of dyslexia and other selected phenotypes. UKBB UK Biobank, MVP Million Veterans Program, MVP EUR Million Veterans Program Europeans, GLIDE Gene-Lifestyle Interactions in Dental Endpoints, SSGAC Social Science Genetic Association Consortium, PGC Psychiatric Genetics Consortium.
Fig. 3
Fig. 3. Analysis of expression patterns of dyslexia-associated genes in the developing human brain.
MAGMA gene property analyses of dyslexia associated genes with single cell gene expression data from A embryonic ventral midbrain from 6–11 post conception weeks (pcw), B embryonic prefrontal cortex from 8–26 post conception/ gestational weeks (GW), C human fetal and adult cortex. DA0-1 dopaminergic neurons, Endo endothelial cells, Gaba GABAergic neurons, Mgl microglia, NbGaba neuroblast GABAergic, NbM medial neuroblast, NbML1-5 mediolateral neuroblasts, NProg neuronal progenitor, OMTN oculomotor and trochlear nucleus, OPC oligodendrocyte precursor cells, Peric pericytes, ProgBP progenitor basal plate, ProgFPL progenitor medial floorplate, ProgM progenitor midline, Rgl1-3 radial glia-like cells, RN red nucleus, Sert serotonergic.
Fig. 4
Fig. 4. Partitioned heritability enrichment analysis of chromatin signatures.
SNP-based heritability of the multivariate dyslexia GWAS is significantly enriched in brain enhancers, promoters and transcribed regions. 489 annotation of tissue-specific chromatin signatures were used to analyze the GWAS results with LDSC heritability partitioning. Only brain-related annotations are shown. P values are plotted on the y axis as -log10.
Fig. 5
Fig. 5. No evidence for directional selection of dyslexia associated SNPs.
Stacked line plot of the ancient ancestry PALM analysis, showing the contribution of SNPs to dyslexia over time. SNPs are shown as stacked lines, the width of each line being proportional to the population frequency of the positive effect allele, weighted by its effect size. When a line widens over time the positive effect allele has increased in frequency, and vice versa. SNPs are sorted by the magnitude and direction of selection, with positively selected SNPs at the top, negatively selected SNPs at the bottom, and neutral SNPs in the middle. SNPs are colored by their corresponding P-value in a single locus selection test. The asterisk on the scale bar marks the Bonferroni corrected significance threshold, and nominally significant SNPs are shown in yellow and labelled by their rsIDs. The Y-axis shows the scaled average polygenic index (PGI) in the population, ranging from 0 to 1, with 1 corresponding to the maximum possible average PGI (i.e. when all individuals in the population are homozygous for all positive effect alleles) and the X-axis shows time in units of thousands of years before present (kyr BP).

References

    1. Ritchie SJ, Bates TC. Enduring links from childhood mathematics and reading achievement to adult socioeconomic status. Psychol Sci. 2013;24:1301–8. - PubMed
    1. Pennington BF, Bishop DV. Relations among speech, language, and reading disorders. Annu Rev Psychol. 2009;60:283–306. - PubMed
    1. Protopapas A. Evolving concepts of dyslexia and their implications for research and remediation. Front Psychol. 2019;10:2873. - PMC - PubMed
    1. Snowling MJ, Melby-Lervag M. Oral language deficits in familial dyslexia: a meta-analysis and review. Psychol Bull. 2016;142:498–545. - PMC - PubMed
    1. Gialluisi A, Andlauer TFM, Mirza-Schreiber N, Moll K, Becker J, Hoffmann P, et al. Genome-wide association study reveals new insights into the heritability and genetic correlates of developmental dyslexia. Mol Psychiatry. 2021;26:3004–17. - PMC - PubMed

LinkOut - more resources