Clinical Trial
. 2025 Aug 18;16(1):7690.
doi: 10.1038/s41467-025-63031-y.

Investigational eIF2B activator DNL343 modulates the integrated stress response in preclinical models of TDP-43 pathology and individuals with ALS in a randomized clinical trial

Affiliations
Clinical Trial

Investigational eIF2B activator DNL343 modulates the integrated stress response in preclinical models of TDP-43 pathology and individuals with ALS in a randomized clinical trial

Brittany N Flores et al. Nat Commun. .

Abstract

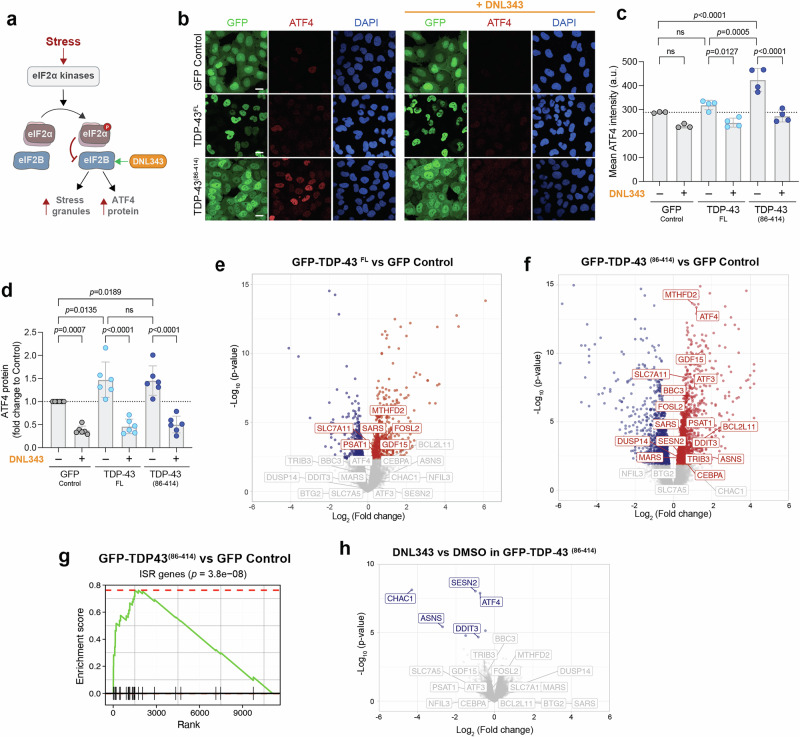
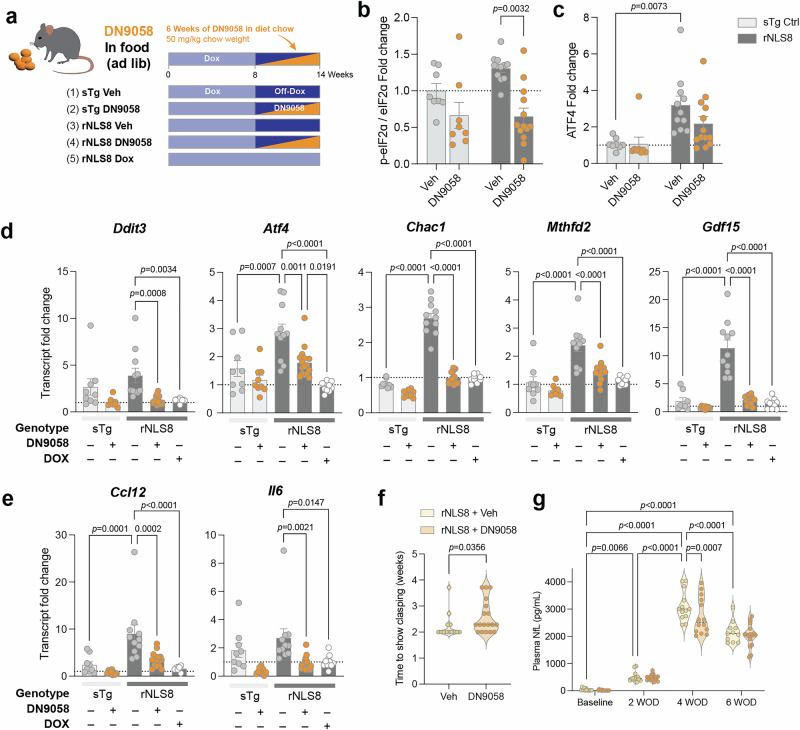
Neuronal TDP-43 aggregates are a hallmark ALS pathology. The integrated stress response (ISR) occurs downstream of TDP-43 pathology and may promote neurodegeneration. Here we demonstrate that a CNS penetrant small molecule eIF2B activator inhibits the ISR in cellular models of ALS and the brain of an inducible mouse model of TDP-43 pathology, where it transiently slowed progression of locomotor deficits and neurodegeneration. ISR activation was observed in ALS patient spinal cord and CSF. The investigational drug DNL343 was advanced into Phase 1 and Phase 1b randomized, double-blind, placebo-controlled trials in healthy and ALS participants, respectively (NCT04268784/NCT05006352); the primary objective in both studies was to investigate the safety and tolerability DNL343. DNL343 demonstrated a half-life supporting once-daily dosing and showed extensive CSF distribution. DNL343 was generally well tolerated and reduced ISR biomarkers in peripheral blood mononuclear cells and CSF of ALS participants. Therefore, DNL343 is a useful investigational drug to explore the effects of ISR inhibition in ALS models and individuals with neurological diseases.


Conflict of interest statement

Competing interests: SBY, IVC, RDM, RMT, AB, SB, MEKC, MYC, MF, FH, MO, KS, CLH, TM, SD, AAE, DJ, CH, GDP, MDT and JWL are current employees and shareholders of Denali Therapeutics. BNF, MHF, LDS, SKD, WD, CX, and KS-L, EY, and LAK are former employees of Denali Therapeutics. MV, LS, GJG. have appointments at CHDR. LS, GJG have appointments at LUMC. TB and LvB. have appointments at UMCU. LHvdB served in advisory boards for Biogen, Amylyx, Ferrer, Corcept, QurAlis, Cytokinetics, Argenx, VectorY, Zambon paid to institution. LHvdB has participated as principal investigator to clinical trials on ALS sponsored by Biogen, Cytokinetics, Ferrer, Amylyx, Wave Life Sciences, Corcept therapeutics, Sanofi, AB Science, IONIS Pharmaceuticals, Apellis Pharmaceuticals, Alexion Pharmaceuticals, Orphazyme, Orion Pharma and Denali. GWY is a co-founder, member of the Board of Directors, on the SAB, equity holder, and paid consultant for Eclipse BioInnovations. GWY is a visiting professor at the National University of Singapore. GWY’s interests have been reviewed and approved by the University of California, San Diego in accordance with its conflict-of-interest policies. The aforementioned authors declare no other competing financial and non-financial interests. The remaining authors declare no competing interests. DNL343 is an investigational drug that has not been approved by any Health Authority.

Figures

Fig. 1
Fig. 1. TDP-43 pathologies activate the ISR pathway independently of chemical stress.
a Schematic depicting the ISR pathway, including kinases mediating the phosphorylation of eIF2α, and activation of eIF2B by DNL343. b Confocal microscopy images showing induced expression of GFP-TDP-43FL and GFP-TDP-43(86-414) variant in H4 cells increased immunoreactivity of ATF4 (anti-ATF4, red) compared to GFP control. This ATF4 signal was reduced with 1 µM DNL343 treatment. Scale bar: 20 µm. c Quantification of ATF4 immunoreactivity in (b) from n = 3 (GFP Control) or 4 biological replicates (GFP-TDP-43 variants). a.u.: arbitrary units. d ECLIA-based assay result demonstrating elevated ATF4 protein levels with induced expression of GFP-TDP-43FL and GFP-TDP-43(86-414), compared to GFP control cells. Pre-treatment with DNL343 reduced ATF4 protein levels in each cell line (n = 6 biological replicates). e Volcano plot of differentially regulated genes in H4 cells induced with GFP-TDP-43FL compared to GFP control. Representative ISR genes with significant expression changes are labeled as red (upregulation) or blue (downregulation) and insignificant genes as gray. Significance cutoff, adjusted p-value < 0.05. f Volcano plot of differentially regulated genes in H4 cells induced with GFP-TDP-43(86-414) compared to GFP control. Representative ISR genes are labeled as in (e). Significance cutoff, adjusted p-value < 0.05. g Gene set enrichment analysis (GSEA) plot for ISR gene comparing truncated GFP-TDP-43(86-414) from GFP control expressing cells. h Volcano plot of differentially regulated genes 24 hours after DNL343 treatment in H4 cells induced with GFP-TDP-43(86-414). The same set of representative ISR genes from (e) and (f) are labeled. All data are shown as mean ± SEM (c, d). Statistical significance was determined with one-way ANOVA, with Tukey’s multiple comparison, ns P > 0.05. Source data are provided in Source Data file.
Fig. 2
Fig. 2. ALS-associated RNA binding proteins colocalize with stress granules and DNL343 and its analog inhibit these structures in cell models.
a Fluorescence microscopy of fixed H4 cells expressing mCherry-tagged G3BP1 (red) and GFP-tagged RBPs (TDP-43, TIA1, and FUS variants) (green). In the presence of 250 µM NaAsO2 for 1 h, these RBPs colocalized to G3BP1 positive stress granules (shown in yellow). Nuclei were labeled with DAPI (blue). Scale bar: 20 µm. See Supplementary Fig. 2a for single channel images. b Live-cell imaging quantification shown in Supplementary Movie 1 of the colocalization between GFP-tagged TDP-43 variants and G3BP1-mCherry in the presence of 200 µM NaAsO2 over time. Colocalization was quantified as a percentage of the TDP-43 puncta found within stress granules out of the total number of TDP-43 puncta identified per cell. n = 3 independent experiments. Data shown as mean ± SEM. Statistical significance was determined by one-way ANOVA, with Tukey’s multiple comparison, ns P > 0.05. c Microscopy images of H4 inducible cells pre-treated with 1 µM DNL343 or vehicle, followed by 200 µM NaAsO2 for 2 h and immunostained with an antibody recognizing the epsilon subunit of eIF2B. DNL343 prevented the puncta formation of truncated TDP-43 (green), G3BP1 (magenta), and eIF2B (red). Arrowheads indicate colocalization of each marker. Nuclei were stained with DAPI (blue). Scale bar: 20 µm. Three independent experiments were performed with similar results. df Inset of single cell from merged image in (c). Fluorescent line intensity histograms of GFP (d) or GFP-TDP-43(86-414) (e, f), G3BP1, and eIF2B across the yellow lines in the images. Source data are provided in Source Data file.
Fig. 3
Fig. 3. ISR activation from in vivo model of ALS-associated TDP-43 pathology is corrected by acute dosing of eIF2B activator, DN9058.
a Experimental design of acute DN9058 dosing of rNLS8 transgenic mice. All animals were fed Dox-containing diet until 8 weeks of age, including non-transgenic (nTg) controls, single transgenic (sTg) controls and double transgenic (rNLS8) mice, then Dox was removed from their diet except for group 6 (double transgenic (rNLS8) on Dox for two additional weeks). On 13th and 14th day off Dox, indicated groups were dosed with DN9058 by oral gavage at 50 mg/kg per animal weight. b-c Quantification of p-eIF2α normalized to loading control eIF2α (b) and ATF4 level normalized to GAPDH (c) from Supplementary Fig. 4i and j (n = 8 sTg Control or 12 rNLS8 mice). Data are shown as fold-changes relative to vehicle-treated control mice. d Transcriptional fold change of pre-selected ISR genes in rostral cortex of indicated mouse line (n = 7 (nTg Ctrl), 8 (rNLS8 Dox), 9 (sTg Ctrl) and 12 (rNLS8) mice). Data are shown as mean ± SEM (bd). Statistical significance was determined with Kruskal-Wallis test with Dunn’s multiple comparisons (b), ordinary One-way ANOVA with Tukey’s multiple comparison (c, d). Source data are provided in Source Data file.
Fig. 4
Fig. 4. Chronic dosing of DN9058 corrects ISR activation and induces transitory delays in behavior deficit from in vivo model of TDP-43 pathology.
a Experimental design of chronic DN9058 dosing for 6 weeks off dox (WOD). DN9058 was formulated at 50 mg/kg per chow for the chronic administration to the indicated conditions. b-c Quantification of p-eIF2α normalized to loading control eIF2α (b) and ATF4 level normalized to GAPDH (c) from Supplementary Fig. 5i and j, respectively (n = 8 (sTg Control), 10 (rNLS8 Veh), and 13 (rNLS8 DN9058) mice). Data are shown as fold-changes relative to vehicle-treated control mice. d-e Transcript level changes of pre-selected ISR genes (d) and ISR genes indicated in later stage of the disease (e) in rostral cortex (n = 9 (sTg Control), 10 (rNLS8 Dox), 11 (rNLS8 Veh), and 16 (rNLS8 DN9058) mice). f Time (weeks) to show clasping for individual rNLS8 mice that demonstrated the clasping phenotype (n = 13 (Veh) and 18 (DN9058) mice). g Plasma NfL concentration at baseline (0 WOD), 2, 4, and 6 WOD in rNLS8 mice (n = 11 (Veh) and 16 (DN9058) mice). The same figure legend for rNLS8 + Veh (yellow) and rNLS8 + DN9058 (orange) is shared with panel (f). Source data are provided in Source Data file. Data are shown as mean ± SEM (be) and individual values overlayed on violin plot (f, g). Statistical significance was determined with Kruskal-Wallis test with Dunn’s multiple comparisons (b, c), ordinary One-way ANOVA with Tukey’s multiple comparison (d, e), Two-tailed Mann-Whitney test (f), and Two-way ANOVA with multiple comparisons (g).
Fig. 5
Fig. 5. ISR genes are dysregulated in spinal cord tissue and CSF from individuals with ALS.
a Density plot of ISR gene set (orange line) in cervical spinal cord tissue from Target ALS dataset. b Normalized ISR gene expression plots comparing Control and ALS from cervical spinal cord. Samples are from the Target ALS dataset and include cervical spinal cord tissue with n = 116 for ALS samples and n = 16 for control samples. c Non-age adjusted CSF GDF-15 concentration (pg/mL) in healthy participants (n = 47) and ALS participants (n = 27) at baseline. d Age adjusted CSF GDF-15 concentration (pg/mL) in MAD healthy participants (n = 47) and ALS participants (n = 27) at baseline. Data shown as Min-to-Max Box plots overlayed with individual values (bd). Statistical significance was determined with Two-tailed Mann-Whitney test. Source data are provided in Source Data file.
Fig. 6
Fig. 6. Disposition and pharmacokinetic profiles in healthy participants and participants with ALS in DNL343 clinical trials.
a CONSORT diagram describing Phase 1 screening and randomization. b CONSORT diagram describing Phase 1b screening and randomization. c Healthy participants plasma concentration-time profiles upon single doses of DNL343 in the fasted state (n = 6 in each group). Presented as the geometric mean (95% CI) and colored by dose level. d, e Healthy participants (n = 6, 7, 7, 7, and 6 participants, for the 45 mg, 100 mg, 145 mg, 200 mg, and 260 mg group respectively) (d) and participants with ALS (n = 9, 7 participants in the 100 mg and 200 mg groups, respectively) (e) plasma pharmacokinetics upon QD dosing of DNL343 at steady state. Presented as the geometric mean (95% CI) and colored by dose level. f, g Healthy participants (n = 6, 7, 7, 7, and 6 participants, for the 45 mg, 100 mg, 145 mg, 200 mg, and 260 mg group respectively) (f) and participants with ALS (n = 8, 7 participants in the 100 mg and 200 mg groups respectively) (g) DNL343 CSF:unbound plasma concentration ratios after multiple doses. Presented as individual datapoints colored by dose level overlayed over a boxplot summarizing all the data in the panel. The middle line of the boxplot displays the median, the lower and upper limits of the box display the first and third quartiles, and the whiskers extend from the box to the largest and smallest values no further than 1.5-fold the interquartile range from the box. The lower and upper limits of quantification (LLOQ and ULOQ) for CSF concentrations was 0.005 and 5 µM, respectively. The LLOQ and ULOQ for plasma concentrations was 0.002 and 2 µM, respectively. Note: In the 100 mg group, data were not collected and/or analyzed for two participants due to dose reduction (1 participant), and no collection of CSF samples (1 participant). In the 200 mg group, data were not collected or analyzed for two participants due to dose reduction (1 participant) and early discontinuation of treatment (1 participant). Source data are provided in Source Data file.
Fig. 7
Fig. 7. ISR pathway biomarkers are reduced in ex vivo stimulated PBMCs after multiple dose administration of DNL343 in healthy and ALS participants.
ad ATF4 protein (a) and CHAC1 gene (b) expression in ex vivo stimulated PBMCs from healthy participants. ATF4 protein (c) and CHAC1 gene (d) expression in ex vivo stimulated PBMCs from ALS participants. PBMCs were freshly isolated from participants in each dose group shown at the times indicated and analyzed by either ECLIA (a, c) or multiplex qPCR (b, d). Values shown as median (IQR = interval from the first to the third quartile, shown as error bars) percent change from baseline. For MAD healthy participants ATF4 protein, n = 12, 6, 7, 7, 7, 6 participants for placebo, 45 mg, 100 mg, 145 mg, 200 mg and 260 mg groups respectively; CHAC1 gene, n = 11, 6, 7, 5, 7, 6 participants for placebo, 45 mg, 100 mg, 145 mg, 200 mg and 260 mg groups respectively. For ALS participants ATF4 protein, n = 6, 7, 6 participants for placebo, 100 mg, and 200 mg groups respectively; CHAC1 gene, n = 5, 7, 6 participants for placebo, 100 mg, 200 mg groups respectively through Day 28 for each dose group. e Heat map depicting relative change from baseline for a panel of ISR genes. Gene expression measured by multiplex qPCR in freshly isolated ex vivo stimulated PBMCs from ALS patients in each dose group. Values grouped based on median percent change from baseline and genes rank ordered based on percent change from baseline at Day 28 in the highest dose cohort (200 mg). f Percent change from baseline in CSF GDF-15 protein concentration at Day 28 in ALS participants, n = 9, 8, 8 participants for placebo, 100 mg, 200 mg groups respectively per group. Data are shown as box plot with individual percent change values overlayed. The middle line of the boxplot displays the median, the lower and upper limits of the box display the first and third quartiles, and the whiskers extend to the largest and smallest values. Source data are provided in Source Data file.

References

    1. Kim, G., Gautier, O., Tassoni-Tsuchida, E., Ma, X. R. & Gitler, A. D. ALS Genetics: gains, losses, and implications for future therapies. Neuron108, 822–842 (2020). - PMC - PubMed
    1. Mejzini, R. et al. ALS Genetics, mechanisms, and therapeutics: where are we now?. Front Neurosci.13, 1310 (2019). - PMC - PubMed
    1. Goutman, S. A. et al. Emerging insights into the complex genetics and pathophysiology of amyotrophic lateral sclerosis. Lancet Neurol.21, 465–479 (2022). - PMC - PubMed
    1. Fernandes, N., Eshleman, N. & Buchan, J. R. Stress granules and ALS: a case of causation or correlation?. Adv. Neurobiol.20, 173–212 (2018). - PubMed
    1. Li, Z., Liu, X. & Liu, M. Stress granule homeostasis, aberrant phase transition, and amyotrophic lateral sclerosis. ACS Chem. Neurosci.13, 2356–2370 (2022). - PubMed

Publication types

MeSH terms

Substances

LinkOut - more resources