

Identification of foam cell like M2 macrophages, AEBP1 biomarkers, and resveratrol as potential therapeutic in MASLD using Ecotyper and WGCNA
- PMID: 40825823
- PMCID: PMC12361429
- DOI: 10.1038/s41598-025-15191-6
Identification of foam cell like M2 macrophages, AEBP1 biomarkers, and resveratrol as potential therapeutic in MASLD using Ecotyper and WGCNA
Abstract
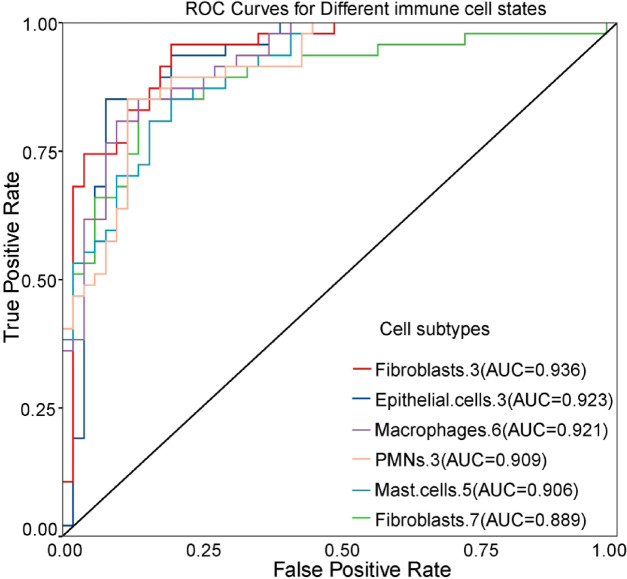
The immune cell landscapes in metabolic dysfunction-associated fatty liver disease (MAFLD) and their clinical relevance have not been explored. We used Ecotyper to identify immune cell states based on gene expression and examined their roles in metabolic dysfunction-associated steatotic liver disease (MASLD) progression. Limma was applied to identify differentially expressed genes (DEGs). Weighted gene co-expression network analysis (WGCNA) was used for module identification. Bidirectional Mendelian randomization (MR) analysis was used to validate the causal effect of AEBP1 on metabolic dysfunction-associated steatohepatitis (MASH). Out of 71 immune cell states, 32 showed significant differences between MASLD and MASH. The six most significant states were Fibroblasts.3 (tumor-associated), Epithelial.cells.3 (pro-angiogenic), PMNs.3 (classically activated), Macrophages.6 (M2 foam cell-like), Mast.cells.5, and Fibroblasts.7. All six cell states belong to the CE1 ecotype. Further analysis revealed that Fibroblasts.3 had the highest discriminatory ability in distinguishing MASH from MASLD, followed by Epithelial.cells.3 and Macrophages.6. At the ecotype level, CE1 showed the strongest ability to differentiate between MASLD and MASH, with a performance score (AUC) of 0.891. CE3 followed with a slightly lower performance (AUC = 0.826). Conversely, higher CE4 effectively differentiated MASLD from MASH (AUC = 0.871). Genes up-regulated in CE1-high samples were enriched in extracellular matrix (ECM) organization and the PI3K-Akt signaling pathway, while down-regulated genes were linked to copper ion responses. These genes formed three modules associated with fibroblasts and macrophages. We identified resveratrol, a polyphenolic compound, as a potential therapeutic drug capable of modulating these immune cell states. Protein-ligand docking analysis illuminated interactions between resveratrol and the Macrophages.6 marker gene AEBP1. This study provides a comprehensive exploration of the clinical significance of immune cell states in MAFLD. It identifies potential molecular mechanisms and therapeutic candidates. Further clinical trials are needed to validate the efficacy of resveratrol and explore its structure-activity relationships to develop targeted treatments.
Keywords: Ecotyper; Fibroblasts; Immune cell landscapes; MAFLD; Resveratrol.
© 2025. The Author(s).
Conflict of interest statement
Declarations. Competing interests: The authors declare no competing interests.
Figures


Similar articles
-
Prescription of Controlled Substances: Benefits and Risks.2025 Jul 6. In: StatPearls [Internet]. Treasure Island (FL): StatPearls Publishing; 2025 Jan–. 2025 Jul 6. In: StatPearls [Internet]. Treasure Island (FL): StatPearls Publishing; 2025 Jan–. PMID: 30726003 Free Books & Documents.
-
Metabolic Dysfunction-Associated Steatotic Liver Disease (MΑSLD).2025 Aug 9. In: StatPearls [Internet]. Treasure Island (FL): StatPearls Publishing; 2025 Jan–. 2025 Aug 9. In: StatPearls [Internet]. Treasure Island (FL): StatPearls Publishing; 2025 Jan–. PMID: 31082077 Free Books & Documents.
-
Silymarin for adults with metabolic dysfunction-associated steatotic liver disease.Cochrane Database Syst Rev. 2025 Jun 24;6(6):CD015524. doi: 10.1002/14651858.CD015524.pub2. Cochrane Database Syst Rev. 2025. PMID: 40552569
-
Systemic pharmacological treatments for chronic plaque psoriasis: a network meta-analysis.Cochrane Database Syst Rev. 2021 Apr 19;4(4):CD011535. doi: 10.1002/14651858.CD011535.pub4. Cochrane Database Syst Rev. 2021. Update in: Cochrane Database Syst Rev. 2022 May 23;5:CD011535. doi: 10.1002/14651858.CD011535.pub5. PMID: 33871055 Free PMC article. Updated.
-
The Significance of the Presence of Gilbert's Syndrome in Patients With Metabolic Dysfunction-Associated Steatotic Liver Disease (MASLD): A Retrospective Cohort Study.Cureus. 2025 May 30;17(5):e85074. doi: 10.7759/cureus.85074. eCollection 2025 May. Cureus. 2025. PMID: 40585738 Free PMC article.
References
-
- Younossi, Z. M. Non-alcoholic fatty liver disease - A global public health perspective. J. Hepatol.70, 531–544 (2019). - PubMed
-
- Sookoian, S. & Pirola, C. J. Review article: shared disease mechanisms between non-alcoholic fatty liver disease and metabolic syndrome - translating knowledge from systems biology to the bedside. Aliment. Pharmacol. Ther.49, 516–527 (2019). - PubMed
MeSH terms
Substances
Grants and funding
LinkOut - more resources
Full Text Sources
Miscellaneous
