

Auditory-motor adaptation and de-adaptation for speech depend more on time in the new environment than on the amount of practice
- PMID: 40825839
- PMCID: PMC12360952
- DOI: 10.1038/s44271-025-00304-8
Auditory-motor adaptation and de-adaptation for speech depend more on time in the new environment than on the amount of practice
Abstract
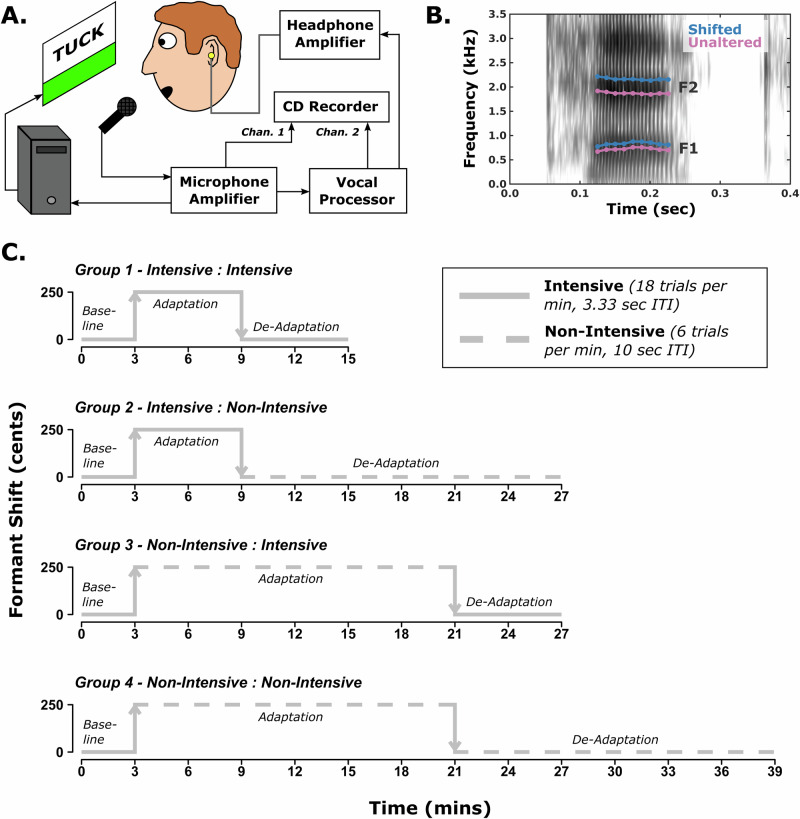
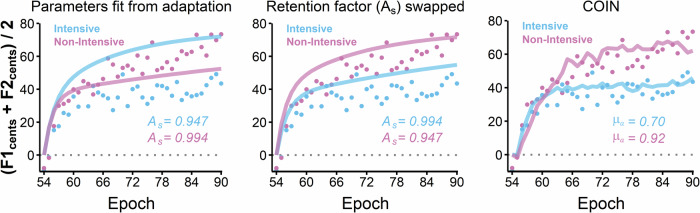
Sensorimotor adaptation is critical for learning and refining voluntary movements. One common assumption is that the number of practice trials fully determines the amount of adaptation. It is possible, however, that for some tasks the sensorimotor system continues to learn during the time in-between executed movements as long as there is no evidence that the environment has changed. The amount of time spent in the altered environment (total exposure time) then would be more important than the number of practice movements performed during that time. In the current study, we investigated adaptation and de-adaptation as a function of practice trials versus exposure time using speech articulation as the model system. Four separate groups of 14 participants read out loud monosyllabic words at a rate of either 18 words per minute or only 6 words per minute during the adaptation and de-adaptation phases of a speaking task with formant-shifted auditory feedback. The data demonstrate that both auditory-motor adaptation and de-adaptation depend more on exposure time than amount of practice. COIN model simulations suggest that this common effect is consistent with de-adaptation constituting active re-learning of the unaltered environment rather than forgetting of the learned behavior.
© 2025. The Author(s).
Conflict of interest statement
Competing interests: The authors declare no competing interests.
Figures


Similar articles
-
Prescription of Controlled Substances: Benefits and Risks.2025 Jul 6. In: StatPearls [Internet]. Treasure Island (FL): StatPearls Publishing; 2025 Jan–. 2025 Jul 6. In: StatPearls [Internet]. Treasure Island (FL): StatPearls Publishing; 2025 Jan–. PMID: 30726003 Free Books & Documents.
-
The Black Book of Psychotropic Dosing and Monitoring.Psychopharmacol Bull. 2024 Jul 8;54(3):8-59. Psychopharmacol Bull. 2024. PMID: 38993656 Free PMC article. Review.
-
Short-Term Memory Impairment.2024 Jun 8. In: StatPearls [Internet]. Treasure Island (FL): StatPearls Publishing; 2025 Jan–. 2024 Jun 8. In: StatPearls [Internet]. Treasure Island (FL): StatPearls Publishing; 2025 Jan–. PMID: 31424720 Free Books & Documents.
-
A rapid and systematic review of the clinical effectiveness and cost-effectiveness of paclitaxel, docetaxel, gemcitabine and vinorelbine in non-small-cell lung cancer.Health Technol Assess. 2001;5(32):1-195. doi: 10.3310/hta5320. Health Technol Assess. 2001. PMID: 12065068
-
Systematic review and economic analysis of the comparative effectiveness of different inhaled corticosteroids and their usage with long-acting beta2 agonists for the treatment of chronic asthma in adults and children aged 12 years and over.Health Technol Assess. 2008 May;12(19):iii-iv, 1-360. doi: 10.3310/hta12190. Health Technol Assess. 2008. PMID: 18485271
References
-
- Callan, D. E., Kent, R. D., Guenther, F. H. & Vorperian, H. K. An auditory-feedback-based neural network model of speech production that is robust to developmental changes in the size and shape of the articulatory system. J. Speech Lang. Hear. Res.43, 721–736 (2000). - PubMed
-
- Guenther, F. H. Cortical interactions underlying the production of speech sounds. J. Commun. Disord.39, 350–365 (2006). - PubMed
-
- Chen, L.-C., Metcalfe, J. S., Jeka, J. J. & Clark, J. E. Two steps forward and one back: learning to walk affects infants’ sitting posture. Infant Behav. Dev.30, 16–25 (2007). - PubMed
-
- Petrović, A. Speech sound distortions caused by changes in complete denture morphology. J. Oral Rehabil.12, 69–79 (1985). - PubMed
-
- Smith, I., Gill, S., Bateman, S. & Scheme, E. Comparison of feedback approaches to improve training in partial weight-bearing. Annu. Int. Conf. IEEE Eng. Med. Biol. Soc.2020, 3264–3268 (2020). - PubMed
Grants and funding
- R01DC014510/U.S. Department of Health & Human Services | NIH | National Institute on Deafness and Other Communication Disorders (NIDCD)
- R01 DC017444/DC/NIDCD NIH HHS/United States
- R01 DC014510/DC/NIDCD NIH HHS/United States
- R01DC020707/U.S. Department of Health & Human Services | NIH | National Institute on Deafness and Other Communication Disorders (NIDCD)
- R01 DC020707/DC/NIDCD NIH HHS/United States
LinkOut - more resources
Full Text Sources