

Exploring weighting schemes for the discovery of informative generalized between pathway models to uncover pathways in genetic interaction networks
- PMID: 40825844
- PMCID: PMC12361521
- DOI: 10.1038/s41598-025-16353-2
Exploring weighting schemes for the discovery of informative generalized between pathway models to uncover pathways in genetic interaction networks
Abstract
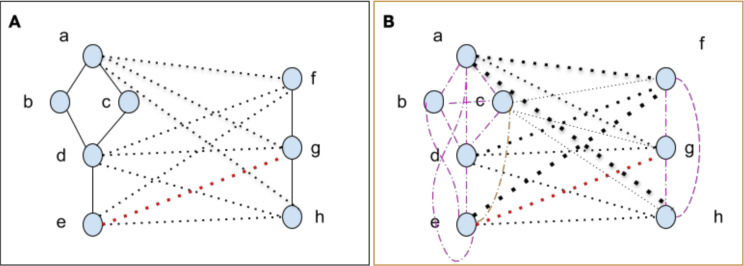
In S. cerevisiae, a large and rich collection of epistasis data has been collected. When this data comes from double knockouts, it has a natural representation as a signed and weighted graph, where the weight on an edge is computed based on deviation from the expected sickness or health of the double-deletion mutant as compared to its constituent single deletion mutants. Different probabilistic null models (minimum, multiplicative, and logarithmic) to set edge weights appropriately were studied empirically by Mani et al. where the goal was to determine the best weighting scheme for detecting the presence or absence of epistasic effect in an individual double knockout in isolation. On the other hand, approaches such as the LocalCut algorithm of Leiserson et al. look at the entire network, and search for graph-theoretic structure indicative of compensatory pathways. The effect of different edge weighting schemes on the biological pathways returned by algorithms such as LocalCut has not been previously studied. We compare the generalized Between Pathway Models produced by LocalCut under multiple different ways of calculating edge weights, and analyze the resulting collections of putative redundant pathways that are produced. We recover some known pathways, find some interesting new pathways as well as give broad recommendations for how to set the parameters of LocalCut to produce the most biologically relevant gene sets.
© 2025. The Author(s).
Conflict of interest statement
Declarations. Competing interests: The authors declare no competing interests.
Figures


Similar articles
-
Prescription of Controlled Substances: Benefits and Risks.2025 Jul 6. In: StatPearls [Internet]. Treasure Island (FL): StatPearls Publishing; 2025 Jan–. 2025 Jul 6. In: StatPearls [Internet]. Treasure Island (FL): StatPearls Publishing; 2025 Jan–. PMID: 30726003 Free Books & Documents.
-
The Black Book of Psychotropic Dosing and Monitoring.Psychopharmacol Bull. 2024 Jul 8;54(3):8-59. Psychopharmacol Bull. 2024. PMID: 38993656 Free PMC article. Review.
-
Signs and symptoms to determine if a patient presenting in primary care or hospital outpatient settings has COVID-19.Cochrane Database Syst Rev. 2022 May 20;5(5):CD013665. doi: 10.1002/14651858.CD013665.pub3. Cochrane Database Syst Rev. 2022. PMID: 35593186 Free PMC article.
-
Short-Term Memory Impairment.2024 Jun 8. In: StatPearls [Internet]. Treasure Island (FL): StatPearls Publishing; 2025 Jan–. 2024 Jun 8. In: StatPearls [Internet]. Treasure Island (FL): StatPearls Publishing; 2025 Jan–. PMID: 31424720 Free Books & Documents.
-
Comparison of Two Modern Survival Prediction Tools, SORG-MLA and METSSS, in Patients With Symptomatic Long-bone Metastases Who Underwent Local Treatment With Surgery Followed by Radiotherapy and With Radiotherapy Alone.Clin Orthop Relat Res. 2024 Dec 1;482(12):2193-2208. doi: 10.1097/CORR.0000000000003185. Epub 2024 Jul 23. Clin Orthop Relat Res. 2024. PMID: 39051924
References
Grants and funding
LinkOut - more resources
Full Text Sources
