. 2025 Aug 18;16(1):625.
doi: 10.1038/s41419-025-07841-4.

Unraveling the Role of METTL3 in Helicobacter pylori-induced gastritis via m6A-CXCL1/NF-κB modulation

Affiliations

Unraveling the Role of METTL3 in Helicobacter pylori-induced gastritis via m6A-CXCL1/NF-κB modulation

Qiutong Lu et al. Cell Death Dis. .

Abstract

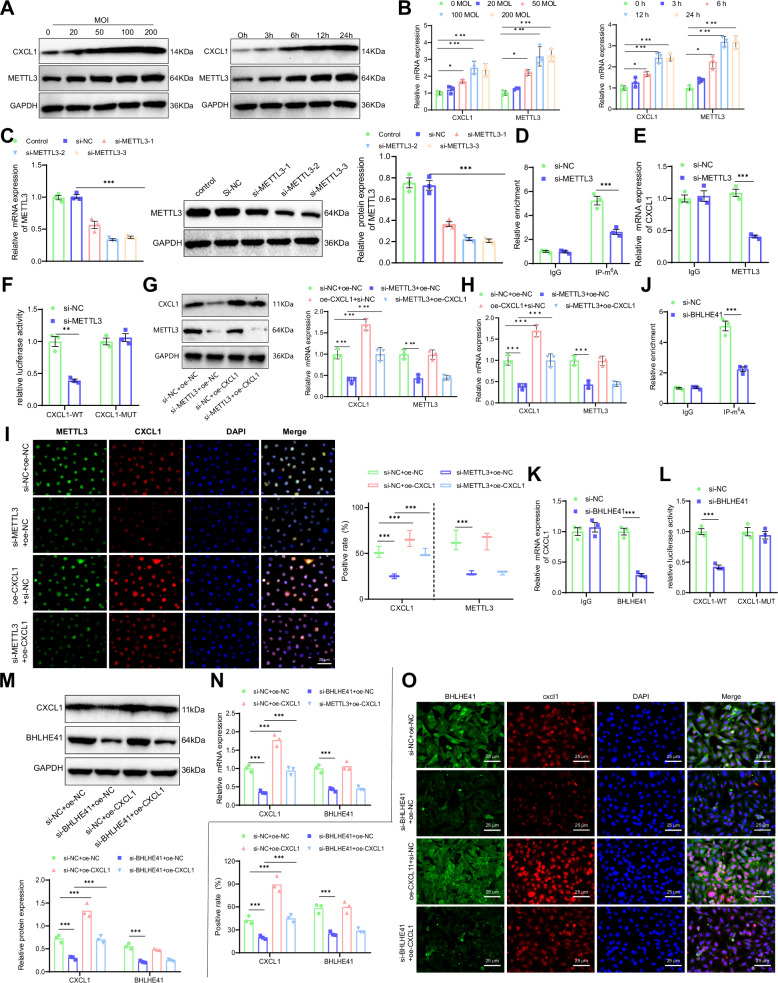
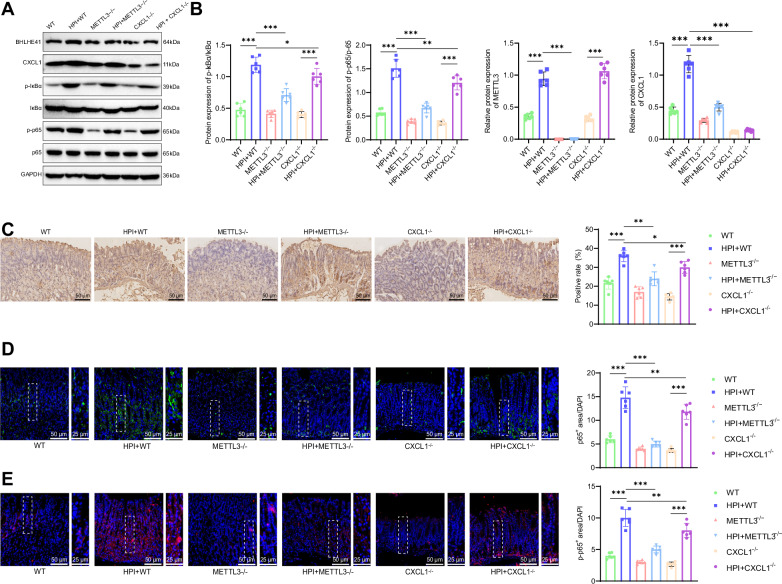
Helicobacter pylori (H. pylori) infection is a significant cause of gastric diseases, with its pathogenic mechanisms still not fully understood. This study investigates the role of METTL3, an enzyme involved in m6A methylation, in modulating the CXCL1/NF-κB signaling pathway in H. pylori-induced gastritis. Using both bioinformatics analysis of GEO database and experimental approaches including MeRIP, RIP assays, and immunostaining, this research highlights how METTL3 influences CXCL1 expression and NF-κB pathway activation. Results from both in vitro and in vivo models show that METTL3 increases inflammatory responses and apoptosis in gastric cells. Suppression of METTL3 resulted in decreased inflammation and apoptosis, suggesting its potential as a therapeutic target in gastritis management.


Conflict of interest statement

Competing interests: The author declares no competing interests. Ethical approval: All experiments involving mice were carried out in accordance with the relevant guidelines and regulations and approved by the Animal Ethics Committee of The First Affiliated Hospital of Nanchang University.

Figures

Fig. 1
Fig. 1. Functional and differential gene analysis of CXCL1 and m6A modifications in gastric tissue.
A Venn diagram of the intersection of differentially expressed genes from three HPI gastritis datasets. B Heatmap of the expression of the 7 intersecting differentially expressed genes in the GSE5081 dataset (CXCL1-Low group: n = 4; CXCL1-High group: n = 4). C Heatmap of the expression of the 7 intersecting genes in the GSE60427 dataset (CXCL1-Low group: n = 8; CXCL1-High group: n = 8). D Heatmap of the expression of the 7 intersecting genes in the GSE60662 dataset (CXCL1-Low group: n = 4; CXCL1-High group: n = 4). E GO functional analysis of the 7 intersecting differentially expressed genes in terms of biological process (BP), cellular component (CC), and molecular function (MF). F KEGG pathway enrichment analysis of the 7 intersecting differentially expressed genes. G Heatmap of the expression of 3 differentially expressed m6A modification-related genes in the GSE5081 dataset (Control group: n = 8; Gastritis group: n = 8). H Heatmap of the expression of 3 differentially expressed m6A modification-related genes in the GSE60427 dataset (Control group: n = 8; Gastritis group: n = 16). I Heatmap of the expression of 3 differentially expressed m6A modification-related genes in the GSE60662 dataset (Control group: n = 4; Gastritis group: n = 8). J Venn diagram of the intersection of differential genes related to m6A modification in three HPI gastritis datasets. K Correlation analysis of METTL3 and CXCL1 in the GSE5081 dataset. L Correlation analysis of METTL3 and CXCL1 in the GSE60427 dataset. M Correlation analysis of METTL3 and CXCL1 in the GSE60662 dataset. Values are expressed as mean ± standard deviation. *P < 0.05, **P < 0.01, ***P < 0.001 compared to Control.
Fig. 2
Fig. 2. Validation of METTL3-CXCL1 Target Relationship.
A Western blot analysis of CXCL1 and METTL3 protein levels in GES-1 cells after co-culture with HP at different MOIs (0, 20, 50, 100, and 200) and for different durations (0, 3, 6, 12, and 24 h). B RT-qPCR analysis of CXCL1 and METTL3 mRNA levels in GES-1 cells after co-culture with HP at different MOIs (0, 20, 50, 100, and 200) and for different durations (0, 3, 6, 12, and 24 h). C RT-qPCR and Western blot screening of three si-METTL3 sequences. D MeRIP-qPCR experiment detecting m6A methylation modifications of CXCL1 mRNA in GES-1 cells. E RIP-qPCR experiment detecting the target relationship between CXCL1 mRNA and METTL3 in GES-1 cells. F Dual-luciferase reporter assay detecting the target relationship between CXCL1 and METTL3 in GES-1 cells. G Western blot analysis of CXCL1 and METTL3 protein expression levels in HP-infected GES-1 cells. H RT-qPCR analysis of CXCL1 and METTL3 mRNA levels in HP-infected GES-1 cells. I Immunofluorescence staining detecting the expression levels of CXCL1 and METTL3 in HP-infected GES-1 cells. J MeRIP-qPCR experiment detecting m6A methylation modifications of CXCL1 mRNA in GES-1 cells. K RIP-qPCR experiment detecting the target relationship between CXCL1 mRNA and BHLHE41 in GES-1 cells. L Dual-luciferase reporter assay detecting the target relationship between CXCL1 and BHLHE41 in GES-1 cells. M Western blot analysis of CXCL1 and BHLHE41 protein expression levels in HP-infected GES-1 cells. N RT-qPCR analysis of CXCL1 and BHLHE41 mRNA levels in HP-infected GES-1 cells. O Immunofluorescence staining detecting the expression levels of CXCL1 and BHLHE41 in HP-infected GES-1 cells. Scale bar: 25 μm. Values are presented as the mean ± standard deviation, and all cell experiments were repeated three times. ***indicates P < 0.001.
Fig. 3
Fig. 3. Impact of METTL3/CXCL1 Signaling Axis on HPI GES-1 Cells.
A Colony formation assay to assess cell viability in HPI GES-1 cells. B Flow cytometry analysis to measure cell apoptosis in HPI GES-1 cells. C Western blot analysis of cleaved caspase-3, cleaved caspase-9, and cleaved PARP levels. D mRNA levels of IL-6, IL-8, and TNF-α in HPI GES-1 cells as detected by RT-qPCR. E IL-6 content in HPI GES-1 cells as measured by ELISA. F IL-8 content in HPI GES-1 cells as measured by ELISA. G TNF-α content in HPI GES-1 cells as measured by ELISA. H HP biofilm formation in HPI GES-1 cells as detected by immunofluorescence staining; Scale bar: 50 μm. I Adhesion of HP in HPI GES-1 cells as detected by immunofluorescence staining; Scale bar: 25 μm. Values are expressed as mean ± standard deviation. ***P < 0.001.
Fig. 4
Fig. 4. Validation of the relationship between CXCL1 and the NF-κB signaling pathway.
A RT-qPCR screening of three si-CXCL1 sequences. B Western blot analysis of p-IκBα, IκBα, p-p65, and p65 protein expression levels in HPI-treated GES-1 cells. The bar charts represent the ratios of p-IκBα/IκBα and p-p65/p65 protein levels. C Immunofluorescence staining of CXCL1 and NF-κB expression levels in HPI-treated GES-1 cells, scale bar: 25 μm. Values are presented as the mean ± standard deviation, and all cell experiments were repeated three times. *** indicates P < 0.001.
Fig. 5
Fig. 5. Impact of CXCL1/NF-κB signaling axis on HPI GES-1 cells.
A Colony formation assay to detect the survival of HPI-treated GES-1 cells. B Flow cytometry analysis to detect apoptosis in HPI-treated GES-1 cells. C Western blot analysis of cleaved caspase-3, cleaved caspase-9, and cleaved PARP levels. D RT-qPCR analysis of IL-6, IL-8, and TNF-α mRNA levels in HPI-treated GES-1 cells. E ELISA analysis of IL-6 levels in HPI-treated GES-1 cells. F ELISA analysis of IL-8 levels in HPI-treated GES-1 cells. G ELISA analysis of TNF-α levels in HPI-treated GES-1 cells. H Immunofluorescence staining to detect biofilm formation in HPI-treated GES-1 cells, scale bar: 25 μm; I Immunofluorescence staining to detect HP adhesion in HPI-treated GES-1 cells, scale bar: 25 μm. Values are presented as the mean ± standard deviation, and all cell experiments were repeated three times. *** indicates P < 0.001.
Fig. 6
Fig. 6. Validation of the relationship between METTL3 and the NF-κB signaling pathway.
A Western blot analysis of the protein expression levels of p-IκBα, IκBα, p-p65, and p65 in HPI GES-1 cells; bar graphs represent the ratios of p-IκBα/IκBα and p-p65/p65 protein levels. B Immunofluorescence staining to detect the expression levels of METTL3 and NF-κB in HPI GES-1 cells, scale bar: 25 μm. Values are presented as mean ± standard deviation; all cell experiments were repeated three times, and *** indicates P < 0.001.
Fig. 7
Fig. 7. Impact of METTL3/NF-κB signaling axis on HPI GES-1 cells.
A Colony formation assay to detect the survival of HPI-treated GES-1 cells. B Flow cytometry analysis to detect apoptosis in HPI-treated GES-1 cells. C Western blot analysis of cleaved caspase-3, cleaved caspase-9, and cleaved PARP levels. D RT-qPCR analysis of IL-6, IL-8, and TNF-α mRNA levels in HPI-treated GES-1 cells. E ELISA analysis of IL-6 levels in HPI-treated GES-1 cells. F ELISA analysis of IL-8 levels in HPI-treated GES-1 cells. G ELISA analysis of TNF-α levels in HPI-treated GES-1 cells. H Immunofluorescence staining to detect biofilm formation in HPI-treated GES-1 cells, scale bar:25 μm; I Immunofluorescence staining to detect HP adhesion in HPI-treated GES-1 cells, scale bar: 25 μm. Values are presented as the mean ± standard deviation, and all cell experiments were repeated three times. *** indicates P < 0.001.
Fig. 8
Fig. 8. Effects of METTL3 knockout on HPI gastric inflammation in mice.
A Construction of METTL3−/− and CXCL1−/− mice using CRISPR-Pro gene knockout technology, along with RT-qPCR and sequencing results. B Rapid urease test to detect gastric mucosal infection in mice. C H&E staining to observe the morphology and structure of gastric mucosal cells, scale bar: 50 μm. D TUNEL assay to detect apoptosis in gastric mucosal cells, scale bar: 25 μm. E Western blot analysis of cleaved caspase-3, cleaved caspase-9, and cleaved PARP levels. F RT-qPCR analysis of CXCL1, IL-6, IL-8, and TNF-α mRNA levels in the gastric mucosa of mice. G ELISA analysis of CXCL1, IL-6, and TNF-α levels in the gastric mucosa of mice. H Immunofluorescence detection of GIF expression in the gastric mucosa, scale bar: 25 μm. I Immunofluorescence detection of Ki67 expression in the gastric mucosa, scale bar: 25 μm. J Immunofluorescence detection of MPO expression in the gastric mucosa, scale bar: 25 μm. Each group contains 6 mice. Values are presented as the mean ± standard deviation, * indicates P < 0.05, ** indicates P < 0.01, *** indicates P < 0.001.
Fig. 9
Fig. 9. Effects of METTL3 knockout on the CXCL1/NF-κB signaling axis in HPI gastric inflammation mice.
A Western blot analysis of the protein levels of METTL3, CXCL1, p-IκBα, IκBα, p-p65, and p65 in gastric mucosa of mice. B METTL3, CXCL1 and ratios of p-IκBα/IκBα, p-p65/p65 protein levels. C Immunohistochemical staining to detect the expression of CXCL1 in gastric mucosa of mice, scale bar: 50 μm. D Immunofluorescence staining to assess the expression levels of p65 in gastric mucosa of mice, with the right images showing enlarged views of the left images, scale bar: 50 /25 μm. E Immunofluorescence staining to assess the expression levels of p-p65 in gastric mucosa of mice, with the right images showing enlarged views of the left images, scale bar: 50 /25 μm. Each group consisted of 6 mice, values are presented as mean ± standard deviation, * indicates P < 0.05, ** indicates P < 0.01, *** indicates P < 0.001.

References

    1. FitzGerald R, Smith SM. An Overview of Helicobacter pylori Infection. Methods Mol Biol. 2021;2283:1–14. 10.1007/978-1-0716-1302-3_1. - PubMed
    1. Smyth EC, Nilsson M, Grabsch HI, van Grieken NC, Lordick F. Gastric cancer. Lancet. 2020;396:635–648. - PubMed
    1. Alipour M. Molecular Mechanism of Helicobacter pylori-Induced Gastric Cancer. J Gastrointest Canc. 2020;52:23–30. - PMC - PubMed
    1. Toyoshima O, Nishizawa T, Koike K. Endoscopic Kyoto classification of Helicobacter pylori infection and gastric cancer risk diagnosis. WJG. 2020;26:466–477. - PMC - PubMed
    1. Park JM, Han YM, Hahm KB. Rejuvenation of Helicobacter pylori–Associated Atrophic Gastritis Through Concerted Actions of Placenta-Derived Mesenchymal Stem Cells Prevented Gastric Cancer. Front Pharmacol. 2021;12. 10.3389/fphar.2021.675443. - PMC - PubMed

MeSH terms