. 2025 Aug 18;15(1):30261.
doi: 10.1038/s41598-025-15182-7.

Exploring ferroptosis-associated immune characteristics in Kawasaki disease through bioinformatics

Affiliations

Exploring ferroptosis-associated immune characteristics in Kawasaki disease through bioinformatics

Wei Li et al. Sci Rep. .

Abstract

Kawasaki disease (KD), as a common pediatric inflammatory vasculitis, has an unclear pathogenesis. This study integrated bioinformatics and clinical data analysis to explore the characteristics of ferroptosis in KD. We used data from the Gene Expression Omnibus (GEO) database to identify ferroptosis-related genes, and variable selection was performed using Least Absolute Shrinkage and Selection Operator (LASSO) analysis. We employed seven machine learning methods to determine the optimal predictive model, revealing that the Support Vector Machine (SVM) model exhibited optimal performance in external validation. Unsupervised clustering based on FRGs stratified KD patients into high and low expression subtypes. The high expression subtype showed significantly elevated levels of monocyte immune infiltration, which was further validated by single-cell analysis. Clinical data analysis demonstrated that patients in the high-monocyte group not only had a higher incidence of incomplete KD presentations but also exhibited lower resistance to intravenous immunoglobulin (IVIG) therapy. These results suggest that ferroptosis may participate in the pathogenesis of KD by modulating monocyte levels, providing new insights into explaining clinical heterogeneity and differences in IVIG treatment responses.

Keywords: Clinical data analyses; Ferroptosis; Immune infiltration; Kawasaki disease; Machine learning; Molecular clusters; Single-cell analysis.


Conflict of interest statement

Declarations. Competing interests: The authors declare no competing interests. Consent for publication: Not applicable. Ethical approval and consent to participate: The clinical data research was conducted in accordance with the Declaration of Helsinki and approved by the Ethics Committee of the Affiliated Hospital of Southwest Medical University. The committee also granted a waiver of informed consent since the retrospectively collected data were anonymized (Luzhou, China; Approval No. KY2025177). The gene dataset was obtained from a public database, and therefore no additional ethics committee approval or patient consent was required.

Figures

Fig. 1
Fig. 1
The study flow chart.
Fig. 2
Fig. 2
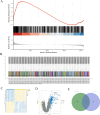
The identification process of differentially expressed ferroptosis genes in KD children and the control group (A) Gene Set Enrichment Analysis. The peak of the Enrichment Score (ES) curve corresponds to the location of the strongest enrichment for the gene set, and the ranking metric is logFC (log fold change); (B) Box plot of the standardized GES 73,461 dataset; (C) Heatmap of the top 30 KD that are upregulated and downregulated; (D) Volcano plot of differentially expressed genes between KD children and the control group in the GES 73,461 dataset; (E) Venn diagram composed of differentially expressed genes and ferroptosis genes.
Fig. 3
Fig. 3
(A) The box plot shows the differences in 9 FRGs between the KD group and the healthy group, *p < 0.05 and ***p < 0.001. (B) The heatmap illustrates the expression of 9 FRGs between the KD group and the healthy group. (C) The box plot displays the differences in 9 FRGs between the acute phase and the recovery phase of KD. (D) The heatmap shows the expression of 9 FRGs between the acute phase and the recovery phase of KD.
Fig. 4
Fig. 4
(A, B) In the correlation analysis of 9 FRGs, positive correlations are represented in red and negative correlations in green. The correlation coefficients are illustrated by the size of the pie chart and the width of the bands in the chord diagram. (C) The Circos plot shows the positions of FRGs on the chromosomes. (D) The PPI network from STRING shows the interactions among the 9 FRGs. (E) The co-expression gene prediction map from GeneMANIA identified the top 20 co-expressed gene.
Fig. 5
Fig. 5
(A, B) Lasso analysis, It shows that the λ for the minimum mean square error is 0.009, while the λ for the minimum distance standard error is 0.051. The variable selection for the model corresponding to λ = 0.051 includes: ACSL1, IL1B, PROK2, GALNT14, MGST1, and LCN2; (C) ROC curves for 6 FRGs; (DI) Constructing the optimal machine learning model. (D) ROC curves for the validation group of seven models; (E) Forest plot of AUC values for the seven models; (F) Model calibration curve; (G) Decision curve analysis plot; (H) Feature importance in SHAP. Each point corresponds to a patient, and each line represents a feature, with the x-axis showing SHAP values. Red points indicate higher feature values, while blue points indicate lower feature values. (I) Force Plot. A sample predicted as KD is actually KD; the bold number 0.99 represents the probability prediction value (f(x)), while the baseline is the model’s prediction without any feature input. Red features increase the predicted probability of KD, while blue features decrease it. The length of the arrows helps visualize the extent of influence on the prediction. The longer the arrow, the greater the impact.
Fig. 6
Fig. 6
External validation based on the GSE 68,004 dataset. (A) ROC curves for 6 FRGs in GSE 68,004 dataset. (B) ROC curves for the test group of SVM model. (C) Confusion Matrix.
Fig. 7
Fig. 7
Identification of ferroptosis-related molecular clusters in KD. (A) Consensus clustering matrix when k = 2. (B) Representative cumulative distribution function (CDF) curves, (C) the score of consensus clustering. (D) Box plot for 6 FRGs. (E) Heat map of the matrix of 6 FRGs. (F) PCA visualizes the distribution of two subtypes.
Fig. 8
Fig. 8
Immunological and biological characterization of two ferroptosis clusters. (A) Differences in biological functions between C1 and C2 clusters ranked by the t-value of the GSVA method. (B) Differences in KEGG pathway activities between C1 and C2 clusters ranked by the t-value of the GSVA method. (C) Relative abundance of 22 infiltrating immune cells between two ferroptosis clusters. (D) Box plot showing the difference in immune infiltration between the two ferroptosis clusters.
Fig. 9
Fig. 9
Single-cell analysis. (A) t-SNE plot. (B) Gene expression distribution plot (C) Cell type distribution plot. (D) The bubble plot represents the distribution of genes across different cell types, with bubble size and color intensity indicating the distribution and expression levels of the genes.
Fig. 10
Fig. 10
Bar Chart. (A) It displays the distribution proportions of Classic KD versus Incomplete KD across low, medium, and high monocyte groups. (B) It illustrates the proportions of IVIG-resistant and IVIG-responsive cases within low, medium, and high monocyte groups.

References

    1. McCrindle, B. W. et al. Diagnosis treatment, and long-term management of Kawasaki disease: A scientific statement for health professionals from the American heart association. Circulation135(17), e927–e999 (2017). - PubMed
    1. Kawasaki, T., Kosaki, F., Okawa, S., Shigematsu, I. & Yanagawa, H. J. P. A new infantile acute febrile mucocutaneous lymph node syndrome (MLNS) prevailing in Japan. Pediatrics54(3), 271–276 (1974). - PubMed
    1. McCrindle, B. W. et al. Diagnosis, treatment, and long-term management of Kawasaki disease: A scientific statement for health professionals from the American heart association. Circulation135(17), e927–e999 (2017). - PubMed
    1. Dixon, S. J. et al. Ferroptosis: an iron-dependent form of nonapoptotic cell death. Cell149(5), 1060–1072 (2012). - PMC - PubMed
    1. Jiang, X., Stockwell, B. R. & Conrad, M. Ferroptosis: mechanisms, biology and role in disease. Nat. Rev. Mole. Cell Biol.22(4), 266–282 (2021). - PMC - PubMed

Substances

LinkOut - more resources