. 2025 Aug 19;16(1):7699.
doi: 10.1038/s41467-025-63152-4.

Noncanonical function of Pannexin1 promotes cellular senescence and renal fibrosis post-acute kidney injury

Affiliations

Noncanonical function of Pannexin1 promotes cellular senescence and renal fibrosis post-acute kidney injury

Liuwei Huang et al. Nat Commun. .

Abstract

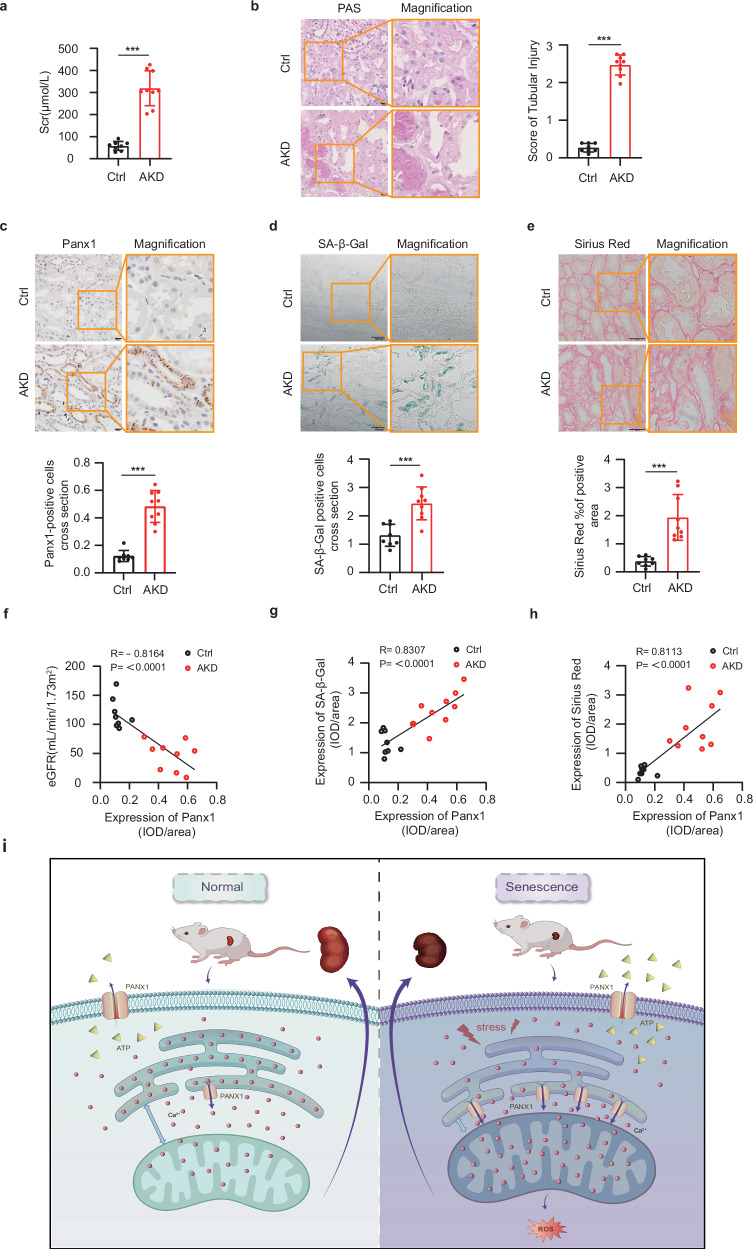
Acute kidney injury (AKI) can lead to chronic kidney disease (CKD), a transition driven by cellular senescence, a state of irreversible cell-cycle arrest. However, the molecular mechanisms promoting this pathological process remain unclear. Here we show that the channel protein Pannexin1 (Panx1) promotes this detrimental senescence and subsequent kidney fibrosis. We found that Panx1 functions in a noncanonical role as a calcium (Ca2+) leak channel within the endoplasmic reticulum (ER), a key intracellular calcium store. This Panx1-mediated leak occurs at contact sites between the ER and mitochondria, leading to mitochondrial calcium overload, dysfunction, and the generation of pro-senescence signals. Genetically deleting Panx1 in male mouse models of AKI attenuates renal senescence and fibrosis. These findings, validated in human kidney tissue, identify ER-resident Panx1 as a critical driver of kidney disease progression and a potential therapeutic target.


Conflict of interest statement

Competing interests: The authors declare no competing interests.

Figures

Fig. 1
Fig. 1. Panx1 expression is increased in aged human and mouse kidney tissue.
af Analysis of renal tissue from young (n = 6) and aged (n = 6) human individuals. a Representative immunohistochemical staining for Panx1. Scale bars, 20 µm. b Representative SA-β-Gal staining. Scale bars, 100 µm. c Correlation analysis between Panx1 expression and SA-β-Gal activity. d Representative images of Panx1 (red) and C12FDG (green) colocalization. Scale bars, 60 µm. e Representative immunofluorescence for Panx1 (green), p21 (red) and AQP-1 (purple). Scale bars, 60 µm. f Quantification of Panx1- and p21-positive cells. gl Analysis of renal tissue from young (n = 6) and aged (n = 6) mice. g Representative immunohistochemical staining for Panx1. Scale bars, 20 µm. h Representative SA-β-Gal staining. Scale bars, 100 µm. i Correlation analysis between Panx1 expression and SA-β-Gal activity. j Representative images of Panx1 (red) and C12FDG (green) colocalization. Scale bars, 60 µm. k Representative immunofluorescence for Panx1 (green), p21 (red) and AQP-1 (purple). Scale bars, 60 µm. l Quantification of Panx1- and p21-positive cells. Asterisk: p21-positive epithelial cells. Arrow: p21-positive interstitial cells. Data in bar graphs are presented as means ± SD. P values were determined by a two-sided Student’s t-test (f, l) or Pearson’s correlation analysis (c, i). Exact P values are provided in the Source Data file. ***P < 0.001.
Fig. 2
Fig. 2. Panx1 mediates stress-induced senescence in tubular epithelial cells.
ad Effects of Panx1 knockdown on irradiated HK-2 cells. a Representative images of C12FDG and SA-β-Gal staining. Scale bars, 30 µm (C12FDG); 100 µm (SA-β-Gal). b Relative mRNA levels of senescence markers (Cdkn2a, Cdkn1a, and Tp53). c Representative immunoblot and quantification of p16, p21, and p53. d Relative mRNA levels of SASP factors (IL-1β, IL-6, IFN-β, and TGF-β). For a, c images and blots are representative of n = 3 independent biological replicates. For b, d data are from n = 6 independent biological replicates. ei Effects of Panx1 overexpression in HK-2 cells. e Representative images of EdU, C12FDG, and SA-β-Gal staining. Scale bars, 50 µm (EdU); 60 µm (C12FDG); 100 µm (SA-β-Gal). f Cell cycle distribution analysis. g Representative immunoblot and quantification of p16, p21, and p53. h Relative mRNA levels of senescence markers (Cdkn2a, Cdkn1a, and Tp53). i Relative mRNA levels of SASP factors (IL-1β, IL-6, IFN-β, and TGF-β). For e, f images are representative of n = 3 independent biological replicates. For gi data are from n = 6 independent biological replicates. The qPCR and immunoblot results are shown as the fold change compared with the control group. All quantitative data are presented as means ± SD. P values were determined by one-way ANOVA with Dunnet’s correction for multiple comparisons (bd) or a two-sided Student’s t-test (fi). Exact P values are provided in the Source Data file. *P < 0.05, **P < 0.01, ***P < 0.001, NS not significant.
Fig. 3
Fig. 3. Panx1 knockout mitigates renal senescence in vivo.
a Representative SA-β-gal staining in renal tissue. Scale bars, 50 µm. b Representative immunofluorescent images of C12FDG (green), Panx1 (red), and DAPI (blue) in kidneys. Scale bars, 40 µm. c qPCR analysis of senescence markers (Cdkn2a, Cdkn1a, Tp53). d Relative mRNA levels of SASP factors (IL-1β, IL-6, TGF-β). For all panels, images are representative, and data are from WT Sham (n = 6), K/O Sham (n = 6), WT d14-IRI (n = 8), K/O d14-IRI (n = 7), WT d28-IRI (n = 8), K/O d28-IRI (n = 8) mice. The qPCR results are shown as the fold change compared with the WT-sham group. All quantitative data are presented as means ± SD. P values were determined by one-way ANOVA with Dunnet’s correction for multiple comparisons. Exact P values are provided in the Source Data file. *P < 0.05, **P < 0.01, ***P < 0.001.
Fig. 4
Fig. 4. Upregulation of ER-localized Panx1 induces cellular senescence.
ad Effects of Panx1 overexpression in HK-2 cells. a Representative images of Panx1 (red) and the ER marker ERp72 (green). Scale bars, 10 µm. b, c Quantification of Panx1 and ERp72 colocalization by Pearson’s coefficient and Manders’ coefficient. Data are from n = 9 cells per group. d Representative immunoblot of Panx1 in whole-cell lysates (WCL) and ER fractions. ei Effects of overexpressing truncated Panx1 (Panx11–89) in Panx1 knockout HK-2 cells. e Representative immunoblot of Panx11–89. f Representative images of Panx1 (green) and ER-Tracker (blue). Scale bars, 30 µm. g Representative images of EdU, SA-β-Gal, and C12FDG staining. Scale bars, 60 μm (EdU); 100 μm (SA-β-gal); 30 μm (C12FDG). For dg results are representative of n = 3 independent biological replicates. Relative mRNA levels of h, senescence markers (Cdkn2a, Cdkn1a, and Tp53) and i SASP factors (IL-1β, IL-6, and TGF-β). For h, i data are from n = 6 independent biological replicates. The qPCR results are shown as the fold change compared with the control group. All quantitative data are presented as means ± SD. P values were determined by a two-sided Student’s t-test. Exact P values are provided in the Source Data file. *P < 0.05, **P < 0.01, ***P < 0.001.
Fig. 5
Fig. 5. Panx1-mediated ER Ca2+ release induces cellular senescence.
a, b Analysis of cytosolic Ca2+ levels (Fura Red) in HK-2 cells. a Shows results after Panx1 knockdown in irradiated cells; b shows results after Panx1 overexpression. The panels show the Fura red fluorescent trace over time, baseline signal levels, and the difference between maximal fluorescent signal and baseline in HK-2 cells. Line graphs show the mean trace ± SEM from n = 3 independent experiments. cf Effects of the intracellular Ca2+ chelator BAPTA-AM on Panx1-induced senescence. Representative images of EdU (c), SA-β-Gal and C12FDG staining (d). Images are representative of three independent experiments. Scale bars, 60 μm (C12FDG); 50 μm (SA-β-gal and EDU); e, f Representative immunoblot and quantification of p16, p21, and p53. The blot in e is representative, and quantification in f is from n = 3 independent biological replicates. Data in bar graphs are presented as means ± SD. P values were determined by one-way ANOVA with Dunnet’s correction for multiple comparisons (a, f) or a two-sided Student’s t-test (b). Exact P values are provided in the Source Data file. *P < 0.05, **P < 0.01, ***P < 0.001.
Fig. 6
Fig. 6. Panx1 promotes ER-to-mitochondria Ca2+ transfer and induces senescence.
a, b Analysis of Ca2+ levels in irradiated HK-2 cells after Panx1 knockdown. a ER Ca2+ levels (Mag-Fluo4) showing the fluorescent trace over time, baseline signal, and the difference between signal and endpoint. b Mitochondrial Ca2+ levels (Rhod2) showing the fluorescent trace over time, baseline signal, and the peak-to-baseline difference. Analysis of Ca2+ levels in Panx1-overexpressing HK-2 cells, showing c ER Ca2+ levels, and d mitochondrial Ca2+ levels. e Mitochondrial Ca2+ levels after MCU knockdown in Panx1-overexpressing cells. For ae, line graphs show the mean trace ± SEM from n = 3 independent experiments. f Representative images of EdU and SA-β-Gal staining after MCU knockdown. Images are representative of n = 3 independent biological replicates. Scale bars, 50 µm (EdU); 100 µm (SA-β-Gal). g Relative mRNA levels of senescence markers (Cdkn2a, Cdkn1a, and Tp53). h Relative mRNA levels of SASP factors (IL-1β, IL-6, and TGF-β). For g, h data are from n = 6 independent biological replicates. Data in bar graphs are presented as means ± SD. P values were determined by one-way ANOVA with Dunnet’s correction for multiple comparisons (a, b, e, g, h) or a two-sided Student’s t-test (c, d). Exact P values are provided in the Source Data file. *P < 0.05, **P < 0.01, ***P < 0.001. NS, not significant.
Fig. 7
Fig. 7. Panx1 localizes to and regulates mitochondria-ER contacts.
ag Experiments in Panx1-overexpressing HK-2 cells. a Representative images co-stained for Panx1 (green), ER-Tracker (blue), and MitoTracker (red). Scale bars, 10 µm. b Quantification of Panx1 and MitoTracker colocalization by Pearson’s coefficient and Manders’ coefficient. Data are from n = 8 cells per group. c Immunoblot analysis of Panx1 in purified cellular fractions (WCL, whole-cell lysate, ER endoplasmic reticulum, P pure mitochondria, Cr crude mitochondria, M MERCs). The blot is representative of three independent experiments. d Representative TEM images of MERCs. Green triangle and dotted line: ER; red triangle and dotted line: mitochondria. Scale bars, 0.5 µm. e Quantification of outer mitochondrial membrane (OMM)-ER apposition. Data are from n = 6 fields per group, with each group containing 10–30 mitochondria. f Proximity ligation assay (PLA) for IP3Rs and VDAC. Scale bars, 20 µm. g Quantification of PLA-positive dots. Data are from n = 10 fields per group. hl Experiments in kidneys from wild-type (WT) and Panx1 K/O mice post-unilateral IRI. h Representative TEM images of MERCs. Scale bars, 0.5 μm. i, j Quantification of OMM-ER apposition. Data are from WT Sham (n = 4), K/O Sham (n = 5), WT d14-IRI (n = 6), K/O d14-IRI (n = 5), WT d28-IRI (n = 6), K/O d28-IRI (n = 5) fields per group, with each group containing 10–30 mitochondria. k PLA for IP3Rs and VDAC. Scale bars, 50 µm. l Quantification of PLA-positive dots. For k, l images are representative, and data are from WT Sham (n = 6), K/O Sham (n = 6), WT d14-IRI (n = 8), K/O d14-IRI (n = 7), WT d28-IRI (n = 8), K/O d28-IRI (n = 8) mice. Data are presented as means ± SD. P values were determined by one-way ANOVA with Dunnet’s correction for multiple comparisons (i, j, l) or two-sided Student’s t-test (b, e, g). Exact P values are provided in the Source Data file. *P < 0.05, **P < 0.01, ***P < 0.001.
Fig. 8
Fig. 8. Panx1 downregulation mitigates mitochondrial dysfunction.
a, b Mitochondrial function in irradiated HK-2 cells after Panx1 knockdown. a Representative images and quantification of mitochondrial membrane potential using JC-1 staining. b Representative images and quantification of mitochondrial ROS using MitoSOX staining. For a, b images are representative of n = 3 independent biological replicates. Scale bars, 30 µm. c, d Mitochondrial analysis in renal tissue from wild-type (WT) and Panx1 knockout (K/O) mice post-uIRI. c Representative TEM images and quantification of mitochondrial vacuolization. Swollen or vacuolated mitochondria are indicated with red asterisks. Data are from n = 3 fields per group, with each group containing 20–30 mitochondria. Scale bars, 1 µm. d Representative images and quantification of mitochondrial ROS (MitoSOX). Images are representative of WT Sham (n = 6), K/O Sham (n = 6), WT d14-IRI (n = 8), K/O d14-IRI (n = 7), WT d28-IRI (n = 8), K/O d28-IRI (n = 8) mice. Scale bars, 50 µm. Data are presented as means ± SD. P values were determined by one-way ANOVA with Dunnet’s correction for multiple comparisons. Exact P values are provided in the Source Data file. *P < 0.05, **P < 0.01, ***P < 0.001.
Fig. 9
Fig. 9. Panx1 knockout mitigates renal fibrosis in a murine model of unilateral ischemia‒reperfusion injury.
a Relative mRNA levels of Collagen I, Fibronectin, and αSMA in the renal tissue. b, c Representative immunoblots and quantification of Collagen I and α-SMA in renal tissue. Representative images and quantification of d, e Sirius Red, f Collagen I, and g Fibronectin staining in renal tissue. Scale bars, 50 µm (Sirius Red); 20 µm (Collagen I, Fibronectin). For all panels, data are from WT Sham (n = 6), K/O Sham (n = 6), WT d14-IRI (n = 8), K/O d14-IRI (n = 7), WT d28-IRI (n = 8), K/O d28-IRI (n = 8) mice. Data are presented as means ± SD. P values were determined by one-way ANOVA with Dunnet’s correction for multiple comparisons. Exact P values are provided in the Source Data file. *P < 0.05, **P < 0.01, ***P < 0.001.
Fig. 10
Fig. 10. Panx1 expression correlates with senescence and fibrosis in patients with acute kidney disease.
Analysis of renal biopsies from control (Ctrl, n = 8 patients) and AKD (n = 9 patients) cohorts. a Serum creatinine (Cr) levels. b Representative PAS staining and quantification of tubular injury. Scale bars, 20 µm. c Representative immunohistochemistry and quantification of Panx1-positive area. Scale bars, 20 µm. d Representative SA-β-Gal staining and quantification. Scale bars, 100 µm. e Representative Sirius Red staining and quantification of fibrosis. Scale bars, 50 µm. For be images are representative of all patients analyzed in each group. Correlation analyses (n = 17 total patients) between renal Panx1 expression and f eGFR, g SA-β-Gal activity, and h Sirius Red staining. i Schematic illustrating the proposed mechanism of Panx1-mediated senescence. This schematic was created with Figdraw. Data are presented as means ± SD. P values for ae were determined by a two-sided Student’s t-test. P values for fh were determined by Pearson’s correlation analysis. Exact P values are provided in the Source Data file. ***P < 0.001.

References

    1. Kellum, J. A. et al. Acute kidney injury. Nat. Rev. Dis. Prim.7, 52 (2021). - PubMed
    1. Chawla, L. S., Eggers, P. W., Star, R. A. & Kimmel, P. L. Acute kidney injury and chronic kidney disease as interconnected syndromes. N. Engl. J. Med.371, 58–66 (2014). - PMC - PubMed
    1. Kellum, J. A., Ronco, C. & Bellomo, R. Conceptual advances and evolving terminology in acute kidney disease. Nat. Rev. Nephrol.17, 493–502 (2021). - PubMed
    1. Venkatachalam, M. A., Weinberg, J. M., Kriz, W. & Bidani, A. K. Failed tubule recovery, AKI-CKD transition, and kidney disease progression. J. Am. Soc. Nephrol.26, 1765–1776 (2015). - PMC - PubMed
    1. Liu, B. C., Tang, T. T., Lv, L. L. & Lan, H. Y. Renal tubule injury: a driving force toward chronic kidney disease. Kidney Int.93, 568–579 (2018). - PubMed

MeSH terms

LinkOut - more resources