. 2025 Aug 18;16(1):7697.
doi: 10.1038/s41467-025-62884-7.

Gene regulatory activity associated with polycystic ovary syndrome revealed DENND1A-dependent testosterone production

Affiliations

Gene regulatory activity associated with polycystic ovary syndrome revealed DENND1A-dependent testosterone production

Laavanya Sankaranarayanan et al. Nat Commun. .

Abstract

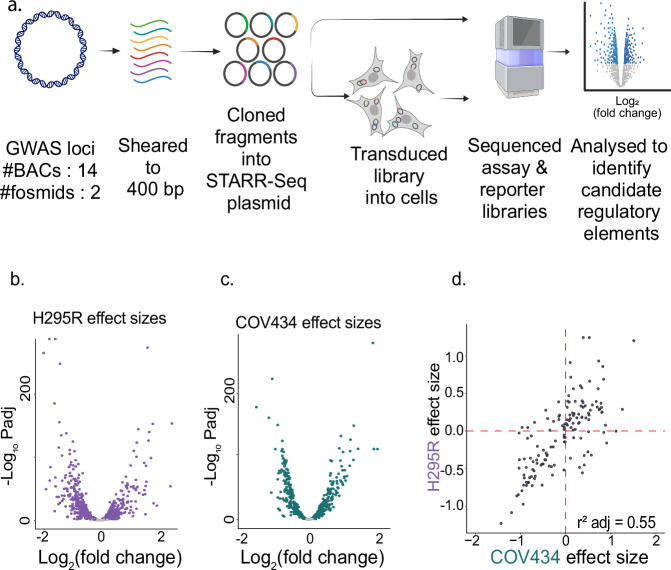
Polycystic ovary syndrome (PCOS) is among the most common disorders affecting up to 15% of the menstruating population globally. It is the leading cause of anovulatory infertility and a major risk factor for type 2 diabetes. Elevated testosterone levels are a core endophenotype. Despite that prevalence, the underlying causes remain unknown. PCOS genome-wide association studies (GWAS) have reproducibly mapped a number of susceptibility loci, including one encompassing a gene regulating androgen biosynthesis, DENND1A. Identifying the causal variants within these loci will provide fundamental insight into the precise biological pathways that are disrupted in PCOS. Here, we report the discovery of gene regulatory mechanisms that help explain genetic association with PCOS in the GATA4, FSHB and DENND1A loci using a combination of high throughput reporter assays, CRISPR-based epigenome editing, and genetic association analysis from PCOS case and control populations. In addition, we find that increasing endogenous DENND1A expression causes elevated testosterone levels in an adrenal cell model, specifically by perturbing candidate regulatory elements. These results further highlight the potential for combining genetic variant analyses with experimental approaches to fine map genetic associations with disease risk.


Conflict of interest statement

Competing interests: The authours declare no competing interests.

Figures

Fig. 1
Fig. 1. Measuring the regulatory activity in PCOS GWAS loci.
a Overview of targeted STARR-seq method: We selected bacterial artificial chromosomes (BACs) or fosmids spanning 14 PCOS GWAS loci and sheared them to ~400 bp. The sheared fragments were inserted into the digested STARR-seq backbone (Addgene#99296). The resulting plasmid library was sequenced to form the control assay library. For measuring regulatory activity, the plasmid pool was transfected into the respective cell lines (2 μg plasmid pool / 1 million cells). Six hours post transfection, RNA was isolated from the cells, and the STARR-seq transcripts were enriched and sequenced as the output reporter library. Candidate regulatory elements were called using CRADLE and effect sizes estimated with DESeq2. Created using BioRender. b STARR-seq effect size for H295R cells: The effect size is estimated as pseudo log2 (fold change) using DESeq2 on CRADLE-corrected STARR-seq peak calls. Significant peak calls (Benjamini-Hochberg adjusted p-values, FDR ≤ 0.5%) are highlighted in purple. c STARR-seq effect size for COV434 cells: The effect size is estimated as pseudo log2 (fold change) using DESeq2 on CRADLE-corrected STARR-seq peak calls. Significant peak calls (Benjamini-Hochberg adjusted p-values, FDR ≤ 0.5%) are highlighted in teal. d Comparing effect sizes of shared regulatory elements: About 93 of the regulatory elements were shared between the two cell lines. The adjusted correlation coefficient, r2 is 0.55.
Fig. 2
Fig. 2. Characterizing candidate regulatory elements.
a, c, e Candidate regulatory elements in H295R cells and COV434 cells with increasing activity correspond to regions with increased evidence of functionality. STARR-seq regulatory activity is measured across overlap with the respective cell line ATAC-seq (a, Mann-Whitney U, p < 10−10 for H295R, p < 0.01 for COV434), GTEx primary tissue ATAC-seq (c, Mann-Whitney U, p < 10−9 for H295R and COV434) and ENCODE candidate cis-regulatory elements (e, Mann-Whitney U, p < 10−9 for H295R and p < 10−6 for COV434). For (a, c, e); the box ranges from the 25th to the 75th percentile, and the median value (middle line). The whiskers extend from each quartile to the minimum and maximum values within 1.5 × interquartile range (IQR) of the box. Data points beyond this range are considered outliers (single points) and shown on these plots. Number of regions corresponding to each category, n, is specified on the plots. b Aggregate profile plots of chromatin accessibility based on ATAC-seq on the respective cell lines centred on the candidate regulatory elements (with increasing and decreasing effect sizes) across 400 bp windows for both cell lines (H295R in purple, COV434 in teal). The colour scale represents the aggregated signal (i.e., fragment coverage) within each defined STARR-seq element region, averaged as a single value. d Aggregate profile plots of chromatin accessibility based on ENCODE DNaseI Hypersensitive sites (DHS) centred on the active candidate regulatory elements across 400 bp windows for both cell lines (H295R in purple, COV434 in teal). Control regions (grey) are randomly generated genomic regions that are chromosome-, length- and GC-matched to the STARR-seq elements. The colour scale represents the aggregated signal (i.e., fragment coverage) within each defined DHS region, averaged as a single value.
Fig. 3
Fig. 3. Prioritizing PCOS-associated variants within functional regulatory elements.
a Association analysis to identify PCOS-associated variants in regulatory elements. We use the candidate regulatory elements from STARR-seq experiments to define the genomic regions of interest. We then performed an association analysis to identify variants associated with PCOS using a cohort of 983 PCOS cases and 2951 controls (results in Table 2) adjusted using Bonferroni correction. We then colocalized the association analysis results with GTEx eQTL SNPs to identify SNPs and genes as those likely involved in PCOS pathogenesis (results in Table 3). b, c Regional locuszoom plots for single nucleotide polymorphisms (SNPs) in the FSHB/ARL14EP (b) and GATA4/NEIL2 locus (c), showing P-values obtained by logistic regression within candidate regulatory elements and PCOS case-control samples (fixed-effects). SNPs are colored by r2 linkage disequilibrium (LD) and lead SNP is colored purple.
Fig. 4
Fig. 4. Fine-mapping variants identified four regulatory variants that are also eQTLs for DENND1A.
a Candidate regulatory elements in DENND1A locus identified in H295R (purple track) and COV434 (teal track) cell lines. Each STARR-seq track is reported as assay (input) subtracted reporter (output) libraries. Zoomed-in genomic regions show the candidate regulatory elements, ATAC-seq data conservation score and ENCODE cCREs of that region in detail. b Overview of enriched DENND1A-STARR-seq method. Genomes from five individuals from the 1000 Genomes Project were sheared to 200 bp. We enriched the target DENND1A locus using RNA-probes (using Agilent Sure Select System). The custom probes were designed to span the DENND1A locus at 2x tiling density. These enriched fragments were then subject to the STARR-seq protocol mentioned in Fig. 1a. Allele-specific regulatory effect was estimated using the BIRD model. Created using BioRender. c Distribution of allele-specific effect sizes as estimated by BIRD against their minor allele frequencies. The estimated significant SNPs with allele-specific regulatory activity (Posterior probability, P > 0.9) are in blue. Individual probabilities of the regulatory variant assessment is detailed in Supplementary Data 11. d Four variants identified to have allele-specific regulatory activity in H295R. SNPs in red are examples where the alternate allele has increased regulatory activity while SNPs in blue are examples where the reference allele has increased regulatory activity.
Fig. 5
Fig. 5. Perturbation of regulatory elements in DENND1A impacts testosterone levels.
a Perturbation loci: We targeted four candidate regulatory elements (Elements 1-4, also Figure S23) and the promoter regions of DENND1A. We designed between 5&7 guides per region. The STARR-seq activity (purple) and chromatin accessibility (grey) for these regions are shown. b H295R cells that stably express dCas9-p300 or dCas9-KRAB were transduced with lentiviral pools of guide RNAs for each regulatory element. The cell media supernatant was collected 2- and 4-days post transduction for measuring testosterone concentration produced by the cells. RNA was harvested from the cells 4-days post transduction to measure changes in gene expression. Created using BioRender. c, d Log-fold change of DENND1A expression (GAPDH as control) for H295R-dCas9-p300 (c) and H295R-dCas9-KRAB (d) cells with 10 μM forskolin or DMSO control. A set of 5 non-targeting control guides were designed to not target any part of the human genome as control cell population. Each individual data point is a biological replicate (n = 4); and represent data from 3 technical replicates. e, f Testosterone concentration (ng/ml) measured in the cell media 4 days post transduction in H295R-dCas9-p300 (e) and H295R-dCas9-KRAB (f) cells targeted with the specific guide RNA. Cells were cultured in the presence or absence of 10 μM forskolin. For each sample, the respective drug-treated scrambled gRNA sample was used as the control. Each individual data point is a biological replicate (n = 4); and represent data from 2 technical replicates. For (cf); the box ranges from the 25th to the 75th percentile, and the median value (middle line). The whiskers extend from each quartile to the minimum and maximum values within 1.5 × interquartile range (IQR) of the box. The individual data points are also plotted. Significance of perturbations was done using two-sided t-test by comparing each perturbation to the negative control for the respective DMSO/Forskolin conditions. If the p-value is less 0.05, it is specified on the plot. Source data are provided as a Source Data file.

References

    1. Dapas, M. & Dunaif, A. Deconstructing a Syndrome: Genomic Insights Into PCOS Causal Mechanisms and Classification. Endocr. Rev.43, 927–965 (2022). - PMC - PubMed
    1. Chang, S. & Dunaif, A. Diagnosis of Polycystic Ovary Syndrome Which Criteria to Use and When?. Endocrinol. Metab. Clin. North Am.50, 11–23 (2021). - PMC - PubMed
    1. Rubin, K. H., Glintborg, D., Nybo, M., Abrahamsen, B. & Andersen, M. Development and Risk Factors of Type 2 Diabetes in a Nationwide Population of Women With Polycystic Ovary Syndrome. J. Clin. Endocrinol. Metab.102, 3848–3857 (2017). - PubMed
    1. Diamanti-Kandarakis, E. & Dunaif, A. Insulin resistance and the polycystic ovary syndrome revisited: an update on mechanisms and implications. Endocr. Rev.33, 981–1030 (2012). - PMC - PubMed
    1. Brakta, S. et al. Perspectives on Polycystic Ovary Syndrome: Is Polycystic Ovary Syndrome Research Underfunded?. J. Clin. Endocrinol. Metab.102, 4421–4427 (2017). - PubMed

MeSH terms

Substances

LinkOut - more resources