. 2025 Aug 19;44(1):244.
doi: 10.1186/s13046-025-03466-9.

JNK pathway suppression mediates insensitivity to combination endocrine therapy and CDK4/6 inhibition in ER+ breast cancer

Affiliations

JNK pathway suppression mediates insensitivity to combination endocrine therapy and CDK4/6 inhibition in ER+ breast cancer

Sarah Alexandrou et al. J Exp Clin Cancer Res. .

Abstract

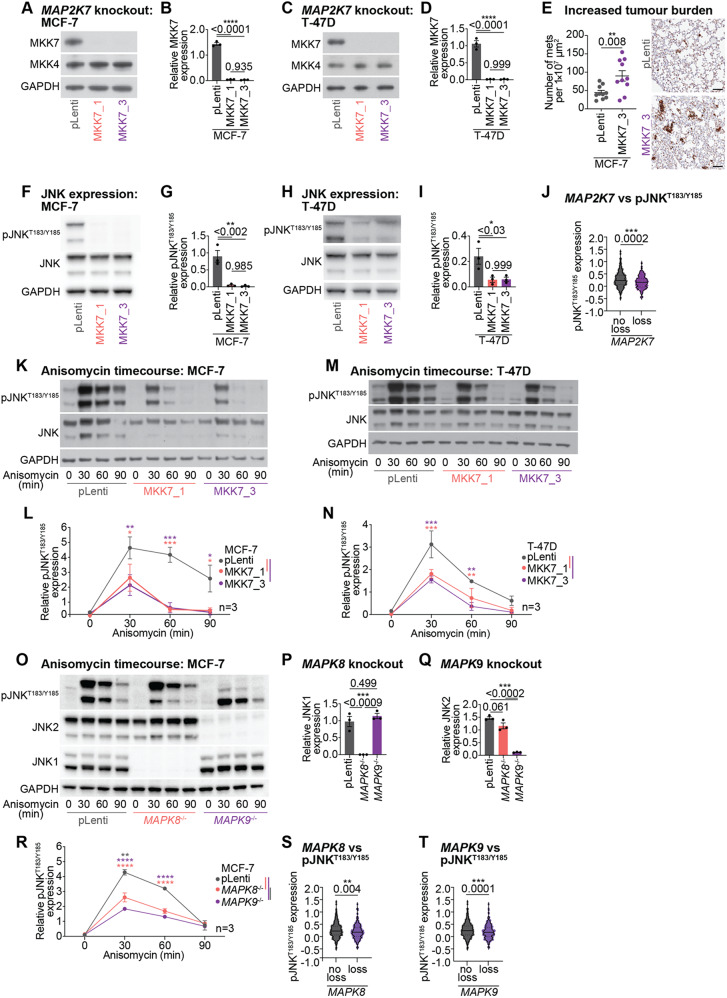
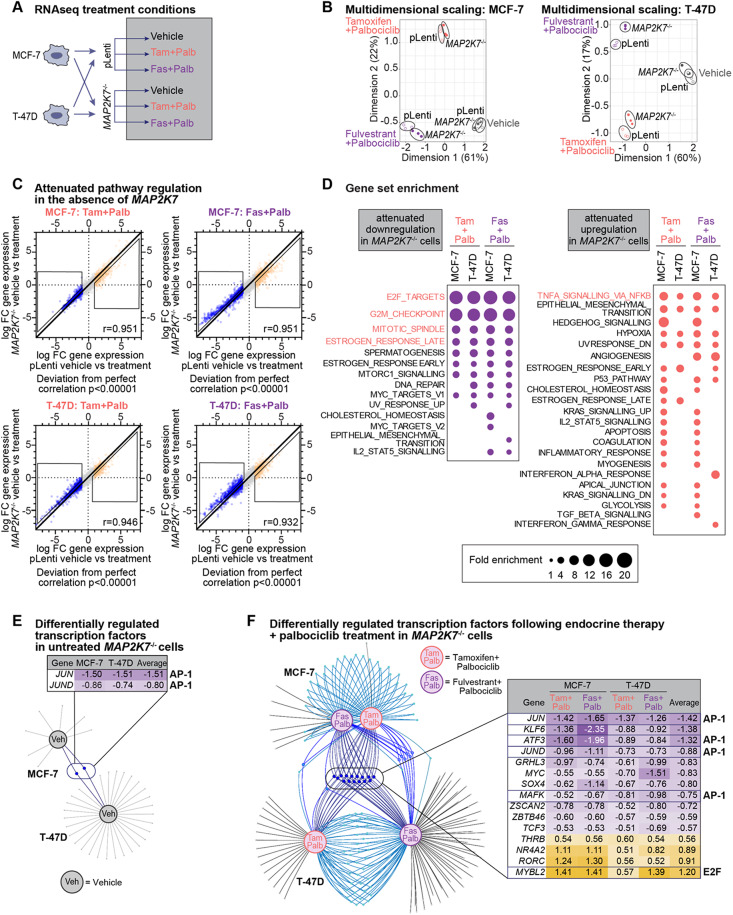
CDK4/6 inhibitors in combination with endocrine therapy are now used as front-line treatment for patients with estrogen-receptor positive (ER+) breast cancer. While this combination improves overall survival, the mechanisms of disease progression remain poorly understood. Here, we performed unbiased genome-wide CRISPR/Cas9 knockout screens using endocrine sensitive ER+ breast cancer cells to identify novel drivers of resistance to combination endocrine therapy (tamoxifen) and CDK4/6 inhibitor (palbociclib) treatment. Our screens identified the inactivation of JNK signalling, including loss of the kinase MAP2K7, as a key driver of drug insensitivity. We developed multiple CRISPR/Cas9 knockout ER+ breast cancer cell lines (MCF-7 and T-47D) to investigate the effects of MAP2K7 and downstream MAPK8 and MAPK9 loss. MAP2K7 knockout increased metastatic burden in vivo and led to impaired JNK-mediated stress responses, as well as promoting cell survival and reducing senescence entry following endocrine therapy and CDK4/6 inhibitor treatment. Mechanistically, this occurred via loss of the AP-1 transcription factor c-JUN, leading to an attenuated response to combination endocrine therapy plus CDK4/6 inhibition. Furthermore, analysis of clinical datasets found that inactivation of the JNK pathway was associated with increased metastatic burden, and low pJNKT183/Y185 activity correlated with a poorer response to systemic endocrine and CDK4/6 inhibitor therapies in both early-stage and metastatic ER+ breast cancer cohorts. Overall, we demonstrate that suppression of JNK signalling enables persistent growth during combined endocrine therapy and CDK4/6 inhibition. Our data provides the pre-clinical rationale to stratify patients based on JNK pathway activity prior to receiving combination endocrine therapy and CDK4/6 inhibition.

Keywords: CDK4/6 inhibition; ER+ breast cancer; Endocrine therapy; JNK signalling; Palbociclib.


Conflict of interest statement

Declarations. Ethics approval and consent to participate: All animal work was performed in compliance with the Australian Code of Practice for the Care and Use of Animals for Scientific Purposes (National Health and Medical Research Council). The protocol and study end points were approved by the St. Vincent’s Health Precinct and GIMR Animal Ethics Committee (ARA 21/09). Consent for publication: N/A. Competing interests: E. L provides advisory board services to AstraZeneca, Gilead, Lilly, MDS, Novartis, Pfizer, Roche, and received royalties from Walter and Eliza Hall Institute.

Figures

Fig. 1
Fig. 1
CRISPR/Cas9 screens identify JNK pathway deficiency in endocrine therapy + CDK4/6 inhibitor insensitive ER+ breast cancer cells. (A) CRISPR/Cas9 screens were conducted in ER+ MCF-7-Cas9-expressing cells using the human Brunello library. Cells were treated with the combination of 500 nM tamoxifen and 250 nM palbociclib (early: 6 week and late: 10 week timepoint), or 500 nM palbociclib (early: 2 week and late: 4 week timepoint) or vehicle (tetrahydrofuran) before genomic DNA was collected and sequenced (n = 2 biological replicates). (B) Venn diagram showing single guide RNAs (sgRNAs) that increased following treatment with palbociclib and tamoxifen + palbociclib. sgRNAs were selected with a false discovery rate <0.5, and occurrence in ≥3 screens, where at least one screen was with combination therapy. Selected sgRNAs indicated with dashed white line. (C) Gene set enrichment analysis of top sgRNAs with ≥2.5 aggregate β-score. (D) Top sgRNAs enriched following treatment with palbociclib and tamoxifen + palbociclib, and corresponding β-scores (sgRNAs with aggregate β-score ≥5 are shown). Orange * indicates sgRNAs in the JNK pathway. Black * indicates sgRNAs described in the literature to drive CDK4/6 inhibitor resistance. (E) Schematic of the JNK signalling pathway and enriched sgRNAs, as well as aggregate β-score scale. P indicates phosphorylation events
Fig. 2
Fig. 2
MAP2K7 loss leads to reduced JNK phosphorylation and diminished induction of JNK-induced stress response. (A) Representative Western blot of MKK7, MKK4 and GAPDH in MCF-7 pLenti and MAP2K7−/− (MKK7_1 and MKK7_3) cells (full length blots in Supplementary Fig. 2B). (B) Quantitation of MKK7 expression by densitometry. Band intensity normalised to GAPDH. Data analysed by one-way ANOVA with Tukey’s multiple comparisons test. (C) Representative Western blot of MKK7, MKK4 and GAPDH in T-47D pLenti and MAP2K7−/− (MKK7_1 and MKK7_3) cells (full length blots in Supplementary Fig. 2D). (D) Quantitation of MKK7 expression by densitometry. Band intensity normalised to GAPDH. Data analysed by one-way ANOVA with Tukey’s multiple comparisons test. (E) Metastases to lung of MCF-7 pLenti and MKK7_3 xenografts (n = 10 mice per arm) as measured by cytokeratin immunohistochemistry. Number of metastases (mets) quantitated per 1 × 107 µm2 area and analysed by unpaired two-tailed t-test. Representative images shown, scale bar = 200 μm. (F) Representative Western blot of pJNKT183/Y185, JNK and GAPDH in MCF-7 pLenti and MAP2K7−/− (MKK7_1 and MKK7_3) cells (full length blots in Supplementary Fig. 2F). (G) Quantitation of pJNKT183/Y185 activity by densitometry. Band intensity normalised to GAPDH. Data analysed by one-way ANOVA with Tukey’s multiple comparisons test. (H) Representative Western blot of pJNKT183/Y185, JNK and GAPDH in T-47D pLenti and MAP2K7−/− (MKK7_1 and MKK7_3) cells (full length blots in Supplementary Fig. 2H). (I) Quantitation of pJNKT183/Y185 activity by densitometry. Band intensity normalised to GAPDH. Data analysed by one-way ANOVA with Tukey’s multiple comparisons test. (J) Expression of pJNKT183/Y185 in primary ER+ breast cancers from the TCGA cohort compared to MAP2K7 copy number status. MAP2K7 “no loss” (n = 478) includes cancers with amplified, gain or diploid status for MAP2K7. MAP2K7 “loss” (n = 138) includes cancers with heterozygous or homozygous deletion of MAP2K7. Data analysed by unpaired two-tailed t-test. (K) Representative Western blot of pJNKT183/Y185, JNK and GAPDH in MCF-7 pLenti and MAP2K7−/− (MKK7_1 and MKK7_3) cells treated with 300 nM anisomycin for 0, 30, 60, 90 min (full length blots in Supplementary Fig. 2I). (L) Quantitation of pJNKT183/Y185 activity by densitometry. Band intensity normalised to GAPDH. Data analysed by two-way ANOVA with Tukey’s multiple comparisons test. (M) Representative Western blot of pJNKT183/Y185, JNK and GAPDH in T-47D pLenti and MAP2K7−/− (MKK7_1 and MKK7_3) cells treated with 300 nM anisomycin for 0, 30, 60, 90 min (full length blots in Supplementary Fig. 2K). (N) Quantitation of pJNKT183/Y185 activity by densitometry. Band intensity normalised to GAPDH. Data analysed by two-way ANOVA with mixed effects analysis and Tukey’s multiple comparisons test. (O) Representative Western blot of pJNKT183/Y185, JNK2 (detected by JNK antibody), JNK1 and GAPDH in CRISPR/Cas9 MCF-7 cell lines: pLenti, MAPK8−/− and MAPK9−/−. Cells were treated with 300 nM anisomycin for 0, 30, 60, 90 min (full length blots in Supplementary Fig. 2M). (P-Q) JNK1 (P) and JNK2 (Q) expression quantitated at 0 min timepoint. Band intensity normalised to GAPDH. Data analysed by one-way ANOVA with Tukey’s multiple comparisons test. (R) Quantitation of pJNKT183/Y185 activity by densitometry. Band intensity normalised to GAPDH. Data analysed by two-way ANOVA with Tukey’s multiple comparisons test. (S-T) Expression of pJNKT183/Y185 in primary ER+ breast cancers from the TCGA cohort compared to MAPK8 (S) or MAPK9 (T) copy number status. MAPK8 (n = 488) or MAPK9 (n = 545) “no loss” includes cancers with amplified, gain or diploid status for MAPK8 or MAPK9. MAPK8 (n = 384) or MAPK9 (n = 379) “loss” includes cancers with heterozygous or homozygous deletion of MAPK8 or MAPK9. Data analysed by unpaired two-tailed t-test
Fig. 3
Fig. 3
MAP2K7 loss prevents growth arrest and senescence induction following endocrine therapy + CDK4/6 inhibitor treatment (A) Representative Western blot of ERα, MKK7, pJNKT183/Y185, JNK and GAPDH in MCF-7 pLenti and MAP2K7−/− (MKK7_1 and MKK7_3) cells treated with 500 nM tamoxifen + 250 nM palbociclib (tam + palb), 25 nM fulvestrant + 125 nM palbociclib (fas + palb) or vehicle (Absolute ethanol (EtOH) and tetrahydrofuran (THF)) for 48 h (full length blots in Supplementary Fig. 3D). (B) Quantitation of MKK7 expression by densitometry. Band intensity normalised to GAPDH. Data analysed by two-way ANOVA with Tukey’s multiple comparisons test. (C) Quantitation of pJNKT183/Y185 activity by densitometry. Band intensity normalised to GAPDH. Data analysed by two-way ANOVA with Tukey’s multiple comparisons test. (D) Representative Western blot of ERα, MKK7, pJNKT183/Y185, JNK and GAPDH in T-47D pLenti and MAP2K7−/− (MKK7_1 and MKK7_3) cells treated with 500 nM tamoxifen + 250 nM palbociclib (tam + palb), 25 nM fulvestrant + 125 nM palbociclib (fas + palb) or vehicle (EtOH and THF) for 48 h (full length blots in Supplementary Fig. 3F). (E) Quantitation of MKK7 expression by densitometry. Band intensity normalised to GAPDH. Data analysed by two-way ANOVA with Tukey’s multiple comparisons test. (F) Quantitation of pJNKT183/Y185 activity by densitometry. Band intensity normalised to GAPDH. Data analysed by two-way ANOVA with Tukey’s multiple comparisons test. (G) MCF-7 pLenti and MAP2K7−/− (MKK7_1 and MKK7_3) cells treated with 500 nM tamoxifen + 250 nM palbociclib (tam + palb), 25 nM fulvestrant + 125 nM palbociclib (fas + palb) or vehicle (EtOH and THF) and analysed by time-lapse microscopy using an IncuCyte ZOOM over 7 days. Cell count determined by red fluorescent count, and data analysed by two-way ANOVA with Sidak’s multiple comparisons test. Experiment performed in quadruplicate. (H) T-47D pLenti and MAP2K7−/− (MKK7_1 and MKK7_3) cells treated with 500 nM tamoxifen + 250 nM palbociclib (tam + palb), 25 nM fulvestrant + 125 nM palbociclib (fas + palb) or vehicle (EtOH and THF) and analysed by time-lapse microscopy using an IncuCyte ZOOM over 7 days. Cell count determined by red fluorescent count, and data analysed by two-way ANOVA with Sidak’s multiple comparisons test. Experiment performed in triplicate. (I) Representative colony formation from MCF-7 pLenti and MAP2K7−/− (MKK7_1 and MKK7_3) cells treated with 500 nM tamoxifen + 250 nM palbociclib (tam + palb), 25 nM fulvestrant + 125 nM palbociclib (fas + palb) or vehicle (EtOH and THF) for 3 weeks, with colony formation detected with 0.1–0.5% crystal violet stain. (J) Colony formation quantitated using ImageJ. Data analysed by two-way ANOVA with Tukey’s multiple comparisons test. (K) Representative brightfield images of MCF-7 pLenti and MAP2K7−/− (MKK7_1 and MKK7_3) cells treated with 500 nM tamoxifen + 250 nM palbociclib (tam + palb), 25 nM fulvestrant + 125 nM palbociclib (fas + palb) or vehicle (EtOH and THF) for 72 h and stained with senescence-associated β-galactosidase. (L) Quantification of MCF-7 pLenti and MAP2K7−/− cells staining positive for senescence-associated β-galactosidase from (K). Data analysed by two-way ANOVA with Tukey’s multiple comparisons test. Scale bar = 100 μm. (M) Representative brightfield images of T-47D pLenti and MAP2K7−/− (MKK7_1 and MKK7_3) cells treated with 500 nM tamoxifen + 250 nM palbociclib (tam + palb), 25 nM fulvestrant + 125 nM palbociclib (fas + palb) or vehicle (EtOH and THF) for 72 h and stained with senescence-associated β-galactosidase. (N) Quantification of T-47D pLenti and MAP2K7−/− cells staining positive for senescence-associated β-galactosidase from (M). Data analysed by two-way ANOVA with Tukey’s multiple comparisons test. Scale bar = 100 μm
Fig. 4
Fig. 4
MAP2K7 loss alters the transcriptional response to endocrine therapy + CDK4/6 inhibitor treatment (A) Experimental schematic of pLenti and MKK7_3 cells (MCF-7 or T-47D) treated with 500 nM tamoxifen + 250 nM palbociclib (tam + palb), 25 nM fulvestrant + 125 nM palbociclib (fas + palb) or vehicle (Absolute ethanol (EtOH) and tetrahydrofuran (THF)) for 48 h. RNA collected and analysed by RNAseq. (B) Multidimensional scale analysis of RNAseq data of MCF-7 cells +/- treatments, and T-47D cells +/- treatments. (C) Relative change in gene expression between vehicle and treatment (tamoxifen + palbociclib or fulvestrant + palbociclib) of MAP2K7−/− vs. pLenti cells. Boxed regions are genes that are less downregulated, or less upregulated, in MKK7_3 cells compared to pLenti cells. Pearson’s correlation coefficient shown. (D) Analysis of gene set enrichment of hallmark gene sets from genes that show attenuated downregulation (purple dots) or upregulation (orange dots) with treatment in MAP2K7−/− cells, in either MCF-7 or T-47D cell lines. Size of dot is fold enrichment of the signature, with enriched signatures with false discovery rate (FDR) of 0.05. FDR values listed in Supplementary Table 3. (E) Venn spider plots of transcription factors (TFs) commonly deregulated in MAP2K7−/− MCF-7 and MAP2K7−/− T-47D cells that are untreated; veh = vehicle; boxed region contains significantly altered TFs. (F) Venn spider plots of TFs commonly deregulated in MAP2K7−/− MCF-7 and T-47D cells that are treated with combination therapy; tam + palb = 500 nM tamoxifen + 250 nM palbociclib; or fas + palb = 25 nM fulvestrant + 125 nM palbociclib; boxed region contains significantly altered TFs
Fig. 5
Fig. 5
MAP2K7 loss ameliorates AP-1 transcription factor signaling (A) Representative Western blot of p-cJUNSer63, cJUN, JUND and GAPDH in MCF-7 pLenti and MAP2K7−/− (MKK7_1 and MKK7_3) cells treated with 500 nM tamoxifen + 250 nM palbociclib (tam + palb), 25 nM fulvestrant + 125 nM palbociclib (fas + palb) or vehicle (Absolute ethanol (EtOH) and tetrahydrofuran (THF)) for 48 h (full length blots in Supplementary Fig. 5E). (B) Quantitation of p-cJUNSer63 activity by densitometry. Band intensity normalised to GAPDH. Data analysed by two-way ANOVA with Tukey’s multiple comparisons test. (C) Quantitation of cJUN expression by densitometry and normalised to GAPDH. Data analysed by two-way ANOVA with Tukey’s multiple comparisons test. (D) Representative Western blot of p-cJUNSer63, cJUN, JUND and GAPDH in T-47D pLenti and MAP2K7−/− (MKK7_1 and MKK7_3) cells treated with 500 nM tamoxifen + 250 nM palbociclib (tam + palb), 25 nM fulvestrant + 125 nM palbociclib (fas + palb) or vehicle (EtOH and THF) for 48 h (full length blots in Supplementary Fig. 5H). (E) Quantitation of p-cJUNSer63 activity by densitometry. Band intensity normalised to GAPDH. Data analysed by two-way ANOVA with Tukey’s multiple comparisons test. (F) Quantitation of cJUN expression by densitometry and normalised to GAPDH. Data analysed by two-way ANOVA with Tukey’s multiple comparisons test. (G) Schematic of treatment to examine short-term fulvestrant-mediated arrest and release. MCF-7 and T-47D cells were treated with 10 nM fulvestrant for 48 h to induce a cell cycle arrest. Cells were then stimulated to re-enter the cell cycle with 100 nM 17β-estradiol for 12 h and 24 h. (H) Representative Western blot of ERα, MKK7, p-cJUNSer63, cJUN, pJNKT183/Y185, JNK and GAPDH in MCF-7 pLenti and MAP2K7−/− (MKK7_1 and MKK7_3) cells treated with 10 nM fulvestrant (fas) and 100 nM 17β-estradiol (E2) (full length blots in Supplementary Fig. 5M). (I) Quantitation of pJNKT183/Y185 activity by densitometry. Band intensity normalised to GAPDH. Data analysed by two-way ANOVA with Tukey’s multiple comparisons test on duplicate samples. (J) Quantitation of p-cJUNSer63 activity by densitometry. Band intensity normalised to GAPDH. Data analysed by two-way ANOVA with Tukey’s multiple comparisons test on duplicate samples. (K) Quantitation of cJUN expression by densitometry. Band intensity normalised to GAPDH. Data analysed by two-way ANOVA with Tukey’s multiple comparisons test on duplicate samples. (L) Representative Western blot of ERα, MKK7, p-cJUNSer63, cJUN, pJNKT183/Y185, JNK and GAPDH in T-47D pLenti and MAP2K7−/− (MKK7_1 and MKK7_3) cells treated with 10 nM fulvestrant (fas) and 100 nM 17β-estradiol (E2) (full length blots in Supplementary Fig. 5N). (M) Quantitation of pJNKT183/Y185 activity by densitometry. Band intensity normalised to GAPDH. Data analysed by two-way ANOVA with Tukey’s multiple comparisons test on duplicate samples. (N) Quantitation of p-cJUNSer63 activity by densitometry. Band intensity normalised to GAPDH. Data analysed by two-way ANOVA with Tukey’s multiple comparisons test on duplicate samples. (O) Quantitation of cJUN expression by densitometry. Band intensity normalised to GAPDH. Data analysed by two-way ANOVA with Tukey’s multiple comparisons test on duplicate samples
Fig. 6
Fig. 6
Depletion of JNK signalling in ER+ breast cancer, and in endocrine therapy/palbociclib resistance (A) JNK1, pJNK1Y185 (NP_001265477.1), JNK2, pJNK2Y185 (NP_001128516.1) Clinical Proteomic Tumour Analysis Consortium data from the TCGA cohort, showing expression in normal breast tissue (n = 18) and luminal breast cancers (n = 64). Data analysed by unpaired two-tailed t-test. (B) Copy number status of MAP3K11, MAP2K4, MAP2K7, MAPK8, MAPK9, JUN and ESR1 in primary (TCGA; n = 808 and METABRIC; n = 1817) and metastatic (Metastatic Breast Cancer Project; n = 77) cohorts. Data analysed by unpaired two-tailed t-test. (C) Kaplan-Meier curves of the probability of overall survival and progression-free survival in ER+ breast cancers comparing high, medium, and low tertiles of JNK pathway expression, where JNK pathway is MAP2K7, MAPK8 and MAPK9. Kaplan-Meier analysis performed on pooled breast cancer datasets using KMPlotter [79]. P-value calculated by Log-rank (Mantel-Cox) test. (D) Correlation of JNK pathway with the anti-proliferative response of pre-operative palbociclib (POP) trial ER+ breast cancer patients [43]. Anti-proliferative response determined by change in TYMS mRNA expression between initial biopsy and post-treatment (∆TYMS) and correlated with JNK signalling (MAP2K7, MAPK8 and MAPK9). Pearson’s correlation coefficient shown. (E) Immunohistochemistry analysis of advanced metastatic ER+ breast cancer cohort treated with endocrine therapy + CDK4/6 inhibition. Images of FFPE sections with high, medium, and low pJNKT183/Y185 activity. Scale bar = 100 μm. (F) Kaplan-Meier curves of survival in the endocrine + CDK4/6 inhibitor-treated cohort comparing tertiles of low, medium and high pJNKT183/Y185 expression. Significance determined by Log-rank (Mantel-Cox) test. (G) mRNA expression of MAP3K11, MAP2K4, MAP2K7, MAPK8, MAPK9 and JUN stratified into patients who did not develop metastatic disease (no metastasis; n = 107) and patients who did (metastasis; n = 48). Comparisons between metastatic and non-metastatic by Mann-Whitney unpaired two-tailed t-test. (H) Anti-proliferative response of POP trial ER+ breast cancer patients and association with individual JNK pathway genes. Patients with high (n = 64) and low (n = 8) JNK pathway gene expression (MAP3K11, MAP2K4, MAP2K7, MAPK8, MAPK9 and JUN) were stratified based on TYMS anti-proliferative response. Comparisons between high and low by unpaired two-tailed t-test

References

    1. Finn RS, et al. Palbociclib and letrozole in advanced breast Cancer. N Engl J Med. 2016;375:1925–36. 10.1056/NEJMoa1607303. - PubMed
    1. Hortobagyi GN, et al. Ribociclib as First-Line therapy for HR-Positive, advanced breast Cancer. N Engl J Med. 2016;375:1738–48. 10.1056/NEJMoa1609709. - PubMed
    1. Goetz MP, et al. MONARCH 3: abemaciclib as initial therapy for advanced breast cancer. J Clin Oncology: Official J Am Soc Clin Oncol. 2017;35:3638–46. 10.1200/JCO.2017.75.6155. - PubMed
    1. Sledge GW, et al. The effect of abemaciclib plus fulvestrant on overall survival in hormone receptor–positive, ERBB2-negative breast cancer that progressed on endocrine therapy—MONARCH 2: a randomized clinical trial. JAMA Oncol. 2020;6:116–24. - PMC - PubMed
    1. Slamon D, et al. Ribociclib plus fulvestrant for postmenopausal women with hormone receptor-positive, human epidermal growth factor receptor 2-negative advanced breast cancer in the phase III randomized MONALEESA-3 trial: updated overall survival. Ann Oncol. 2021;32:1015–24. - PubMed

MeSH terms