. 2025 Aug 18;15(1):30253.
doi: 10.1038/s41598-025-15475-x.

Trends in antidote use in France from 2015 to 2021: a nationwide poison centers study

Collaborators, Affiliations

Trends in antidote use in France from 2015 to 2021: a nationwide poison centers study

Alix-Marie Pouget et al. Sci Rep. .

Abstract

The French Poison Centers database is a tool of choice for the analysis of poisoning cases requiring the administration of an antidote although not all uses are systematically reported. This national retrospective study aims to report trends of use of antidotes in France over a 7-year period from 2015 to 2021. A total of 25,289 cases of poisoning required the administration of an antidote, among which 46.7% were moderate to severe. While 77.1% of poisonings progressed toward recovery, the observed mortality rate was 1.7%. The 3 most frequently used antidotes according to data from Poison Centers were N-acetylcysteine (n = 13,555 [53.6%]), flumazenil (n = 3102 [12.3%]) and naloxone (n = 1740 [6.9%]) reflecting the most common types of poisoning involving acetaminophen, benzodiazepines, and opioids. The observed use of methylthioninium chloride, hydroxocobalamin, cyanocobalamin and DOAC reversal agents increased, both in terms of absolute numbers and proportions, revealing new behaviors leading to poisoning, such as nitrous oxide consumption. Conversely, the observed use of ethanol-based therapy, L-carnitine, and dantrolene decreased over time, reflecting both current medical practices and shifts in guidelines. This study provides a novel insight into the typology (circumstances, severity, development) of poisonings requiring an antidote, as well as the description of the causative agents.

Keywords: Antidotes; Poison center; Poisonings.


Conflict of interest statement

Declarations. Competing interests: The authors declare no competing interests.

Figures
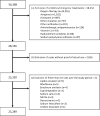
Fig. 1
Fig. 1
Flowchart of the case selection process based on the use of an antidote from the French national database of poisonings.
Fig. 2
Fig. 2
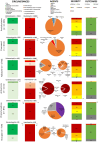
Circumstances, implicated agents, severity and outcomes of poisonings requiring an antidote. The circumstances of poisoning are represented by stacked bar graphs, separating the types of unintentional circumstances from the intentional ones. The subdivisions represent the share (%) of each circumstance in each diagram. The agents involved and their frequencies are represented by pie charts. Severity and outcomes are represented by stacked bar charts. Severity is represented in red when high, orange when moderate, yellow when low, green when absent and gray when unknown. The outcome is represented in red when death, orange when sequelae, green when recovery and gray when unknown.
Fig. 2
Fig. 2
Circumstances, implicated agents, severity and outcomes of poisonings requiring an antidote. The circumstances of poisoning are represented by stacked bar graphs, separating the types of unintentional circumstances from the intentional ones. The subdivisions represent the share (%) of each circumstance in each diagram. The agents involved and their frequencies are represented by pie charts. Severity and outcomes are represented by stacked bar charts. Severity is represented in red when high, orange when moderate, yellow when low, green when absent and gray when unknown. The outcome is represented in red when death, orange when sequelae, green when recovery and gray when unknown.
Fig. 3
Fig. 3
Bar plots representing (A) unintentional circumstances, (B) intentional circumstances, (C) involved agents, (D) severity, and (E) outcomes. Each bar represents the mean proportion of cases for each category, with the observed minimum and maximum values as a proxy for the confidence interval.
Fig. 4
Fig. 4
Trends in antidotes use from 2015 to 2021. (A) Values of antidotes used in at least 500 cases. (B) Proportions of antidotes used in at least 500 cases. (C) Values of antidotes used less than 500 cases. (D) Proportions of antidotes used less than 500 cases.

References

    1. Prevention and management of cases of poisoning. https://www.who.int/teams/environment-climate-change-and-health/chemical... (2024).
    1. Deaths from poisoning, part of the following publication: Esteban Ortiz-Ospina and Max Roser (2016) - “Global Health”. Data adapted from IHME, Global Burden of Disease. https://archive.ourworldindata.org. Our World in Data. https://ourworldindata.org/grapher/deaths-from-poisoning (2025).
    1. Karami M. Principles of toxicotherapy: General & special therapy.
    1. Chacko, B. & Peter, J. V. Antidotes in poisoning. Indian J. Crit. Care Med. Peer-Rev Off. Publ. Indian Soc. Crit. Care Med.23(Suppl 4), S241–S249 (2019). - PMC - PubMed
    1. Al-Sohaim, S. I., Awang, R., Zyoud, S. H., Rashid, S. M. D. & Hashim, S. Evaluate the impact of hospital types on the availability of antidotes for the management of acute toxic exposures and poisonings in Malaysia. Hum. Exp. Toxicol.31(3), 274–281 (2012). - PubMed

LinkOut - more resources