. 2025 Sep;26(9):1501-1515.
doi: 10.1038/s41590-025-02235-2. Epub 2025 Aug 18.

Loss of YTHDF2 enhances Th9 programming and CAR-Th9 cell antitumor efficacy

Affiliations

Loss of YTHDF2 enhances Th9 programming and CAR-Th9 cell antitumor efficacy

Sai Xiao et al. Nat Immunol. 2025 Sep.

Abstract

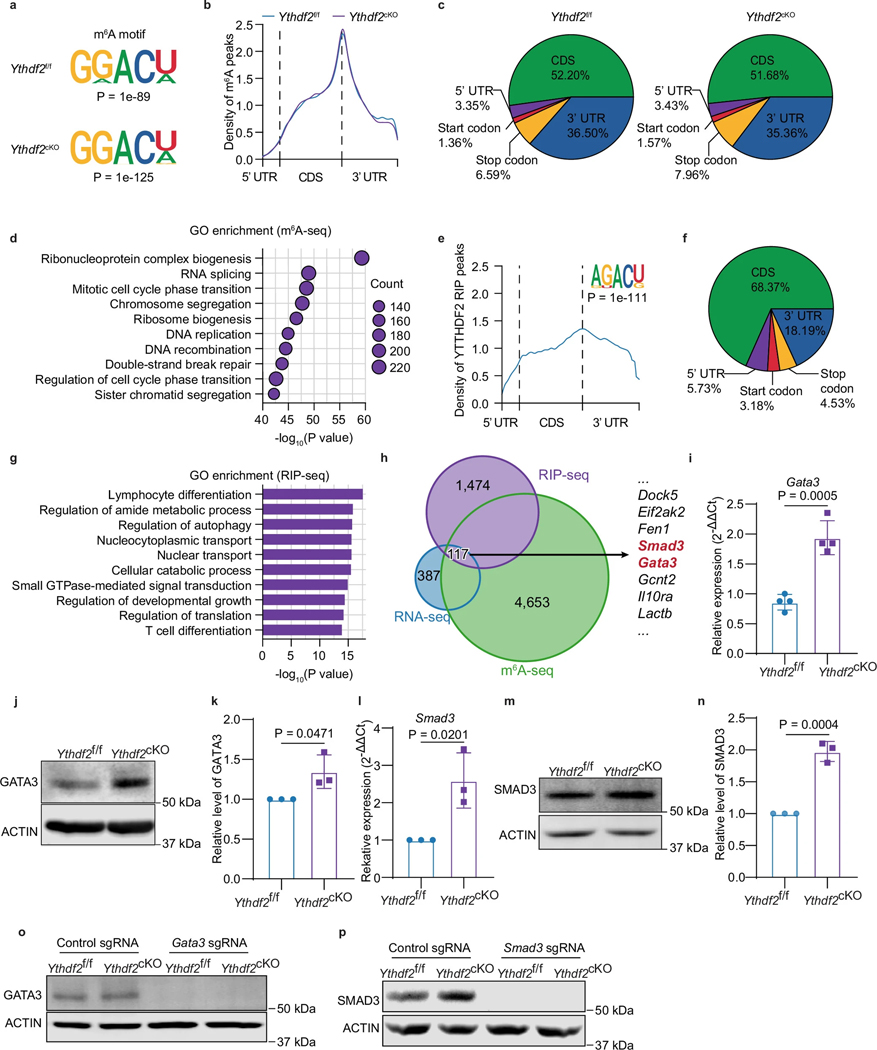
CD4+ T cells differentiate into various subsets, including T helper 1 (Th1), Th2, Th9, Th17 and regulatory T (Treg) cells, which are essential for immune responses and cancer immunotherapy. However, the role of RNA N6-methyladenosine (m6A) modification in this differentiation is unclear. Here we show that YTHDF2, an important m6A reader protein known to destabilize m6A-modified mRNA, negatively regulates Th9 cell differentiation. Ablation of Ythdf2 in both mouse and human naive CD4+ T cells promotes Th9 differentiation by stabilizing Gata3 and Smad3 mRNA under interleukin-4 (IL-4) and transforming growth factor β (TGF-β) signaling, respectively. Ythdf2-deficient Th9 cells produce increased amounts of IL-9 and IL-21, leading to increased tumor infiltration and cytotoxicity by CD8+ T cells and natural killer (NK) cells, thereby improving antitumor activity compared with wild-type Th9 cells. Moreover, YTHDF2 depletion in CAR-Th9 cells enhances their immune activation, reduces their terminal differentiation and augments their antitumor efficacy. Targeting YTHDF2 is thereby a promising strategy to enhance Th9 and CAR-Th9 cell-based cancer immunotherapies.


Conflict of interest statement

Competing interests: The authors declare no competing interests.

Figures

Extended Data Fig. 1
Extended Data Fig. 1. YTHDF2 deficiency does not affect Th1, Th2, Th17, and Treg cell differentiation.
(a) YTHDF2 and β-actin expression in mouse wild-type (WT) and Ythdf2-knockout (KO) naive CD4+ T cells, determined by immunoblotting. Images are representatives of at least three independent experiments. (b-e) Representative plots of IFN-γ, IL-13, IL-17A, and FOXP3 expression in WT or Ythdf2-KO Th1 (b), Th2 (c), Th17 (d), and Treg (e) cells on the 5th day after differentiation. (f, g) Representative plots and percentage of IL-2 (f) and IL-21 (g) production from WT (Ythdf2+/+) or Ythdf2−/− Th9 cells on the 5th day after differentiation (n = 3 mice). Data are represented as means ± SD. Statistical analysis was performed using unpaired two-tailed t-tests (f right and g right).
Extended Data Fig. 2
Extended Data Fig. 2. Ythdf2cKO mice have normal T cell development.
(a) YTHDF2 and β-actin expression in mouse naive CD4+ T cells isolated from Ythdf2f/f and Ythdf2cKO mice, determined by immunoblotting (n = 4 mice). (b-k) Flow cytometric analysis of the frequencies of the indicated lymphoid immune cells in the thymus (b, c), spleen (d-g), and peripheral lymph nodes (h-k) of Ythdf2f/f and Ythdf2cKO mice. Data are presented as representative plots (a, c, e, g, and i) and summary bar graphs (b, d, f, h, and j) (n = 4 mice). Data are represented as means ± SD. Statistical analysis was performed using unpaired two-tailed t-tests (D and F) or the one-way ANOVA model (b, h, and j). DP, double positive; DN, double negative. Tn, naive T cells; Tcm, central memory T cells; Teff, effector T cells.
Extended Data Fig. 3
Extended Data Fig. 3. YTHDF2 deficiency in mice does not affect Th1, Th2, Th17, and Treg differentiation.
(a-h) Flow cytometric analysis of the frequencies of the indicated protein expression in Ythdf2f/f and Ythdf2cKO Th1 (a, b), Th2 (c, d), Th17 (e, f), and Treg cells (g, h). Data are presented as representative plots (a, c, e, and g) and summary bar graphs (b, d, f, and h) (n = 3 mice). (i-l) Representative plots and percentage of IL-2 (i, j) and IL-21 (k, l) production from Ythdf2f/f and Ythdf2cKO Th9 cells on the 5th day after differentiation (n = 3 mice). (m, n) Representative plots (m) and percentage (n) of WT (Ythdf2+/+) or Ythdf2−/− Tc9 cells on the 5th day after differentiation (n = 5 mice). Data are represented as means ± SD. Statistical analysis was performed using unpaired two-tailed t-tests (b, d, f, h, j, l, and n).
Extended Data Fig. 4
Extended Data Fig. 4. Transcriptome-wide RNA-seq, m6A-seq, and RIP-seq assays in murine Th9 cells.
(a) The m6A motif was detected by the HOMER motif discovery tool with m6A-seq data. (b) Density distribution of the m6A peaks across the mRNA transcriptome from m6A-seq data. (c) The proportion of m6A peak distribution in Th9 cells from Ythdf2f/f and Ythdf2cKO mice. (d) GO analysis of transcripts with m6A peaks. (e) Density distribution of the YTHDF2-binding sites across the mRNA transcriptome from RIP-seq data. (f) The proportion of YTHDF2-binding site distribution from RIP-seq data. (g) Top 10 GO clusters from GO analysis of YTHDF2 target genes from RIP-seq data. (h) Venn plot showing an overlapping analysis of genes identified by RNA-seq (upregulated genes), m6A-seq, and RIP-seq. (i) qPCR analysis of mRNA expression of Gata3 in Ythdf2f/f and Ythdf2cKO Th9 cells after intrasample normalization to the reference gene 18S (n = 4 biological replicates). (j and k) Immunoblot analysis of GATA3 in whole-cell lysates of naive Ythdf2f/f and Ythdf2cKO CD4+ T cells cultured under Th9 conditions (n = 3 biological replicates). (l) qPCR analysis of mRNA expression of Smad3 in Ythdf2f/f and Ythdf2cKO Th9 cells after intrasample normalization to the reference gene 18S (n = 3 biological replicates). (m and n) Immunoblot analysis of SMAD3 in whole-cell lysates of naive Ythdf2f/f and Ythdf2cKO CD4+ T cells cultured under Th9 conditions (n = 3 biological replicates). (o and p) GATA3, SMAD3 and β-actin expression in Gata3 (o) or Smad3 (p) knockout Ythdf2f/f Th9 cells, as well as in Ythdf2cKO Th9 cells, determined by immunoblotting. Data are represented as means ± SD. Statistical analysis was performed using unpaired two-tailed t-tests (i, k, l, and n). P values in a, d, e, and g were determined by a hypergeometric test.
Extended Data Fig. 5
Extended Data Fig. 5. Smad3 and Gata3 interaction promotes Th9 cell differentiation.
(a) Luciferase reporter assay showing that Gata3 alone, or Smad3 alone, or their combination did not activate Il9 gene transcription without p65 in 293T cells (n = 3 biological replicates). (b) Luciferase reporter assay showing that Irf4 alone, or Pu.1 alone, or their combination did not activate Il9 gene transcription without p65 in 293T cells (n = 3 biological replicates). (c) Luciferase reporter assay showing that Irf4 and/or Pu.1 activates Il9 gene transcription in the presence of p65 in 293T cells (n = 3 biological replicates). (d, e) Binding of Smad3 to the Il9 promoter in Smad3, Smad3 and Gata3 overexpressed 293T cells was determined by ChIP-qPCR (n = 3 biological replicates). Data are represented as the mean ± SD. Statistical analysis was performed using unpaired two-tailed t-tests (d, e), or two-way ANOVA models with P values adjusted for multiple comparisons by Holm-Šídák method (a, b). For statistical analysis in (c), luciferase reporter assay results were log2-transformed after adding a pseudo count of 1 to each value to stabilize variance and account for zero values, and then two-way ANOVA models with P values adjusted for multiple comparisons by Holm-Šídák method.
Extended Data Fig. 6
Extended Data Fig. 6. Ythdf2cKO Th9 cells don’t affect mast cells, macrophages, and MDSCs.
(a) qPCR analysis of mRNA expression of Gzmb in Ythdf2f/f and Ythdf2cKO Th9 cells after intrasample normalization to the reference gene 18S (n = 4 mice). (b, c) Tumor growth in NSG (b; n = 3 mice) and Rag2−/−Il2gc−/−(c; n = 4 mice) mice that were s.c. inoculated with B16-OVA tumor cells and then adoptively transferred with Ythdf2f/f and Ythdf2cKO Th9 cells. (d-p) Flow cytometric analysis of tumor-infiltrating mast cells (d-g, n = 5 mice), macrophages (i-k: n = 4 mice; l: n = 5 mice), and MDSCs (n-p; n = 4 mice), and IHC staining analysis of tumor-infiltrating mast cells (h; n = 3 biological replicates), macrophages (m; n = 5 independent replicates) in B16-OVA tumor-bearing mice that received adoptive transfer of either OT-II Ythdf2f/f or Ythdf2cKO Th9 cells. Scale bar, 100 μm (m, n). Data are presented as representative plots, summary graphs, and the absolute number of per gram tumors. Data are represented as the mean ± SD. Statistical analysis was performed using unpaired two-tailed t-tests (a, e, f, h, i, k, and l), or two-way ANOVA models with P values adjusted for multiple comparisons by Holm-Šídák method (b, c).
Extended Data Fig. 7
Extended Data Fig. 7. Ythdf2cKO Th9 cells enhance cytotoxic CD8+ T cell infiltration.
(a) Representative plots (left), summary graphs (right) of tumor-infiltrating perforin+GZMB+ CD8+ T cells in B16-OVA tumor-bearing mice, by flow cytometric analysis (n = 5 mice). (b-g) Representative plots (b, e), summary graphs (c, n = 4 mice; f, n = 5 mice), and the absolute number of per gram tumors (d, n = 4 mice; g, n = 5 mice) of tumor-infiltrating CD8+ T cells, as indicated in different tumor-bearing mice, by flow cytometric analysis. (h-m) Representative plots (h, k), summary graphs (i, n = 4 mice; l, n = 5 mice), and the absolute number of per gram tumors (j, n = 4 mice; m, n = 5 mice) of tumor-infiltrating IFN-γ+CD8+ T cells, as indicated in different tumor-bearing mice, by flow cytometric analysis. Data are represented as means ± SD. Statistical analysis was performed using unpaired two-tailed t-tests.
Extended Data Fig. 8
Extended Data Fig. 8. YTHDF2-deficient Th9 cells enhance the infiltration of NK cells.
(a, b) Flow cytometric analysis of tumor-infiltrating NK cells, as indicated in LLC1-OVA (a; n = 4 mice) and E0771-OVA (b; n = 5 mice) tumor-bearing mice that received adoptive transfer of either Ythdf2f/f or Ythdf2cKO Th9 cells. Data are presented as representative plots (left panels), summary graphs (middle panels), and the absolute number of per gram tumors (right panels). (c, d) Flow cytometric analysis of tumor-infiltrating IFN-γ+ NK cells, as indicated in different tumor-bearing mice (c, n = 4 mice; d, n = 5 mice). Data are presented as representative plots (left panels), summary graphs (middle panels), and the absolute number of per gram tumors (right panels). Data are represented as means ± SD. Statistical analysis was performed using unpaired two-tailed t-tests.
Extended Data Fig. 9
Extended Data Fig. 9. YTHDF2-deficient Th9 cells enhance the effector function of NK cells in Rag1−/− mice.
(a-d) (a, b) Flow cytometric analysis of tumor-infiltrating NK cells, as indicated in B16-OVA tumor-bearing Rag1−/− mice and (c, d) in EO771-OVA tumor-bearing mice. Data are presented as representative plots (left panels), summary graphs (middle panels), and the absolute number of per gram tumors (right panels) (a, c n = 4 mice; b, d, n = 5 mice). (e) The ability of NK cells to lyse B16F10 tumor cells in the presence of either Ythdf2f/f or Ythdf2cKO Th9 cells, measured by real-time cell analysis (n = 3 mice). Data are represented as the mean ± SD (a, b, c, and d) or the mean (e). Statistical analysis was performed using unpaired two-tailed t-tests (a, b, c, d).
Extended Data Fig. 10
Extended Data Fig. 10. YTHDF2 deficiency promotes the differentiation of Th9 cells in humans.
(a) Representative plots and percentage of human YTHDF2+/+ and YTHDF2−/− Tc9 cells on the 7th day after differentiation (n = 5 independent donors). (b, c) Flow cytometric analysis of the anti-PSCA (b; n = 5 independent donors) or anti-EGFR (c; n = 4 independent donors) CAR transduction efficacy of human YTHDF2+/+ and YTHDF2−/− CAR-Th9 cells. Data are presented as representative plots (left panels) and summary graphs (right panels). (d, e) Flow cytometric analysis of the IL-9 production in YTHDF2+/+ or YTHDF2−/− CAR-Th9 cells. Data are presented as representative plots (left panels) and summary graphs (right panels) (d, n = 5 independent donors; e, n = 4 independent donors). (f, g) The ability of human YTHDF2+/+ or YTHDF2−/− anti-EGFR CAR-Th9 to lyse A549 or Capan-1 tumor cells, measured by real-time cell analysis (representative of 2 experiments, showing the mean cell index). (h) Schematic of primary tumor growth assay involving NSCLC cells. (i) Tumor growth of established tumor cells, as described in f. Tumor volumes were measured every 4 days (one experiment was performed with n = 4 mice). (j) Schematic of primary tumor growth assay involving PDAC cells. (k) Tumor growth of established tumor cells, as described in H. Tumor volumes were measured every 4 days (one experiment was performed with n = 4 mice). Data in (i,k) show the mean plus SD. Statistical analysis was performed using paired two-tailed t-tests (a-e) and two-way ANOVA with a mixed-effects model with P values adjusted for multiple comparisons by Holm-Šídák method (i, k).
Fig. 1.
Fig. 1.. YTHDF2 deficiency enhances Th9-cell differentiation in mice.
(A and B) Representative plots (a) and percentage (b) of WT (Ythdf2+/+) or Ythdf2−/− Th9 cells on the 5th day after differentiation (n = 4 mice). (c) Enzyme-linked immunosorbent assay (ELISA) analysis of the expression of secreted IL-9 protein from Ythdf2+/+ or Ythdf2−/− Th9 cell culture supernatants (n = 4 mice). (d) qPCR analysis of mRNA expression of Il2, Il9, and Il21 in WT or Ythdf2−/− Th9 cells after intrasample normalization to the reference gene 18S (n = 3 biological replicates). (e, f) Representative plots (e) and percentage (f) of Ythdf2f/f and Ythdf2cKO Th9 cells on the 5th day after differentiation (n = 7 mice). (g) ELISA analysis of the expression of secreted IL-9 protein from Ythdf2f/f and Ythdf2cKO Th9 cell culture supernatants (n = 7 mice). (h) qPCR analysis of mRNA expression of Il2, Il9, and Il21 in Ythdf2f/f and Ythdf2cKO Th9 cells after intrasample normalization to the reference gene 18S (n = 4 biological replicates). (i) Volcano plot showing the differentially expressed genes (DEGs) between Ythdf2f/f and Ythdf2cKO Th9 cells. Genes with a log2 (fold change) of ≥ 0.25 or ≤ −0.25 and P value < 0.05 were considered as DEGs. FC, fold change. DEGs were identified using the negative binomial model. (j) GO clusters of up-regulated DEGs in RNA-seq data. (k to l) Bar plot of DEGs between Ythdf2f/f and Ythdf2cKO Th9 cells from RNA-seq grouped by cytokines and receptors (k), transcription factors (l), and inhibitory receptors (m). (n-p) GSEA results of the T cell activation involved in immune response gene (n), NK cell activation gene (o), and T cell-mediated immune response to tumor cell gene (p) in mouse Ythdf2f/f and Ythdf2cKO Th9 cells from RNA-seq. NES, normalized enrichment score. Data in (b, c, d, f, g, and h) are represented as the means ± SD. Statistical analysis was performed using unpaired two-tailed t-tests (b, c, d, f, g, and h). P values in j, n, o, and p were determined by a hypergeometric test.
Fig. 2.
Fig. 2.. Loss of YTHDF2 promotes Th9 cell differentiation via Gata3 and Smad3.
(a, b) Representative plots (a) and percentage (b; n = 3 mice) of the IL-9 expression by CD4+ T cells from Ythdf2f/f and Ythdf2cKO mice under stimulation with IL-4, TGF-β, or their combinations in the presence of IL-2 and anti-mouse IFN-γ. (c, d) Representative plots (c) and summary graphs (d; n = 3 mice) showing the IL-9 expression by CD4+ T cells from Ythdf2f/f and Ythdf2cKO mice under stimulation with different doses of IL-4 in the presence of TGF-β. (e, f) Representative plots (e) and summary graphs (f; n = 3 mice) showing the IL-9 expression by CD4+ T cells from Ythdf2f/f and Ythdf2cKO mice under stimulation with different doses of TGF-β in the presence of IL-4. (g, h) Representative plots (g) and summary graphs (h; n = 3 mice) showing IL-9 expression by CD4+ T cells from Ythdf2f/f and Ythdf2cKO mice stimulated with IL-4 and TGF-β in the presence of a neutralizing IL-4 antibody. (i, j) Representative plots (i) and summary graphs (j; n = 3 mice) showing the IL-9 expression by CD4+ T cells from Ythdf2f/f and Ythdf2cKO mice stimulated with IL-4 and TGF-β in the presence of a neutralizing TGF-β antibody. (k, l) Representative plots (k) and summary graphs (l; n = 3 mice) of IL-9 expression in Gata3 KO Th9 cells. (m, n) Representative plots (m) and summary graphs (n; n = 3 mice) of IL-9 expression in Smad3 KO Th9 cells. Naïve CD4+ T cells from Ythdf2f/f and Ythdf2cKO mice were subjected to Gata3 (k, l) or Smad3 (m, n) knockout using the CRISPR-Cas9 system and then differentiated into Th9 cells over 5 days in the presence of IL-4 and TGF-β. Data in (b, d, f, h, j, i, and n) are represented as means ± SD. Statistical analysis was performed using unpaired two-tailed t-tests (b, h, j, l, and n) or two-way ANOVA models with P values adjusted for multiple comparisons by Holm-Šídák method (d, f).
Fig. 3.
Fig. 3.. Gata3 and Smad3 cooperatively regulate Il9 promoter activity in the presence of p65.
(a, b) Distribution of m6A peaks and YTHDF2-binding peaks across Gata3 (a) and Smad3 (b) by Integrative Genomics Viewer. (c-f) Immunoprecipitation (IP) using either an antibody to m6A (c, d) or YTHDF2 (e, f), followed by qPCR in Th9 cells, revealed that the Gata3 site (c, e) or Smad3 site (d, f) in the 3′UTR or coding region was m6A-methylated and enriched in YTHDF2 binding. Rabbit IgG served as a control. Enrichment of the indicated genes was normalized based on the input (n = 3 biological replicates). (g, h) The mRNA half-life (t1/2) of Gata3 (g; n = 7 biological replicates) and Smad3 (h; n = 3 biological replicates) transcripts in Ythdf2f/f and Ythdf2cKO Th9 cells. The analysis involved fitting a linear regression model using log(y) versus time, followed by the transfer back to the nonlinear regression model through an exponential function. Slopes (decay rate) were compared within the full linear regression model using a two-tailed t-test. (i, j) Luciferase reporter assay showing that Gata3 and Smad3 activate Il9 gene transcription in the presence of p65 in HEK-293T cells (i) and in mouse CD4+ T cells (j) (n = 3 biological replicates). (k, l) Gata3 and/or Smad3 were overexpressed in 293T cells (k) or in mouse CD4+ T cells (l). Lysates underwent IP with indicated antibodies or IgG isotype control and immunoblotted (IB) with indicated antibodies. (m) Scheme denoting putative Gata3- or Smad3-binding sites in the Il9 promoter. (n, o) Binding of Gata3 to the Il9 promoter in 293T cells expressing Gata3 or co-expressing Gata3 and Smad3 was determined by ChIP-qPCR (n = 3 biological replicates). Data in (c, d, e, f, i, j, n, and o) are represented as the mean ± SD. Statistical analysis was performed using unpaired two-tailed t-tests (c, d, e, f, n, and o). For statistical analysis in (i) and (j), luciferase reporter assay results were log2-transformed after adding a pseudo count of 1 to each value to stabilize variance and account for zero values, and then two-way ANOVA models with P values adjusted for multiple comparisons by Holm-Šídák method.
Fig. 4.
Fig. 4.. Ythdf2-deficient Th9 cells show higher anti-tumor efficacy in vivo.
(a-c) Tumor growth in C57BL/6 mice that were s.c. inoculated with B16-OVA (a; n = 4 mice), LLC1-OVA (b; n = 4 mice), and E0771-OVA (c; n = 5 mice) tumor cells and then OT-II Ythdf2f/f and Ythdf2cKO Th9 cells were adoptively transferred via i.v. injection 5 days after the tumor was implanted. (d and e) Tumor growth in C57BL/6 mice that were s.c. inoculated with B16-OVA melanoma cells and received adoptive transfer of either OT-II Ythdf2f/f or Ythdf2cKO Th9 cells via i.v. injection 5 days after tumor implanted and then i.p. injected with anti–IL–9 (d; n = 4 mice) or anti-IL-21 receptor (e; n = 4 mice) or anti-IgG antibody every 3d starting from tumor implantation. (f) Tumor growth in C57BL/6 mice that were s.c. inoculated with B16-OVA melanoma cells and received adoptive transfer of either OT-II Ythdf2f/f or Ythdf2cKO Th9 cells via i.v. injection 5 days after the tumor was implanted (n = 5 mice). Data in (a, b, c, d, and e) show the mean ± SD. Statistical analysis was performed using two-way ANOVA with a mixed-effects model with P values adjusted for multiple comparisons by Holm-Šídák method (a-f).
Fig. 5.
Fig. 5.. Ythdf2-deficient Th9 cells enhance DCs, CD8+ T, and NK cell infiltration.
(a-c) Flow cytometric analysis of tumor-infiltrating DCs in B16-OVA tumor-bearing mice that received adoptive transfer of either Ythdf2f/f or Ythdf2cKO Th9 cells. Data are presented as representative plots (a), summary graphs (b), and the absolute number of per gram tumors (c) (n = 4 mice). (d-f) Flow cytometric analysis of tumor-infiltrating CD8+ T cells. Data are presented as representative plots (d), summary graphs (e), and the absolute number of per gram tumors (f) (n = 4 mice). (g-i) Flow cytometric analysis of tumor-infiltrating IFN-γ+CD8+ T cells. Data are presented as representative plots (g), summary graphs (h), and the absolute number of per gram tumors (i) (n =4 mice). (j-l) Flow cytometric analysis of tumor-infiltrating NK cells. Data are presented as representative plots (j), summary graphs (k), and the absolute number of per gram tumors (l) (n =4 mice). (m-o) Flow cytometric analysis of tumor-infiltrating IFN-γ+ NK cells. Data are presented as representative plots (m), summary graphs (n), and the absolute number of per gram tumors (o) (n =4 mice). Data are represented as means ± SD. Statistical analysis was performed using unpaired two-tailed t-tests (b, c, e, f, h, i, k, l, n, and o).
Fig. 6.
Fig. 6.. Ythdf2-deficient Th9 cells show higher anti-tumor efficacy.
(a, b) Tumor growth curves of Rag1−/− mice inoculated with B16-OVA (a; n = 4 mice) or E0771-OVA (b; n = 5 mice) and adoptively transferred with OT-II Ythdf2f/f and Ythdf2cKO Th9 cells. (c) Tumor growth in Rag1−/− mice inoculated with B16F10 melanoma cells, transferred with Ythdf2f/f Th9 cells or Ythdf2cKO Th9 cells, and treated every 7 days with anti-NK1.1 or control antibody (n = 4 mice). (d, e) Representative plots (d) and summary graphs (e) of IFN-γ production by NK cells cocultured with B16F10 tumor cells in the presence of Ythdf2f/f or Ythdf2cKO Th9 cells (n = 3 biological replicates). (f) Cytotoxicity of NK cells isolated from tumors of mice transferred with Ythdf2f/f or Ythdf2cKO Th9 cells, cocultured with B16F10 at a E: T ratio of 1:1 (n = 5 mice). (g) Cytotoxicity of CD8+ T cells isolated from tumors of mice transferred with Ythdf2f/f or Ythdf2cKO Th9 cells, cocultured with B16-OVA at a E: T ratio of 10:1 (n = 5 mice). (h) Tumor growth in C57BL/6 mice inoculated with B16-OVA and transferred with OT-II Ythdf2f/f or Ythdf2cKO Th9 cells, receiving anti-CD8 or control antibody every 7 days (n = 3 mice). (i) Antigen presentation activity of DCs isolated from tumors of mice transferred with Ythdf2f/f or Ythdf2cKO Th9 cells and cocultured with OT-1 T cells at a ratio of E: T 1:5. The antigen presentation activity was determined by the IFN-γ production (n = 5 mice). (j) Tumor growth in Batf3+/+ and Batf3−/− mice inoculated with B16-OVA cells, then transferred with OT-II Ythdf2f/f or Ythdf2cKO Th9 cells (n = 5 mice). Data are represented as means ± SD. Statistical analysis was performed using unpaired two-tailed t-tests (f, g, and i), or using one-way ANOVA models with P values adjusted for multiple comparisons by Holm-Šídák method (e), or two-way ANOVA with a mixed-effects model with P values adjusted for multiple comparisons by Holm-Šídák method (a-c, h, and j).
Fig. 7.
Fig. 7.. YTHDF2 deficiency promotes the differentiation of human Th9 cells.
(a, b) Representative plots (a) and percentage (b) of YTHDF2+/+ or YTHDF2−/− Th9 cells after differentiation (n = 8 independent donors). (c) ELISA analysis of the expression of secreted IL-9 protein from YTHDF2+/+ or YTHDF2−/− Th9 cell culture supernatants (n = 8 independent donors). (d) qPCR analysis of mRNA expression of IL2, IL9, and IL21 in YTHDF2+/+ or YTHDF2−/− Th9 cells after intrasample normalization to the reference gene 18S (n = 4 biological replicates). (e) Volcano plot showing the DEGs between human YTHDF2+/+ or YTHDF2−/− Th9 cells. Genes with a log2 (fold change) of ≥ 0.2 or ≤ −0.2 and adjusted P value < 0.05 were considered as DEGs. DEGs were identified using the negative binomial model. (f) GO clusters of up-regulated DEGs in RNA-seq data. (g-i) Bar plot of differentially expressed genes between human YTHDF2+/+ or YTHDF2−/− Th9 cells from RNA-seq grouped by cytokines and receptors (g), transcription factors (h), and inhibitory receptors (i). (j-l) GSEA results of the adaptive immune response gene (j), positive regulation of innate immune response gene (k), and immune effector process gene (l) in human YTHDF2+/+ or YTHDF2−/− Th9 cells from RNA-seq. NES, normalized enrichment score. Data in (b, c, and d) are represented as means ± SD. Statistical analysis was performed using paired two-tailed t-tests (b, c) or an unpaired two-tailed t-test (d). P values in f, j, k, and l were determined by a hypergeometric test.
Fig. 8.
Fig. 8.. YTHDF2-deficient CAR-Th9 cells exhibit enhanced antitumor activity.
(a) Experimental design for primary tumor growth assay using the PDAC cell line Capan-1. (b) Growth of established tumor cells, as described in a (n = 5 mice). (c) Experimental design for primary tumor growth assay using the NSCLC cell line A549. (d) Growth of established tumor cells, as described in c (n = 5 mice). (e) Experimental design for primary tumor growth assay using the PDAC cell line Capan-1 in humanized mice. (f) Growth of established tumor cells, as described in e (tumor only: n = 3 mice; YTHDF2+/+ and YTHDF2−/−: n = 4 mice). (g, h) Flow cytometric analysis of tumor-infiltrating anti-EGFR CAR-Th9 cells in A549 (g) or anti-PSCA CAR-Th9 cells in Capan-1 (h) tumor-bearing mice. Representative plots (left) and summary graphs (right) are shown (n = 5 mice). (i, j) Flow cytometric analysis of IFN-γ+CD8+ T cells in tumors from A549 (i) and Capan-1 (j) tumor-bearing mice. Representative plots (left) and summary graphs (right) are shown (n = 5 mice). (k) Experimental design for primary tumor growth assay using PDAC cell line Capan-1 in CD8-depleted humanized mice. (l) Growth of established tumor cells, as described in k (n = 5 mice). Data are represented as means ± SD. Statistical analysis was performed using the unpaired two-tailed t-tests (g, h, i, and j), and two-way ANOVA with a mixed-effects model with P values adjusted for multiple comparisons by Holm-Šídák method (b, d, f, and l).

References

    1. Gerlach K et al. TH9 cells that express the transcription factor PU.1 drive T cell–mediated colitis via IL-9 receptor signaling in intestinal epithelial cells. Nature immunology 15, 676–686, doi: 10.1038/ni.2920 (2014). - DOI - PubMed
    1. Végran F et al. The transcription factor IRF1 dictates the IL-21-dependent anticancer functions of TH9 cells. Nature immunology 15, 758–766, doi: 10.1038/ni.2925 (2014). - DOI - PubMed
    1. Xue G et al. Adoptive cell therapy with tumor-specific Th9 cells induces viral mimicry to eliminate antigen-loss-variant tumor cells. Cancer cell 39, 1610–1622.e1619, doi: 10.1016/j.ccell.2021.09.011 (2021). - DOI - PMC - PubMed
    1. Dardalhon V et al. IL-4 inhibits TGF-beta-induced Foxp3+ T cells and, together with TGF-beta, generates IL-9+ IL-10+ Foxp3(−) effector T cells. Nature immunology 9, 1347–1355, doi: 10.1038/ni.1677 (2008). - DOI - PMC - PubMed
    1. Veldhoen M et al. Transforming growth factor-beta ‘reprograms’ the differentiation of T helper 2 cells and promotes an interleukin 9-producing subset. Nature immunology 9, 1341–1346, doi: 10.1038/ni.1659 (2008). - DOI - PubMed

Methods-only references

    1. Lu T et al. Off-the-shelf CAR natural killer cells secreting IL-15 target spike in treating COVID-19. Nature communications 13, 2576, doi: 10.1038/s41467-022-30216-8 (2022). - DOI - PMC - PubMed
    1. Xiao S et al. The tumor-intrinsic role of the m(6)A reader YTHDF2 in regulating immune evasion. Sci Immunol 9, eadl2171, doi: 10.1126/sciimmunol.adl2171 (2024). - DOI - PMC - PubMed
    1. Ma S et al. An XBP1s-PIM-2 positive feedback loop controls IL-15-mediated survival of natural killer cells. Science immunology 8, eabn7993, doi: 10.1126/sciimmunol.abn7993 (2023). - DOI - PMC - PubMed
    1. Dobin A et al. STAR: ultrafast universal RNA-seq aligner. Bioinformatics (Oxford, England) 29, 15–21, doi: 10.1093/bioinformatics/bts635 (2013). - DOI - PMC - PubMed

MeSH terms