

Global, regional, and national burden of colorectal cancer associated with diet high in red meat, 1990 to 2021: an analysis for the global burden of disease study and prediction to 2036
- PMID: 40826342
- PMCID: PMC12359969
- DOI: 10.1186/s12889-025-23712-1
Global, regional, and national burden of colorectal cancer associated with diet high in red meat, 1990 to 2021: an analysis for the global burden of disease study and prediction to 2036
Abstract
Objective: To evaluate the global, regional, and national burden of colorectal cancer (CRC) attributable to diets high in red meat from 1990 to 2021, project trends to 2036, and stratify findings by age, sex, and Sociodemographic Index (SDI).
Methods: Data on CRC burden associated with diet high in red meat were extracted from the Global Health Data Exchange (GHDx). Age-standardized rates (ASR) and estimated annual percentage change (EAPC) were calculated to assess temporal trends. Inequality slope and concentration indices quantified health disparities, while decomposition analyses identified drivers of burden changes. A Bayesian age-period-cohort (BAPC) model projected future trends through 2036.
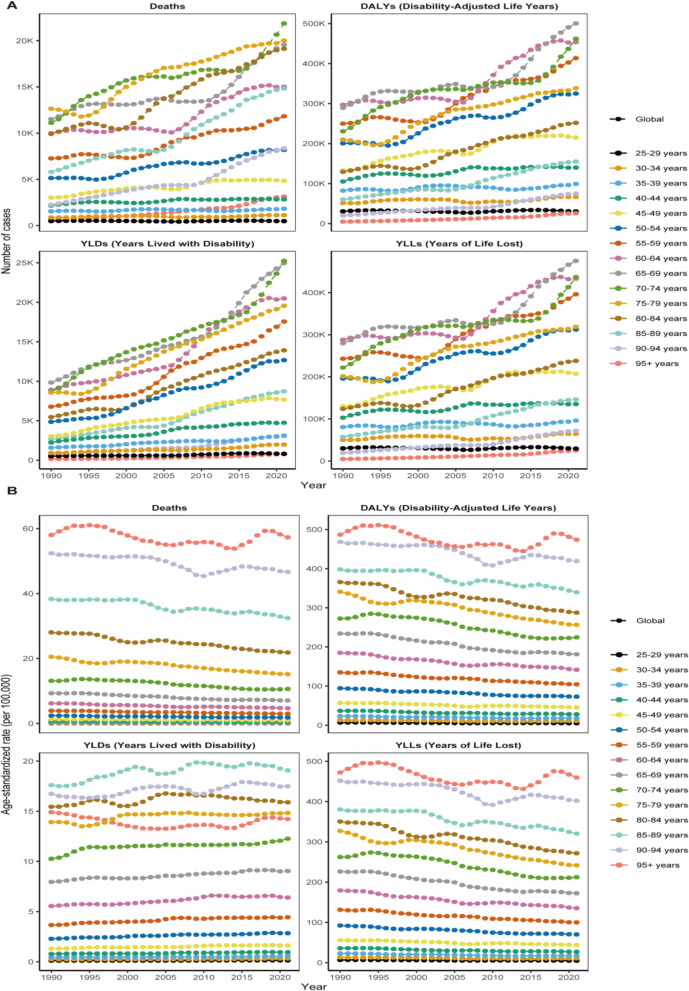
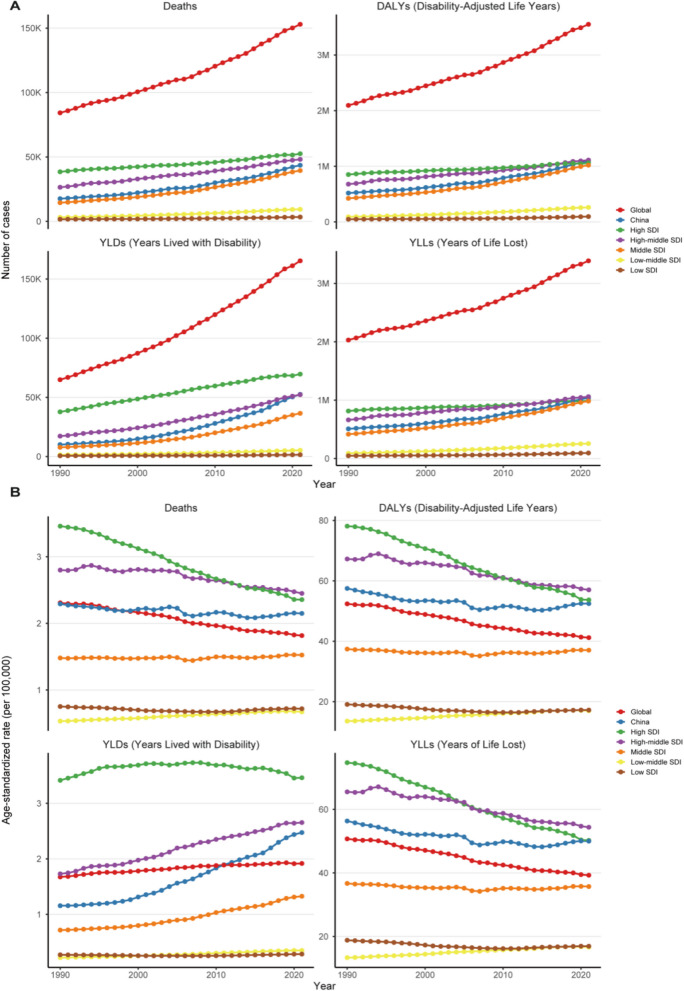
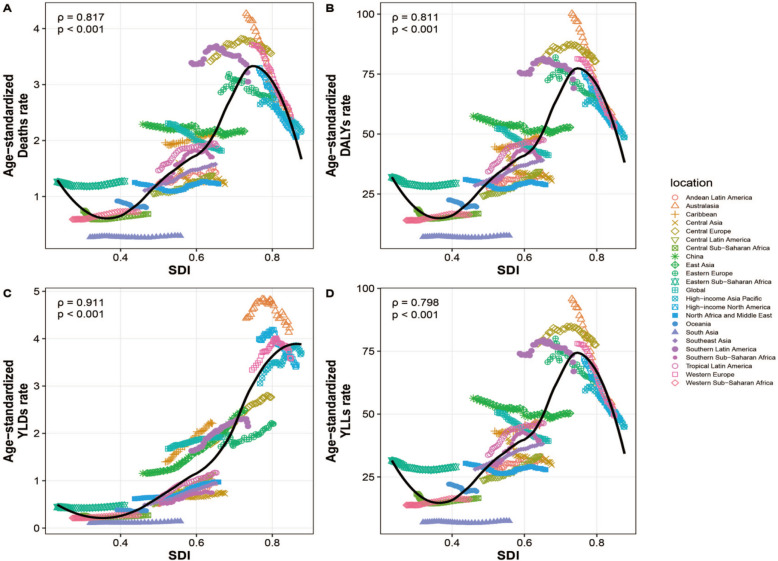
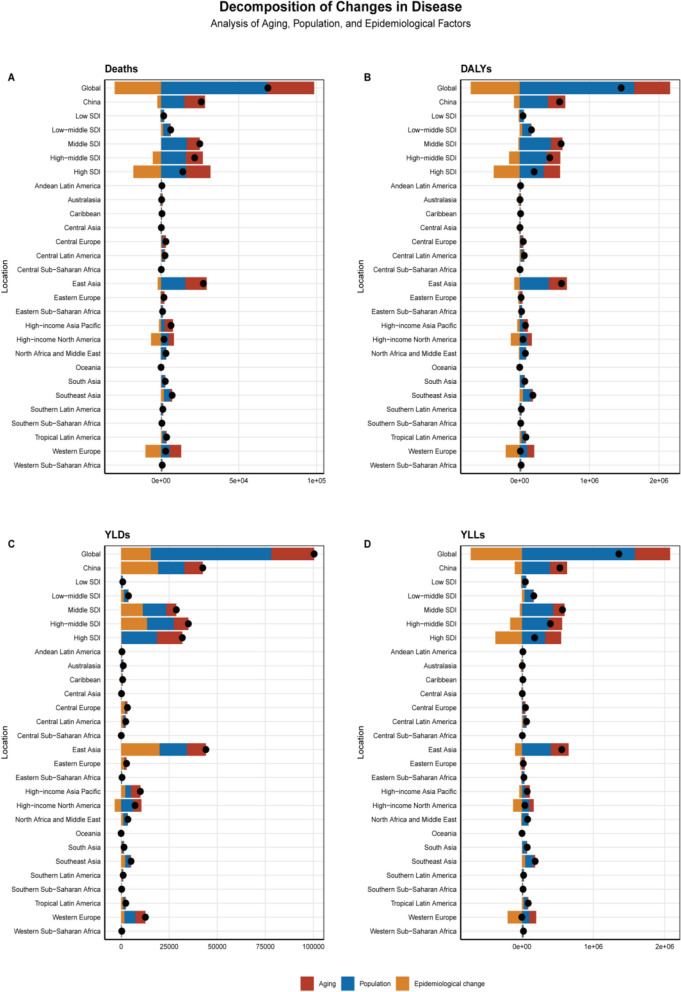
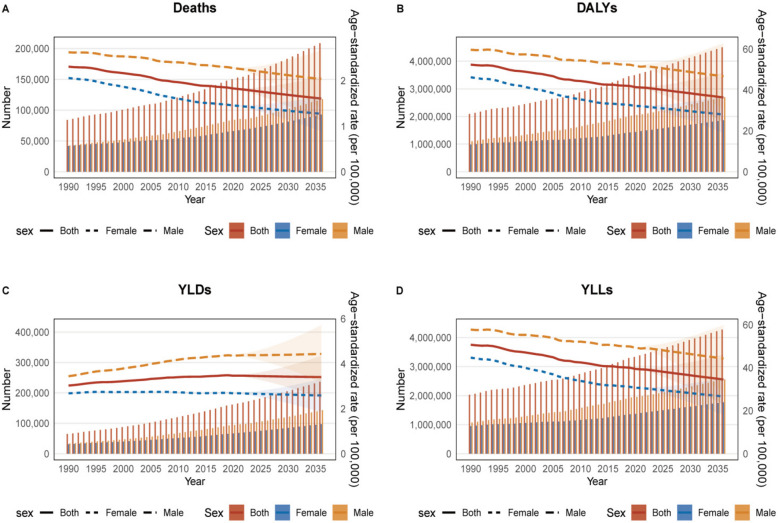
Results: From 1990 to 2021, age-standardized mortality rates (EAPC = − 0.84%, 95% CI: − 0.87 to − 0.81) and disability-adjusted life years (DALYs) (EAPC = − 0.85, 95% CI: − 0.88 to − 0.81) for CRC attributable to high red meat intake declined globally. The reduction in DALYs was driven by decreasing years of life lost (YLLs; EAPC = − 0.9, 95% CI: − 0.93 to − 0.86), contrasting with rising years lived with disability (YLDs; EAPC = 0.45, 95% CI: 0.41–0.48). Males and older populations bore a disproportionate burden. Global population growth accounted for 99.73% of increased deaths, 112.77% of DALYs, 62.42% of YLDs, and 116.5% of YLLs. Inequality slope indices for mortality remained stable, while concentration indices for DALYs declined (deaths: 0.31 [95% CI: 0.28–0.34] to 0.26 [0.23–0.29]). Projections indicate declining age-standardized mortality and DALY rates by 2036, but absolute deaths, DALYs, and YLLs are expected to rise.
Conclusion: Despite declining age-standardized rates, the absolute burden of CRC associated with diet high in red meat persists, with marked disparities across regions and demographics. Population growth remains a critical driver, underscoring the need for targeted dietary interventions and equity-focused policies.
Supplementary Information: The online version contains supplementary material available at 10.1186/s12889-025-23712-1.
Keywords: Colorectal cancer; Decomposition; Disability-adjusted life years; Global burden of disease; Health inequality; Red meat.
Conflict of interest statement
Declarations. Ethics approval and consent to participate: The data from the GBD study used in this research is publicly available, hence no ethical approval was needed for this study. Data access and usage are in accordance with the guidelines and terms of use of the GBD study. Consent for publication: Not applicable. Competing interests: The authors declare no competing interests.
Figures


Similar articles
-
Burden of Breast Cancer Attributable to a Diet High in Red Meat at Global, Regional, and National Levels: An Analysis of the Global Burden of Disease Study 2021.Arch Iran Med. 2025 May 1;28(5):275-285. doi: 10.34172/aim.34079. Epub 2025 May 1. Arch Iran Med. 2025. PMID: 40751521 Free PMC article.
-
Global burden of disease changes related to high red meat diets and breast cancer from 1990 to 2021 and its prediction up to 2030.Front Nutr. 2025 Jun 4;12:1586299. doi: 10.3389/fnut.2025.1586299. eCollection 2025. Front Nutr. 2025. PMID: 40535052 Free PMC article.
-
Global, regional, and national burden of colorectal cancer in the elderly (aged > 60 years): a comprehensive analysis across 204 countries and territories (1990-2021).BMC Gastroenterol. 2025 Aug 9;25(1):570. doi: 10.1186/s12876-025-04184-4. BMC Gastroenterol. 2025. PMID: 40783503 Free PMC article.
-
Global, regional, and national trends in colorectal cancer from 2010 to 2021: an analysis of the global burden of disease study 2021.Ann Med. 2025 Dec;57(1):2534098. doi: 10.1080/07853890.2025.2534098. Epub 2025 Aug 1. Ann Med. 2025. PMID: 40747788 Free PMC article.
-
Global, regional, and national burden of shoulder dislocation 1990-2021: a systematic analysis of the Global Burden of Disease study 2021.J Shoulder Elbow Surg. 2025 May 9:S1058-2746(25)00379-9. doi: 10.1016/j.jse.2025.03.037. Online ahead of print. J Shoulder Elbow Surg. 2025. PMID: 40349910 Review.
References
-
- Bray F, Laversanne M, Sung H, Ferlay J, Siegel RL, Soerjomataram I, et al. Global cancer statistics 2022: GLOBOCAN estimates of incidence and mortality worldwide for 36 cancers in 185 countries. CA Cancer J Clin. 2024;74:229–63. - PubMed
-
- Keum N, Giovannucci E. Global burden of colorectal cancer: emerging trends, risk factors and prevention strategies. Nat Rev Gastroenterol Hepatol. 2019;16:713–32. - PubMed
-
- Strum WB. Colorectal adenomas. N Engl J Med. 2016;374:1065–75. - PubMed
-
- Bouvard V, Loomis D, Guyton KZ, Grosse Y, Ghissassi FE, Benbrahim-Tallaa L, et al. Carcinogenicity of consumption of red and processed meat. Lancet Oncol. 2015;16:1599–600. - PubMed
-
- Diet high in red meat - level 3 risk| institute for health metrics and evaluation. https://www.healthdata.org/research-analysis/diseases-injuries-risks/fac.... Accessed 20 Mar 2025.
Grants and funding
- 82205227/National Natural Youth Science Foundation of China
- 82205227/National Natural Youth Science Foundation of China
- 82205227/National Natural Youth Science Foundation of China
- 82205227/National Natural Youth Science Foundation of China
- 82205227/National Natural Youth Science Foundation of China
- CX20210707/Postgraduate Innovation Project of Hunan Provincial Department of Education
- CX20210707/Postgraduate Innovation Project of Hunan Provincial Department of Education
- CX20210707/Postgraduate Innovation Project of Hunan Provincial Department of Education
- CX20210707/Postgraduate Innovation Project of Hunan Provincial Department of Education
- CX20210707/Postgraduate Innovation Project of Hunan Provincial Department of Education
- 2022SK2018/Key R&D Programme Project of Hunan Province
- 2022SK2018/Key R&D Programme Project of Hunan Province
- 2022SK2018/Key R&D Programme Project of Hunan Province
- 2022SK2018/Key R&D Programme Project of Hunan Province
- 2022SK2018/Key R&D Programme Project of Hunan Province
LinkOut - more resources
Full Text Sources
