. 2025 Aug 18;24(1):338.
doi: 10.1186/s12933-025-02828-z.

The dual GLP-1 and GIP receptor agonist tirzapetide provides an unintended interaction with the β-adrenoceptors and plays a role in glucose metabolism in hyperglycemic or senescent cardiac cells

Affiliations

The dual GLP-1 and GIP receptor agonist tirzapetide provides an unintended interaction with the β-adrenoceptors and plays a role in glucose metabolism in hyperglycemic or senescent cardiac cells

Dunya Aydos et al. Cardiovasc Diabetol. .

Abstract

Background: A dual glucose-dependent insulinotropic polypeptide (GIP) and glucagon-like peptide-1 (GLP1) receptor agonist, tirzepatide (TZPD), is a novel cardioprotective agent, particularly in metabolic disturbances-related co-morbidities, however, there is no exact study to emphasize its possible unintended action in cardiac cells.

Objective: Considering a relationship between the trafficking of incretin receptors in a manner not anticipated by the standard way of cAMP as a primary actor in TZPD action, together with the role of cAMP depression in cardiac dysfunction, here, we aimed to elucidate a pattern of unintended receptor interactions of TZPD and molecular processes underlying the pleiotropic effects of TZPD through modulation of the β-adrenoceptors (β-ARs) signaling in cardiomyocytes.

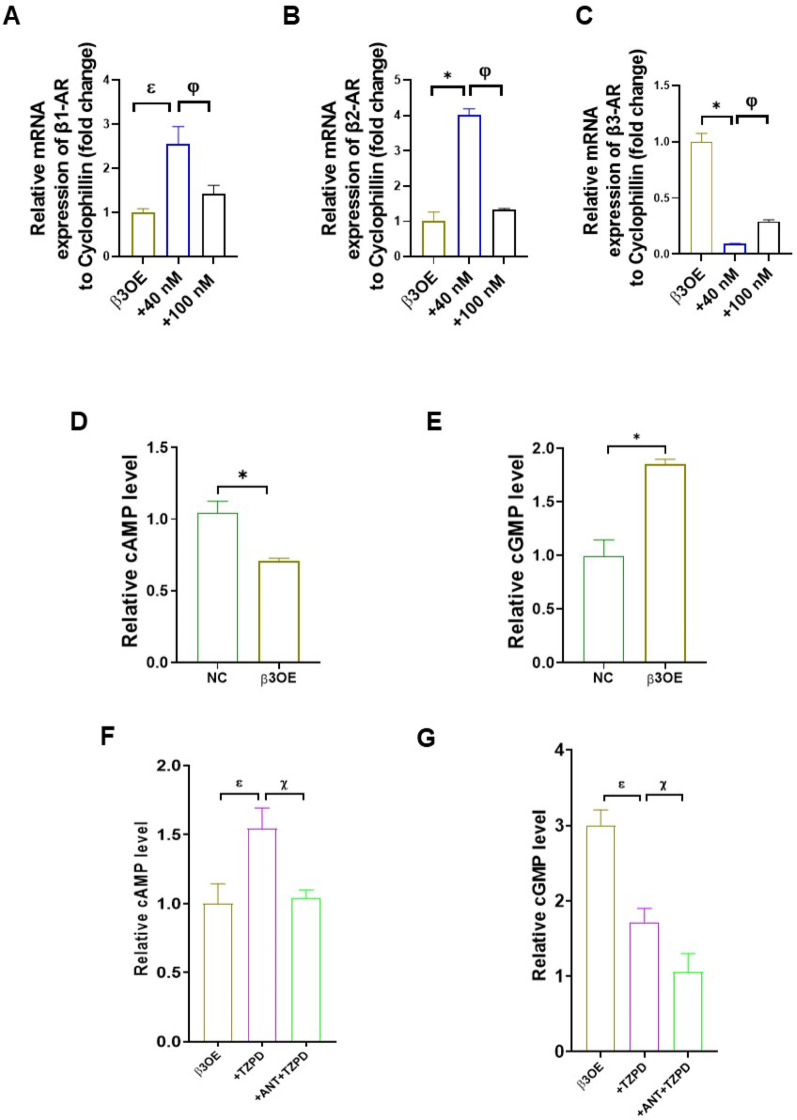
Methods: To establish the multifaceted cardioprotective function and underlying mechanisms of TZPD against hyperglycemia (HG)-or senescence (SC)-induced cardiac dysfunction, H9c2 cells were treated with and without TZPD. We also used β3-ARs overexpressed H9c2 cells (β3OE) for comparisons.

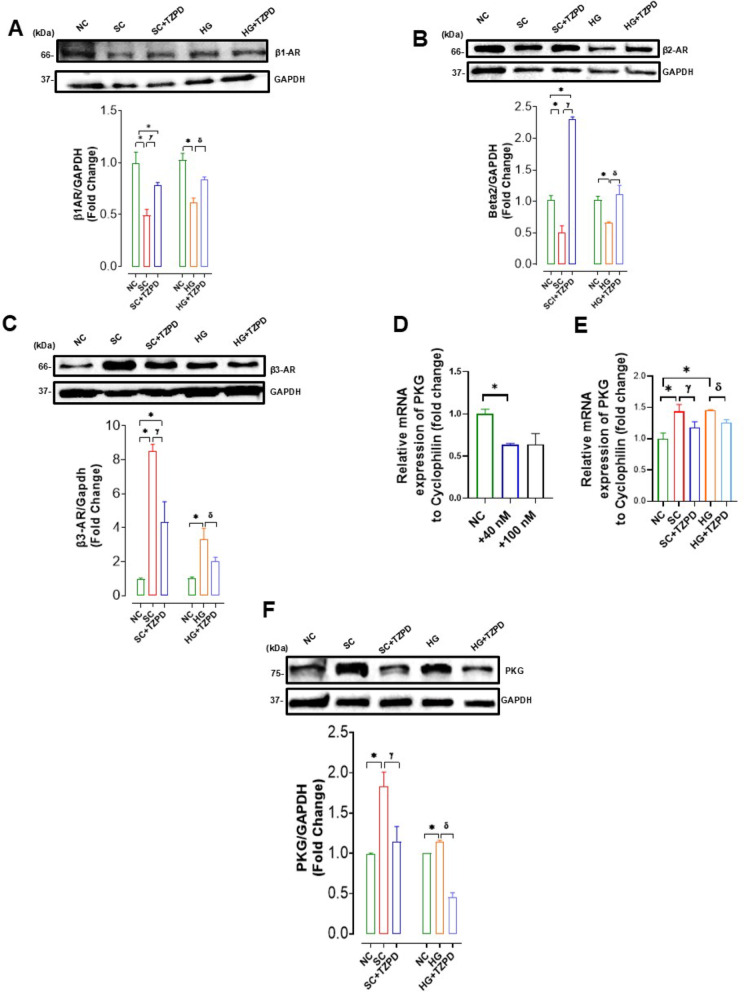
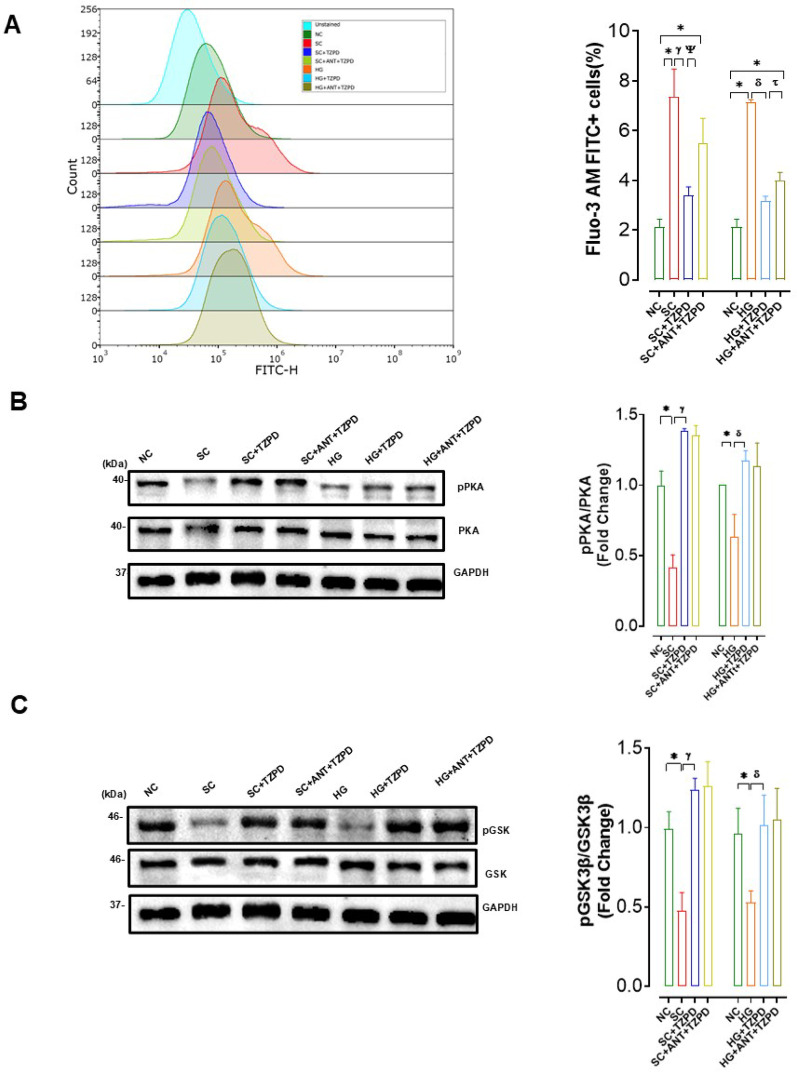
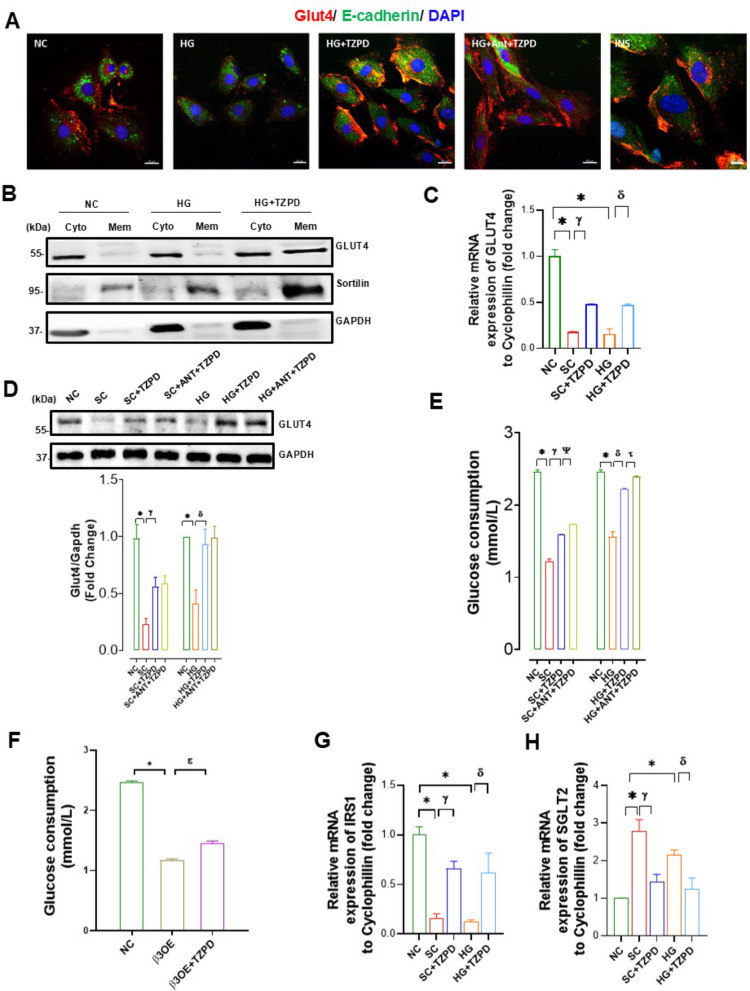
Results: The TZPD intervention ameliorated the HG or SC phenotypes in the cardiac cells via alleviation in protein levels of GLP-1R and GIP-R as well as production of cAMP or cGMP, even in the presence of these receptor antagonisms. TZPD also increased the levels of β1- and β2-ARs while significantly decreasing activated β3-ARs and PKG, being parallel to normalizations in the cAMP and cGMP in the presence of the antagonisms of these receptors. The therapeutic effects of TZPD on similar parameters of the β3OE group of cells can strongly verify its unintended action among multifaceted effects in either HG or SC cells. In addition, molecular dynamics simulations indicated that TZPD binds with the highest affinity to GLP-1R and β3-ARs rather than GIP-R and then relatively lower but almost similar affinities to β1- and β2-ARs. Furthermore, mechanistically, the cardioprotective effect of TZPD includes significant regulation of the cellular Ca2+, at most, modulating the proteins in β-ARs signaling pathways. Moreover, TZPD could significantly increase not only the depressed protein level but also the translocation of GLUT4 on the sarcolemma, promoting glucose uptake in the HG or SC groups independent of its receptor actions.

Conclusions: Our findings indicate that TZPD, with its multifaceted role, has beneficial effects on cardiac cells by positively modulating β-ARs signaling and glucose metabolism rather than on-target receptor action. Furthermore, we demonstrated how TZPD can engage the different targets with distinct signaling motifs at the sarcolemma.


Conflict of interest statement

Declarations. Competing interests: The authors declare no competing interests.

Figures

Fig. 1
Fig. 1
Demonstration of GLP-1R and GIP-R existence in H9c2 cells and their responses to Tirzepatide (TZPD) in a concentration-dependent manner. Verification of GLP-1R (green) (A) of GIP-R (green), (B) in immunostained H9c2 cells in NC, SC, and HG groups by immunofluorescence microscopy. E-cadherin (red) was used to stain plasma membrane. The mRNA expression levels of GLP-1R (C) or GIP-R (D) concerning cyclophilin upon treatment with either 40 nM or 100 nM TZPD. TZPD application (40 nM for 24 h) provides significant augmentations in the depressed protein levels of GLP-1R (E) and GIP-R (F), and the altered levels of cAMP (G-left) and cGMP (H-left) in either the senescence group of cells (SC group) or hyperglycemic group of cells (HG group) compared to the control group of cells (NC group). In the NC group of cells, either nadonol (+ Nadonol + TZPD) or BRL (+ TZPD + BRL) application changes the level of cAMP (G-right) and cGMP (H-right) compared to only the TPZD incubated group of cells (+ TZPD). Only IBMX and only forskolin-treated groups were used as a negative control for cAMP and cGMP, respectively. All shortenings are the same in all figures after all. The protein levels were quantified by Western blotting, and GAPDH levels were used for normalization. The representative protein bands are given in the upper parts of the bar graphs. The experimental groups are kept as two groups: SC + TZPD and SC + TZPD + ANT (in the presence of receptor antagonist) or HG + TZPD and HG + TZPD + ANT (in the presence of receptor antagonist). Figures include magnification = 20X. Data are presented as means ± SEM, and the comparisons between two groups are performed by t-test. *p < 0.05 vs. NC group, φp < 0.05 vs. +40 nM TZPD treated group, γp < 0.05 vs. SC group, δp < 0.05 vs. HG group, Κp < 0.05 vs. +TZPD group, p < 0.05 vs. +BRL group. (n = 4 for qRT-PCR experiments and n = 3 for western blotting, cAMP, and cGMP experiments)
Fig. 2
Fig. 2
TZPD provides augmentations in the protein levels of β-ARs systems as well as PKG of either the SC group or HG group H9c2 cells. The protein levels of β1-AR (A), β2-AR (B), and β3-AR (C) in either the SC group or HG group H9c2 cells treated with TZPD (40 nM for 24 h) compared to the NC group of cells. The TZPP with either 40 nM or 100 nM has significant inhibition of the mRNA level of PKG compared to the cyclophillin in the NC group of cells (D). The TZPD application induced significant decreases in the activated mRNA levels of PKG in HG- or SC groups of cells compared to the NC group of cells (E). The 40 nM of TZPD application (24 h) provided a significant inhibition on the activated protein level of PKG in the SC group of cells while it had much more inhibition on the protein level of PKG in the HG group of cells under its NC level (F). The protein levels were quantified by Western blotting and GAPDH levels were used for normalization. The representative protein bands are given in the upper parts of the bar graphs. Data are presented as means ± SEM, and the comparisons between two groups are performed by t-test. *p < 0.05 vs. NC group, φp < 0.05 vs. TZPD treated group, γp < 0.05 vs. SC group, δp < 0.05 vs. HG group (n = 3 for western blotting experiments)
Fig. 3
Fig. 3
The TZPD application augmented the mRNA levels of β-ARs and the levels of cAMP and cGMP in β3-AR overexpressed (β3OE) H9c2 cells. The mRNA expression levels of β1-AR (A), β2-AR (B), and β3-AR (C) compared to cyclophilin in β3OE H9c2 cells upon treatment with 40 nM or 100 nM TZPD for 24 h. Cellular cAMP (D) and cGMP (E) levels in β3OE cells compared to those of the NC group of cells. Responses to the TZPD application in the production of cAMP (F) and cGMP (G) in β3OE cells with and without GLP-1R and GIP-R antagonisms. Data are presented as means ± SEM, and the comparisons between two groups are performed by t-test. *p < 0.05 vs. NC group, φp < 0.05 vs. +40 nM TZPD treated group, εp < 0.05 vs. β3OE group, χp < 0.05 vs. +ANT + TZPD group (n = 5 for qRT-PCR experiments and n = 3 for western blotting, cAMP, cGMP experiments)
Fig. 4
Fig. 4
Effects of TZPD on mRNA and protein levels of GLP-1R, GIP-R, and PKG in β3OE cells. The responses to 40 nM or 100 nM of TZPD application as mRNA levels of GLP-1R (A), GIP-R (B), and PKG (C) compared to cyclophill in β3OE cells. The protein levels of GLP-1R, GIP-R, and PKG under 40 nM of TZPD application in the β3OE cells, compared to GAPDH or tubulin analyzed by Western blot (D to F, respectively). The representative protein bands are given in the upper parts of the bar graphs. Data are presented as means ± SEM. The comparisons between the two groups are performed by t-test. *p < 0.05 vs. NC group, εp < 0.05 vs. β3OE group (n = 4 for qRT-PCR experiments and n = 3 for western blotting experiments)
Fig. 5
Fig. 5
Effect of the TZPD application on the cellular resting level of Ca2+ and protein levels of parameters played roles in cellular Ca2+ regulation via β-AR signaling. The cellular resting level of Ca2+ was imagined in all groups of H9c2 cells loaded with a Ca2+-sensitive fluorescence dye Fluo-3 AM (A). The representative flow cytometry data demonstrate the effect of TZPD (40 nM) on intracellular Ca2+ distribution in resting cells with and without receptor antagonism for the SC group of cells and HG group of cells (left). The average cellular Ca2+ level in Fluo-3 AM loaded H9c2 cells was measured in all groups by the flow cytometer technique (right). The protein levels of phosphorylated PKA (pPKA) and PKA and their ratios (B), and phosphorylated GSK (pGSK) and GSK and their ratios (C), compared to a reference protein GAPDH in the SC, SC + TZPD, SC + TZPD + ANT or HG, HG + TZPD, HG + TZPD + ANT comparison to the NC group. All shortenings are the same as given in previous figures. Representative protein bands are given in the left parts of the bar graphs. Data are presented as means ± SEM. The comparisons between the two groups are performed by t-test. *p < 0.05 vs. NC group, γp < 0.05 vs. SC group, δp < 0.05 vs. HG group, Ψp < 0.05 vs. SC + ANT + TZPD group, τp < 0.05 vs. HG + ANT + TZPD group (n = 4 for flow cytometry experiments and n = 3 for western blotting experiments)
Fig. 6
Fig. 6
Effects of TZPD on cellular glucose uptake and translocation of GLUT4 on the cell membrane. The distribution of GLUT4 (red) in the cells when 40 nM of TZPD was applied (30 min) to the SC group or HG group of cells in comparison to the NC cells given as representative confocal immunofluorescence staining and E-cadherin (green) staining was used to detect plasma membrane (A). The GLUT4 protein levels in isolated membrane (Mem) and cytosolic (Cyto) fractions in NC and HG cells by western blotting (B). The mRNA levels (relative to cyclophillin) in these groups of cells were measured when they were incubated with 40 nM TZPD for 24 h (C). The effects of the TZPD application on protein levels of GLUT4 in these experimental groups in comparison to the NC group, with and without receptor antagonists (D). The representative protein bands are given in the upper parts of the bar graphs. The levels of cellular glucose uptake in the SC and the HG groups of cells when 40 nM of TZPD applied (24 h), compared to those not applied with and without receptor antagonism (E). The TZPD effect on glucose uptake in β3OE cells compared to that of the NC group of cells (F). The mRNA and protein levels of IRS1 and SGLT2 relative to cyclophilin and GAPDH, respectively, in experimental groups of cells with and without the TZPD application compared to the NC cells (G and H, respectively). GLUT4 imaging; 20X. Data are presented as means ± SEM. The comparisons between the two groups are performed by t-test. *p < 0.05 vs. NC group, γp < 0.05 vs. SC group, δp < 0.05 vs. HG group, Ψp < 0.05 vs. SC + ANT + TZPD group, τp < 0.05 vs. HG + ANT + TZPD group (n = 4 for qRT-PCR experiments and n = 3 for western blotting and glucose uptake experiments)

References

    1. Wondmkun YT, Obesity. Insulin resistance, and type 2 diabetes: associations and therapeutic implications. Diabetes Metab Syndr Obes. 2020;13:3611–6. - PMC - PubMed
    1. Ilkun O, Boudina S. Cardiac dysfunction and oxidative stress in the metabolic syndrome: an update on antioxidant therapies. Curr Pharm Des. 2013;19(27):4806–17. - PMC - PubMed
    1. Rizvi AA, Rizzo M. Age-Related changes in insulin resistance and muscle mass: clinical implications in obese older adults. Med (Kaunas). 2024;60(10):1648. - PMC - PubMed
    1. Saraiva FK, Sposito AC. Cardiovascular effects of glucagon-like peptide 1 (GLP-1) receptor agonists. Cardiovasc Diabetol. 2014;13:142. - PMC - PubMed
    1. Zaffina I, Pelle MC, Armentaro G, Giofre F, Cassano V, Sciacqua A, et al. Effect of dual glucose-dependent insulinotropic peptide/glucagon-like peptide-1 receptor agonist on weight loss in subjects with obesity. Front Endocrinol (Lausanne). 2023;14:1095753. - PMC - PubMed

MeSH terms

LinkOut - more resources