. 2025 Aug 18;44(1):243.
doi: 10.1186/s13046-025-03510-8.

COL10A1+ fibroblasts promote colorectal cancer metastasis and M2 macrophage polarization with pan-cancer relevance

Affiliations

COL10A1+ fibroblasts promote colorectal cancer metastasis and M2 macrophage polarization with pan-cancer relevance

Shangshang Hu et al. J Exp Clin Cancer Res. .

Abstract

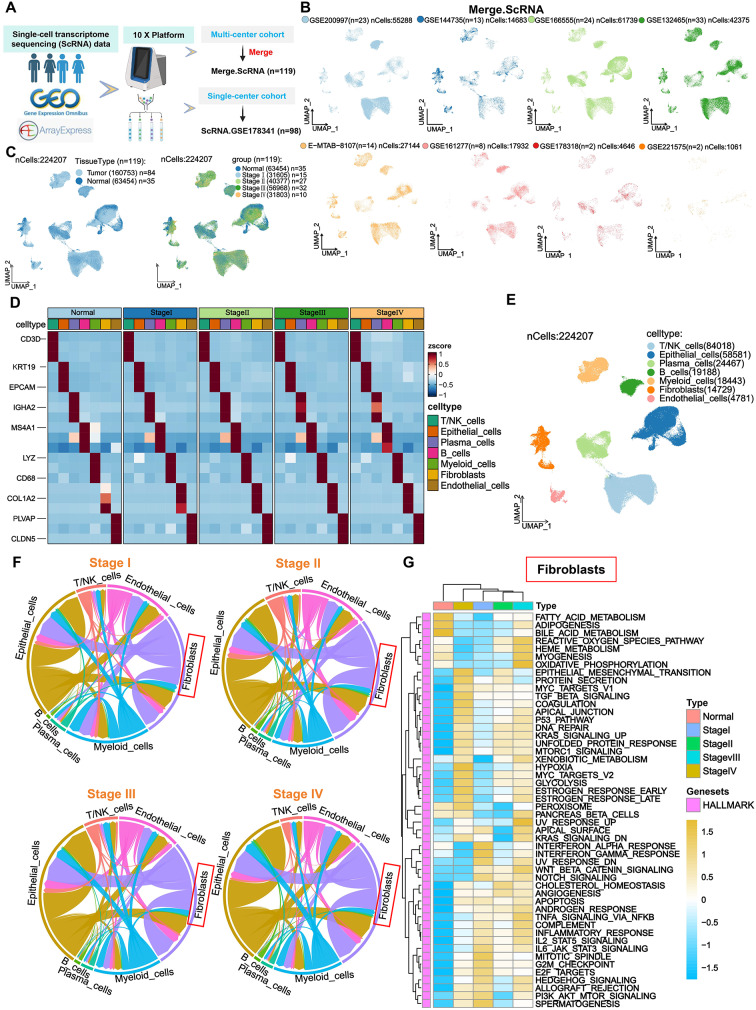
Background: Colorectal cancer (CRC) is a common gastrointestinal cancer with poor response to therapy and high metastatic risk. Cancer-associated fibroblasts (CAFs) support tumor progression, but their functional heterogeneity remains poorly understood.

Methods: We integrated multi-omics data from 10,164 samples, including single-cell, bulk, spatial transcriptomics, and proteomics, to identify and characterize CAF subpopulations. Functional validation was performed using molecular assays, in vivo models, and drug screening.

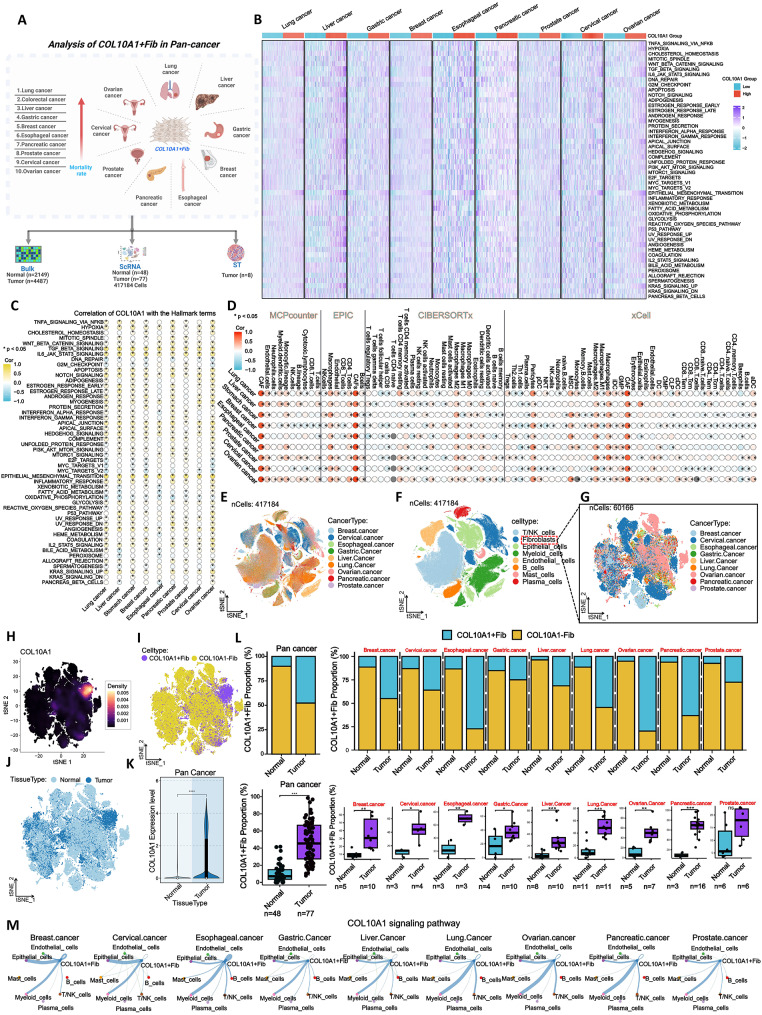
Results: We identified a COL10A1-positive fibroblast subpopulation (COL10A1+Fib) associated with CRC progression and poor patient prognosis. COL10A1+Fib promotes tumor cell proliferation, immune suppression, and metastasis. Mechanistically, COL10A1+Fib facilitates epithelial-mesenchymal transition (EMT) in CRC cells via COL10A1 secretion and induces M2 macrophage polarization through the COL10A1/CD18/JAK1/STAT3 signaling axis. In turn, M2 macrophages enhance COL10A1 expression in fibroblasts via the TGF-β/RUNX2 pathway, forming a pro-tumorigenic feedback loop. The DNA-PKcs inhibitor NU7441 reduces COL10A1 expression, suppresses CAF activity, and reverses EMT and M2 polarization. Pan-cancer analysis suggests that COL10A1+Fib may have similar functional roles across multiple major solid tumors.

Conclusion: Our study identifies a CAF subpopulation, COL10A1+Fib, associated with CRC progression and immune suppression, suggesting it as a potential therapeutic target in CRC and possibly other malignancies.

Keywords: COL10A1; Cancer-associated fibroblasts; Colorectal cancer; Pan-cancer.


Conflict of interest statement

Declarations. Ethics approval and consent to participate: The studies involving human participants were reviewed and approved by the Ethics Committees and Institutional Review Boards of Nanjing First Hospital, affiliated with Nanjing Medical University. The patients/participants provided their written informed consent to participate in this study. Written informed consent was obtained from the individual(s) for the publication of any potentially identifiable images or data included in this article. Consent for publication: All authors have provided their consent for publication. Competing interests: The authors declare no competing interests.

Figures

Fig. 1
Fig. 1
Fibroblasts Exhibit Pro-Metastatic and Immunosuppressive Features in Advanced CRC Based on Merge.ScRNA Data. A. scRNA-seq data from GEO and ArrayExpress were integrated into two cohorts: the multi-center cohort (Merge.ScRNA) and single-center cohort (ScRNA.GSE178341). B. UMAP distribution of single cells from the eight datasets within Merge.ScRNA. C. UMAP plot of Merge.ScRNA data stratified by tissue type and TNM stage. D. Heatmap showing expression of canonical surface markers across cell types in different TNM stages. E. UMAP clustering of seven major cell types. F. Circular plot showing intercellular communication strength and weights across cell types. G. Heatmap of GSVA pathway enrichment in fibroblasts across TNM stages
Fig. 2
Fig. 2
Identification of COL10A1+Fib as associated with CRC progression. A. tSNE plot of 11 fibroblast subclusters (Fib_1–Fib_11). B. tSNE plots showing subcluster distribution across tissue types and TNM stages. C. Volcano plots of the top three marker genes for each subcluster. D. Heatmap of functional pathway enrichment among the 11 fibroblast subclusters. EF. Comparison of subcluster proportions between normal and tumor tissues. GH. Proportional distribution of subclusters across TNM stages. I. Pseudotime trajectory analysis indicating Fib_1 as a terminally differentiated subcluster. J. Enrichment of pseudotime modules (Cluster1–4) in key biological processes. K. Venn diagram identifying COL10A1 as the intersection of highly expressed genes in Fib_1 and top hub genes in the M12 module. LM. Expression distribution of COL10A1 across fibroblast subclusters (violin plot and tSNE). N. Pseudotime expression dynamics of COL10A1. O. COL10A1 expression stratified by TNM stage. P. Definition of COL10A1+Fib by excluding COL10A1⁻ cells from Fib_1. Q. Proportional changes in COL10A1+Fib across different TNM stages in the Merge.ScRNA. R. COL10A1 expression levels in CRC tissues versus normal tissues based on bulk datasets (TCGA + GTEx and GSE44076). S. Comparative expression of COL10A1+Fib between CAFs and NFs (datasets: GSE93255 and GSE46824). T. Infiltration levels of COL10A1+Fib across different clinicopathological subgroups in the TCGA CRC cohort
Fig. 3
Fig. 3
Validation of the association between COL10A1+Fib and CRC progression and prognosis in clinical samples. A. COL10A1 protein levels in normal vs. tumor tissues and across TNM stages based on in-house CRC samples; Primary Tumor (n = 35), Paracancerous Normal (n = 35). B. Protein-level comparison of COL10A1 expression between isolated CAFs and NFs; Primary Tumor (n = 5), Paracancerous Normal (n = 5). C. Co-expression of COL10A1 and α-SMA in CAFs visualized by immunofluorescence; Primary Tumor (n = 5); Scale bars, 50 μm. D. Distribution of COL10A1+Fib across normal tissues and different TNM stages; Primary Tumor (n = 35), Paracancerous Normal (n = 35); Scale bars, 50 μm. E. COL10A1 protein expression in 10 human CRC cell lines compared to CAFs. F. Kaplan–Meier curves for overall survival (OS) and relapse-free survival (RFS) based on COL10A1+Fib levels in the TCGA cohort. G. Batch-corrected integration of 10 GEO datasets in the Bulk.GEO.Merge cohort. H. Survival analysis of COL10A1+Fib-high and -low patients in the Bulk.GEO.Merge cohort (OS and RFS). *P < 0.05; ***P < 0.001
Fig. 4
Fig. 4
COL10A1+Fib promote CRC cell proliferation, invasion, and liver metastasis. A. Multiplex immunofluorescence staining shows spatial colocalization of COL10A1+Fib with ERO1A+/ALDOA+ epithelial cells (Epi_1) (Primary Tumor: n = 35). B. Schematic diagram of the in vitro co-culture system involving CRC cells (HCT116) co-cultured with control fibroblasts, COL10A1⁻Fib, or COL10A1+Fib. C. CCK-8 assay assessing proliferation of HCT116 cells under different co-culture conditions. D. Colony formation assay evaluating the clonogenic capacity of HCT116 cells. E. Schematic workflow of the subcutaneous xenograft model in nude mice. F. Tumor volume and tumor weight measurements in xenograft-bearing mice across experimental groups. G. H&E staining of tumor tissues to assess morphological differences (per group: n = 6). Scale bars, 200 μm. H. Ki67 immunohistochemistry (IHC) for evaluation of proliferative activity within tumor tissues (per group: n = 6). I. Schematic representation of the Transwell migration and invasion assay
Fig. 5
Fig. 5
COL10A1+Fib promote epithelial–mesenchymal transition (EMT) in CRC cells. A. Spearman correlation analysis between COL10A1+Fib infiltration levels and EMT scores across multiple bulk datasets (TCGA, GSE17538, GSE39582, GSE72970, GSE29621, and Bulk.GEO.Merge). B. Western blot analysis and quantification of EMT markers (E-cadherin, N-cadherin, vimentin) in HCT116 and SW620 cells co-cultured with COL10A1+Fib. C. Dose-dependent induction of EMT markers in HCT116 and SW620 cells treated with recombinant human COL10A1 (rCOL10A1) at 0, 1, 2, 5, and 10 nM. D. IHC (per group: n = 6) analysis of EMT marker expression (E-cadherin, N-cadherin, vimentin) in subcutaneous xenografts and liver metastases in nude mice. Scale bars, 300 μm. >*P < 0.05; **P < 0.01; ***P < 0.001
Fig. 6
Fig. 6
COL10A1+Fib promotes M2-like macrophage polarization. A. Heatmap showing M2 macrophage scores across myeloid cell subpopulations in the Merge.ScRNA dataset. B. Spearman correlation analysis between COL10A1+Fib infiltration and APOE+Macr, SPP1+Macr, and C1QA+Macr subpopulations in the TCGA dataset
Fig. 7
Fig. 7
COL10A1+Fib promotes M2-like polarization through the CD18/JAK1/STAT3 signaling axis. A. Cell–cell communication analysis in the Merge.ScRNA dataset showing COL10A1+Fib interacting with APOE+Macr, SPP1+Macr, and C1QA+Macr via COL10A1 signaling. B. CD18 expression levels across myeloid subpopulations in single-cell data, highest in M2 macrophages. C. CD18 gene expression in M0, M1, and M2 macrophages in the GSE159112 dataset. D. Western blot showing CD18 protein levels under M0, M1, and M2 induction conditions. E. Western blot comparison of CD18 protein expression in M0 macrophages treated with COL10A1⁻Fib versus COL10A1+Fib. F. Spearman correlation analysis between CD18 infiltration and M1/M2 macrophage infiltration in TCGA and Bulk.GEO.Merge datasets. G. Multiplex immunofluorescence staining (DAPI, CD163+, CD206+, CD18+) showing CD18 co-localized with M2 markers (Primary Tumor: n = 35). Scale bars, 50 μm. H. Spearman correlation analysis of COL10A1 and CD18 expression in TCGA and Bulk.GEO.Merge cohorts. I. Co-immunoprecipitation (Co-IP) assay confirming direct interaction between COL10A1 and CD18 proteins. J. Spatial transcriptomic evidence of COL10A1 and CD18 colocalization in CRC tissue. K. GSEA enrichment based on TCGA and Bulk.GEO.Merge datasets showing activation of JAK/STAT3 signaling downstream of the COL10A1/CD18 axis. L. Western blot analysis of p-JAK1, p-STAT3, CD163, and CD206 in subcutaneous tumors of nude mice. M. RT-qPCR analysis of M2-associated genes (CD163, PDGFB, MRC1, CSF1R, ARG1, TGFB) under the indicated treatments: Control_CM, COL10A1+Fib-CM, COL10A1Fib-CM, recombinant COL10A1 (rCOL10A1, 5 nM), siCD18, Ruxolitinib (3.3 nM), and their combinations. N. Western blot analysis of p-JAK1, p-STAT3, CD163, and CD206 in M0 macrophages subjected to the indicated treatments: Control_CM, COL10A1+Fib-CM, COL10A1Fib-CM, recombinant COL10A1 (rCOL10A1, 5 nM), siCD18, Ruxolitinib (3.3 nM), and their combinations. **P < 0.01; ***P < 0.001; ****P < 0.0001
Fig. 8
Fig. 8
M2-like macrophages promote COL10A1 expression in COL10A1+Fib via the TGF-β/RUNX2 axis. A. Heatmap showing transcription factors activated in COL10A1+Fib based on SCENIC analysis. B. Radar plot of correlation coefficients between COL10A1 and candidate TFs (VDR, DLX5, LEF1, RUNX2, SOX4, STAT2, CREB3L1, CREB3) across bulk datasets (TCGA, GSE17538, GSE39582, GSE72970, GSE29621, Bulk.GEO.Merge). C. Scatterplots showing Spearman correlations between COL10A1 and RUNX2 in bulk datasets. D. t-SNE plot showing RUNX2 activity across cell types in single-cell RNA-seq. E. Violin plot of RUNX2 activity across fibroblast subpopulations. F. RUNX2 activity across TNM stages. G. RUNX2 expression in CAFs vs. NFs in GSE46824 and GSE93255 datasets. H. Western blot and quantification of RUNX2 protein in CAFs and NFs. I. Western blot showing downregulation of COL10A1 and RUNX2 after RUNX2 siRNA transfection. J. ChIP-qPCR results for RUNX2 binding at five predicted COL10A1 promoter sites. K. Multiplex immunofluorescence showing co-localization of RUNX2 and COL10A1 in fibroblasts (Primary Tumor: n = 35); Scale bars, 50 μm. L. Western blot and quantification of TGFB1 in M0, M1, and M2 macrophages. M. TGFB1 protein expression after M0 macrophages were induced by COL10A1+Fib. N. Western blot analysis of COL10A1 and RUNX2 expression in CAFs exposed to M2 macrophage-conditioned medium (M2_CM-1, M2_CM-2) or COL10A1+Fib conditioned medium (COL10A1+Fib_CM) or recombinant TGF-β1 (rTGF-β1) at 0, 1, 2, 5, and 10 nM. O. Western blot analysis of COL10A1 and RUNX2 protein levels under the indicated treatments: recombinant TGF-β1 (5 nM), SB-431,542 (10 µM), siRUNX2, siCOL10A1, and their combinations. *P < 0.05; ***P < 0.001
Fig. 9
Fig. 9
NU7441 suppresses COL10A1+Fib function and reverses its tumor-promoting effects on CRC cells in vitro and in vivo. A. IC50 curves of 10 small-molecule compounds against COL10A1+Fib cells. B. Western blot and densitometric quantification of COL10A1 expression in CAFs after treatment with the following compounds: NU7441 (0.572 µM), JQ-1 (2.706 µM), BMS-754,807 (1.487 µM), U-55,933 (0.902 µM), AZD1332 (0.704 µM), AZD8186 (1.049 µM), Entospletinib (1.715 µM), ZM-447,439 (2.522 µM), XAV939 (0.781 µM) and SB-216,763 (6.591 µM). C. ELISA quantification of COL10A1 secretion following treatment. D. Western blot demonstrating Smad2/3 pathway inhibition in CAFs treated with NU7441 (0.572 µM), recombinant TGF-β1 (rTGF-β1, 5 nM). E. Western blot analysis of FAP and α-SMA (ACTA2) expression in CAFs after treatment with NU7441 (0.572 µM). F. Schematic overview of the experimental design: conditioned media (CM) collected from CAFs subjected to recombinant COL10A1 (rCOL10A1, 5 nM), NU7441 (0.572 µM), or their combination were applied separately to HCT116 cells and M0 macrophages for downstream assays. G. Colony formation assay assessing proliferation of HCT116 under various treatments. H. Western blot and quantification of CD163 and CD206 expression in M0 macrophages across groups. I. Western blot and quantification of EMT markers (E-cadherin, N-cadherin, Vimentin) in HCT116. J. Representative images of xenograft tumors from each treatment group; rCOL10A1 (0.5 µg in 50 µL PBS), NU7441 (10 µg kg⁻¹). K. Final tumor weight comparisons across groups. L. Final tumor volume comparisons across groups. M. The line chart shows the tumor growth curves for seven experimental groups (per group: n = 6), including: Group 1 (Control), Group 2 (NU7441), Group 3 (COL10A1 + Fib), Group 4 (rCOL10A1), Group 5 (COL10A1 + Fib_NU7441), Group 6 (rCOL10A1_NU7441), and Group 7 (COL10A1 + Fib_NU7441_rCOL10A1). N. H&E and Ki67 immunohistochemistry staining of xenograft tumors (per group: n = 6). Scale bars, 200 μm. *P < 0.05; **P < 0.01; ***P < 0.001
Fig. 10
Fig. 10
Distribution and Functional Characterization of COL10A1+Fib Subpopulations Pan-Cancers. A. Integrated analysis of bulk RNA-seq, ScRNA, and spatial transcriptomics (ST) data across nine solid tumors (lung, liver, gastric, breast, esophageal, pancreatic, prostate, cervical, and ovarian cancers) to systematically assess COL10A1+Fib characteristics. B. GSVA heatmap showing enrichment of tumor-promoting pathways in COL10A1-high expression groups across nine cancer types. C. Bubble plot of Spearman correlations between COL10A1 expression and hallmark pathways. D. Correlation bubble plot between COL10A1 expression and immune cell infiltration levels, assessed using four algorithms: MCPcounter, EPIC, CIBERSORTx, and xCell. E. t-SNE plot of 417,184 single cells from pan-cancer scRNA-seq data, colored by cancer type. F. t-SNE plot showing distribution of major cell types across all cancers. G. t-SNE plot of fibroblast subclusters, colored by cancer type. H. Density plot showing COL10A1 expression distribution within fibroblast populations. I. t-SNE plot showing spatial distribution of COL10A1+Fib versus COL10A1⁻Fib within fibroblasts. J. t-SNE comparison of fibroblast distributions in normal versus tumor tissues. K. Violin plots showing differences in COL10A1 gene expression between tumor and normal tissues across cancer types. L. (Top) Bar chart comparing the proportion of COL10A1+Fib in tumor versus normal tissues for each cancer type. (Bottom) Boxplot summarizing COL10A1+Fib abundance across cancers. M. Cell–cell communication network derived from scRNA-seq data showing active interactions between COL10A1+Fib and epithelial or myeloid cells via the COL10A1 signaling axis. *P < 0.05; **P < 0.01; ***P < 0.001

References

    1. Siegel RL, Kratzer TB, Giaquinto AN, Sung H, Jemal A, Cancer statistics. 2025. CA: a cancer journal for clinicians. 2025;75(1):10–45. - PMC - PubMed
    1. Jin Z, Li Y, Yi H, Wang M, Wang C, Du S, Zeng W, Zong Z. Pathogenetic development, diagnosis and clinical therapeutic approaches for liver metastasis from colorectal cancer (Review). Int J Oncol. 2025;66(3). - PMC - PubMed
    1. Acha-Sagredo A, Andrei P, Clayton K, Taggart E, Antoniotti C, Woodman CA, Afrache H, Fourny C, Armero M, Moinudeen HK, Green M, Bhardwaj N, Mikolajczak A, Rodriguez-Lopez M, Crawford M, Connick E, Lim S, Hobson P, Linares J, Ignatova E, Pelka D, Smyth EC, Diamantis N, Sosnowska D, Carullo M, Ciraci P, Bergamo F, Intini R, Nye E, Barral P, Mishto M, Arnold JN, Lonardi S, Cremolini C, Fontana E, Rodriguez-Justo M, Ciccarelli FD. A constitutive interferon-high immunophenotype defines response to immunotherapy in colorectal cancer. Cancer Cell. 2025;43(2):292–e3077. - PubMed
    1. Jia H, Chen X, Zhang L, Chen M. Cancer associated fibroblasts in cancer development and therapy. J Hematol Oncol. 2025;18(1):36. - PMC - PubMed
    1. Cheng PSW, Zaccaria M, Biffi G. Functional heterogeneity of fibroblasts in primary tumors and metastases. Trends Cancer. 2025;11(2):135–53. - PubMed

LinkOut - more resources