. 2025 Aug 14:13:e19729.
doi: 10.7717/peerj.19729. eCollection 2025.

Topology-aware pathway analysis of spatial transcriptomics

Affiliations

Topology-aware pathway analysis of spatial transcriptomics

Siras Hakobyan et al. PeerJ. .

Abstract

Spatial transcriptomics (ST) has transformed genomics by mapping gene expression onto intact tissue architecture, uncovering intricate cellular interactions that bulk and single-cell RNA sequencing often overlook. Traditional ST workflows typically involve clustering spots, performing differential expression analyses, and annotating results via gene-set methods such as overrepresentation analysis (ORA) or gene set enrichment analysis (GSEA). More recent spatially-aware techniques extend these approaches by incorporating tissue organization into gene-set scoring. However, because they operate primarily at the level of individual genes, they may overlook the connectivity and topology of biological pathways, limiting their capacity to trace the propagation of signaling events within tissue regions. In this study, we address that gap by translating gene expression into pathway-level activity using the Pathway Signal Flow (PSF) algorithm. PSF integrates expression data with curated interaction networks to compute numeric activity scores for each branch of a biological pathway, producing a functionally annotated feature space that captures downstream signaling effects as branch-specific activity values. We applied PSF to two public 10x Genomics Visium datasets (human melanoma and mouse brain) and compared clustering based on PSF-derived pathway activities from 40 curated Kyoto Encyclopedia of Genes and Genomes (KEGG) signaling pathways and gene expression with standard Seurat Louvain clustering and spatially aware methods (Vesalius, spatialGE). We observed good correspondence between PSF-based and expression-based clustering when spatially aware clustering methods were used. This suggests that branch-level pathway activities can themselves drive clustering and pinpoint spatially deregulated processes. To assess cluster-specific functional annotation, we compared PSF results to conventional ORA (based on marker genes) and GSDensity (based on cluster-specific gene sets). PSF identified a broader set of significant pathways with substantial overlap with both ORA and GSDensity, providing increased sensitivity due to its branch-level resolution. We further demonstrated that PSF-derived activity values can be used to detect spatially deregulated pathway branches, yielding results comparable to those obtained with spatially aware gene set analysis approaches such as GSDensity and spatialGE. The availability of pathway topology and branch-specific information also enabled the identification of potential intercellular communication via ligand-receptor interactions between deregulated pathways in adjacent tumor regions. To support interactive exploration of results, we developed the PSF Spatial Browser, an R Shiny application for visualizing pathway activities, gene expression patterns, and deregulated pathway networks.

Keywords: 10x Visium; Cancer omics; Cell–cell interaction; Functional analysis; Melanoma; Signaling pathways; Spatial transcriptomics; Topology-aware pathway analysis; Tumour microenvironment; Visualization.


Conflict of interest statement

The authors declare there are no competing interests.

Figures
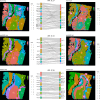
Figure 1
Figure 1. Comparative clustering of the human melanoma tissue dataset.
Clustering results were obtained using three different algorithms, visualized on the human melanoma tissue slice. The left column shows clusters based on gene expression data, while the right column displays clusters derived from PSF pathway activity values. Sankey diagrams between each pair of plots illustrate the overlap between expression-based and pathway activity-based clustering results. Adjusted Rand index (ARI) values indicating the similarity between cluster assignments are shown above each Sankey diagram. Among the methods tested, the Vesalius clustering approach demonstrated the highest similarity between gene expression-based and pathway activity-based clustering.
Figure 2
Figure 2. Comparative clustering of the mouse brain tissue dataset.
Clustering results were obtained using three different algorithms, visualized on the mouse brain tissue slice (Sagittal-Anterior). The left column shows clusters based on gene expression data, while the right column displays clusters derived from PSF pathway activity values. Sankey diagrams between each pair of plots illustrate the overlap between expression-based and pathway activity-based clustering results. Adjusted Rand index (ARI) values indicating the similarity between cluster assignments are shown above each Sankey diagram. Among the methods tested, the Vesalius approach showed the highest correspondence between gene expression and pathway activity-based clustering.
Figure 3
Figure 3. Number of significantly deregulated pathways detected by each of the three functional annotation methods and their pairwise overlaps under two threshold settings.
Low stringency criteria are defined as follows: for ORA, absolute log2 fold change greater than 0.5 for marker genes; for PSF, absolute log2 activity fold change greater than 0.25 for pathway sink nodes; and for GSDensity, cluster specificity scores above the 60th percentile. High stringency criteria are: absolute log2 fold change greater than 1, absolute log2 activity fold change greater than 0.5, and cluster specificity scores above the 80th percentile. The left two columns of panels show results for the human melanoma dataset, and the right two columns show results for the mouse brain dataset. Each row corresponds to one clustering algorithm, with gene expression–based clustering on the left and pathway activity–based clustering on the right. Across both datasets and threshold settings, PSF consistently detects a higher number of significant pathways compared to the other methods. Furthermore, there is a greater overlap between pathways detected by PSF and GSDensity than those shared with ORA.
Figure 4
Figure 4. Comparison of spatially aware pathway analysis methods.
(A, B) Venn diagrams showing the overlap among pathways identified as spatially coordinated by two gene set–based methods (spatialGE and GSDensity) and by the PSF toolkit’s spatial pathway activity for (A) the human melanoma dataset and (B) the mouse brain dataset. (C, D) Spatial visualization of pathway relevance scores and PSF-derived activity values for the set of pathways detected by both GSDensity and PSF. (C) shows results for the melanoma tissue slice, and (D) for the mouse brain slice. PSF-derived activity values below zero were set to zero to match the nonnegative scale of GSDensity scores and to highlight regions of pathway upregulation on the tissue.
Figure 5
Figure 5. Terminal and input node connections between significantly deregulated pathways in border spot groups of adjacent clusters.
(A) A branch of the apoptosis pathway terminating in the FASL gene (outlined in red), upregulated in PSF cluster 0 (melanoma pigmentation), serves as an input node for the MAPK signaling pathway, which is upregulated in the adjacent PSF cluster 1 (melanoma immune response). (C) The Toll-like receptor pathway, activated in the border of PSF cluster 1, connects to FoxO signaling, activated in the border of PSF cluster 3, via the IL6 gene (outlined in red).

Similar articles

  • Prescription of Controlled Substances: Benefits and Risks.
    Preuss CV, Kalava A, King KC. Preuss CV, et al. 2025 Jul 6. In: StatPearls [Internet]. Treasure Island (FL): StatPearls Publishing; 2025 Jan–. 2025 Jul 6. In: StatPearls [Internet]. Treasure Island (FL): StatPearls Publishing; 2025 Jan–. PMID: 30726003 Free Books & Documents.
  • Short-Term Memory Impairment.
    Cascella M, Al Khalili Y. Cascella M, et al. 2024 Jun 8. In: StatPearls [Internet]. Treasure Island (FL): StatPearls Publishing; 2025 Jan–. 2024 Jun 8. In: StatPearls [Internet]. Treasure Island (FL): StatPearls Publishing; 2025 Jan–. PMID: 31424720 Free Books & Documents.
  • Signs and symptoms to determine if a patient presenting in primary care or hospital outpatient settings has COVID-19.
    Struyf T, Deeks JJ, Dinnes J, Takwoingi Y, Davenport C, Leeflang MM, Spijker R, Hooft L, Emperador D, Domen J, Tans A, Janssens S, Wickramasinghe D, Lannoy V, Horn SRA, Van den Bruel A; Cochrane COVID-19 Diagnostic Test Accuracy Group. Struyf T, et al. Cochrane Database Syst Rev. 2022 May 20;5(5):CD013665. doi: 10.1002/14651858.CD013665.pub3. Cochrane Database Syst Rev. 2022. PMID: 35593186 Free PMC article.
  • Sexual Harassment and Prevention Training.
    Cedeno R, Bohlen J. Cedeno R, et al. 2024 Mar 29. In: StatPearls [Internet]. Treasure Island (FL): StatPearls Publishing; 2025 Jan–. 2024 Mar 29. In: StatPearls [Internet]. Treasure Island (FL): StatPearls Publishing; 2025 Jan–. PMID: 36508513 Free Books & Documents.
  • Systemic treatments for metastatic cutaneous melanoma.
    Pasquali S, Hadjinicolaou AV, Chiarion Sileni V, Rossi CR, Mocellin S. Pasquali S, et al. Cochrane Database Syst Rev. 2018 Feb 6;2(2):CD011123. doi: 10.1002/14651858.CD011123.pub2. Cochrane Database Syst Rev. 2018. PMID: 29405038 Free PMC article.

References

    1. Bang J, Zippin JH. Cyclic adenosine monophosphate (cAMP) signaling in melanocyte pigmentation and melanomagenesis. Pigment Cell & Melanoma Research. 2021;34:28–43. doi: 10.1111/pcmr.12920. - DOI - PubMed
    1. Boccaccio A, Menini A, Pifferi S. The cyclic AMP signaling pathway in the rodent main olfactory system. Cell and Tissue Research. 2021;383:429–443. doi: 10.1007/s00441-020-03391-7. - DOI - PubMed
    1. Draghici S, Khatri P, Martins RP, Ostermeier GC, Krawetz SA. Global functional profiling of gene expression. Genomics. 2003;81:98–104. doi: 10.1016/s0888-7543(02)00021-6. - DOI - PubMed
    1. Eng C-HL, Lawson M, Zhu Q, Dries R, Koulena N, Takei Y, Yun J, Cronin C, Karp C, Yuan G-C, Cai L. Transcriptome-scale super-resolved imaging in tissues by RNA seqFISH+ Nature. 2019;568:235–239. doi: 10.1038/s41586-019-1049-y. - DOI - PMC - PubMed
    1. Gajewski TF, Schreiber H, Fu Y-X. Innate and adaptive immune cells in the tumor microenvironment. Nature Immunology. 2013;14:1014–1022. doi: 10.1038/ni.2703. - DOI - PMC - PubMed

LinkOut - more resources