. 2025 Aug 13:14:815-830.
doi: 10.2147/ITT.S534782. eCollection 2025.

PD-L1/ITGB4 Axis Modulates Sensitivity of Hepatocellular Carcinoma to Sorafenib via FAK/AKT/mTOR Signaling Pathway

Affiliations

PD-L1/ITGB4 Axis Modulates Sensitivity of Hepatocellular Carcinoma to Sorafenib via FAK/AKT/mTOR Signaling Pathway

Tao Zhu et al. Immunotargets Ther. .

Abstract

Background: Hepatocellular carcinoma (HCC) frequently develops resistance to sorafenib, a first-line treatment for advanced HCC. While PD-L1 contributes to immune evasion and direct tumor survival, its role in modulating sorafenib resistance via non-immunological pathways remains unclear. This study investigates the PD-L1/ITGB4 axis in regulating sorafenib sensitivity.

Methods: Bioinformatics analysis of HCC datasets identified PD-L1/ITGB4 co-expression. Protein interaction was validated via co-immunoprecipitation (Co-IP). Functional impacts on FAK/AKT/mTOR signaling were assessed using kinase inhibitors and gene knockdown in HCC cell lines. Sorafenib sensitivity was evaluated in vitro and in xenograft models with mono- and combination therapies (PD-L1/ITGB4 inhibition ± sorafenib).

Results: PD-L1 directly interacts with ITGB4 to activate the FAK/AKT/mTOR signaling pathway, independent of its immune-regulatory functions. This interaction critically mediates sorafenib resistance in HCC, as evidenced by significantly reduced drug sensitivity in PD-L1high/ITGB4high cells (p < 0.001). Crucially, genetic knockdown of either PD-L1 or ITGB4 effectively reversed this chemoresistance phenotype. In translational validation, combined pharmacological inhibition of the PD-L1/ITGB4 axis with sorafenib synergistically suppressed tumor progression in vivo, achieving >60% greater volume reduction compared to monotherapies.

Conclusion: The PD-L1/ITGB4 axis drives sorafenib resistance via FAK/AKT/mTOR hyperactivation. Dual targeting of PD-L1/ITGB4 enhances sorafenib efficacy, revealing a tumor-intrinsic mechanism and proposing a novel combinatorial strategy for HCC.

Keywords: FAK/AKT/mTOR; hepatocellular carcinoma; integrin beta 4; programmed cell death ligand-1; resistance.


Conflict of interest statement

The authors report no conflicts of interest in this work.

Figures
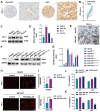
Figure 1
Figure 1
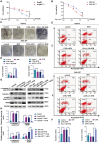
Revised PD-L1 Expression Profiles. (A) Representative immunohistochemical (IHC) staining images of PD-L1 in HCC tissues and adjacent non-tumorous tissues. (B) IHC scores for PD-L1 expression in HCC tumor tissues and adjacent non-tumorous tissues. (C and D) Western blotting was performed on different HCC cell lines and a normal liver cell line to assess PD-L1 protein levels. (E) Immunocytochemistry showing membrane-localized PD-L1 (brown) in HepG2 cells (Bar = 100 μm). (F and G) Lentiviral transfection experiments demonstrated altered PD-L1 expression in these cells via Western blotting. (H and I) Immunofluorescence demonstrating sorafenib-induced PD-L1 upregulation (red) (200 ×). (J and K) Cell viability was assessed using the CCK-8 assay for HCC cells, SFB-HCC cells and HCC cells with either overexpressed or knocked-down PD-L1 after sorafenib (4.0 μM) exposure. Data represent mean ± SD. *p < 0.05, **p < 0.01, ***p < 0.001; ns (not significant, p ≥ 0.05).
Figure 2
Figure 2
PD-L1 Impairs Sorafenib Efficacy in HCC Cells. (A and B) Cell viability was assessed using the CCK-8 assay for HepG2 and HepG2PD-L1+ cells and SNU-387 and SNU-387PD-L1- cells after 24-hour sorafenib exposure. (C and D) Proliferation was evaluated via the clonogenic assay for the different cell lines following sorafenib treatment. (E and F) Apoptosis was measured by flow cytometry and Western blot analysis after sorafenib administration. *p < 0.05, **p < 0.01, ***p < 0.001. SFB: Sorafenib. (IC50 = Antilog [B+(50-B)/(A-B)]×C, where A = log>50% drug concentration; B = log<50% drug concentration; C = log dilution factor). (G and H) Western blot analysis of apoptosis-related proteins (cleaved PARP/PARP and cleaved Caspase-3/Caspase-3) in sorafenib-treated cells.
Figure 3
Figure 3
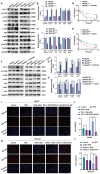
PD-L1 facilitates HCC proliferation and enhances sorafenib resistance via FAK/AKT/mTOR pathway. (AC) Protein expression and activation were assessed by Western Blot for FAK, AKT, MAPK, and mTOR in various cell lines. (D and E) Cell viability was determined using the CCK-8 assay for HepG2 cells with different PD-L1 expression levels treated with sorafenib and for SNU-387 cells with varying PD-L1 expression levels treated with sorafenib. (FH) Western Blot analysis depicted the activation levels of FAK, AKT, and mTOR in the distinct cell groups. (IL) EdU-594 experiment revealed the proliferative activity of HCC cells with diverse PD-L1 expression levels following sorafenib treatment. (×200). Data represent mean ± SD. *p < 0.05, **p < 0.01, ***p < 0.001; ns (not significant, p ≥ 0.05).
Figure 4
Figure 4
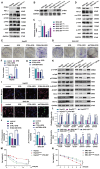
PD-L1 and ITGB4 Collaboration in Hepatocellular Carcinoma. (A) GEPIA database analysis reveals a positive correlation between PD-L1 and ITGB4 expression. (B) GEPIA database shows ITGB4 expression levels in different cancers and normal tissues. (C) High ITGB4 expression is associated with a poorer prognosis. Cutoff-High and Cutoff-Low represent the 60th percentile. Solid lines represent survival curves; dashed lines represent 95% confidence intervals. (D) ITGB4 staging analysis. (E) STRING database confirms the interaction between PD-L1 and ITGB4. (F) Western Blot experiments suggest a physical interaction between PD-L1 and ITGB4. (G) Co-IP experiments validate PD-L1 binding to ITGB4. (H) Confocal microscopy images reveal co-localization of PD-L1 (red) and ITGB4 (green). (Bar = 20 μm).Data represent mean ± SD. *p < 0.05, **p < 0.01, ***p < 0.001; ns (not significant, p ≥ 0.05).
Figure 5
Figure 5
Downregulation of ITGB4 Boosts Sorafenib Cytotoxicity in HCC Cells. (A) Western blot analysis revealed FAK/AKT/mTOR pathway activation following ITGB4 overexpression in HepG2 cells. (B and C) Immunoblotting confirmed ITGB4 interference with a targeting virus. (D) Western blot assessed FAK/AKT/mTOR pathway activation after ITGB4 interference in SNU-387 cells. (E and F) Colony formation assays evaluated HepG2 cell proliferation with ITGB4 expression levels post-sorafenib treatment. (G and H) Colony formation assays assessed SNU-387 cell proliferation with ITGB4 expression levels post-sorafenib treatment. (I and J) JC-1 assay determined early apoptosis ratios in HepG2 and SNU-387 cells 48 hours post-sorafenib treatment. (K and L) Western blot analysis measured 4EBP1 and p70S6K activation, along with apoptotic molecule expression. (M and N) Cell viability was determined using the CCK-8 assay for HepG2 cells with different ITGB4 expression levels treated with sorafenib and for SNU-387 cells with varying ITGB4 expression levels treated with sorafenib. Data represent mean ± SD. *p < 0.05, **p < 0.01, ***p < 0.001; ns (not significant, p ≥ 0.05).
Figure 6
Figure 6
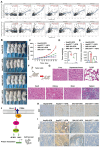
The PD-L1/ITGB4 Axis Correlates with Sorafenib Resistance in HCC In Vivo. (A) Analysis of the correlation between PD-L1 and ITGB4 expression and immune cell infiltration. (B) Images of xenograft tumors in NOD-SCID mice treated with various regimens. (C) Statistical graph of tumor weight outcomes. (D) Statistical graph of final tumor volume results. (E) Tumor-bearing mouse model image. (F) HE staining image of major mouse tissues and xenograft HCC tissues (200 ×). (G) Ki67 levels in tumor tissues of each experimental group (Bar = 50 μm). (H) IHC staining levels of Ki-67 in tumor tissues of each experimental group (Bar = 50μm). (I) IHC staining levels of PD-L1 and ITGB4 in tumor tissues of each experimental group (Bar = 50μm). (J) PD-L1-driven HCC progression model. *p < 0.05, **p < 0.01, ***p < 0.001.
Figure 7
Figure 7
PD-L1/ITGB4 Co-expression Predicts Sorafenib Resistance and Poor Prognosis in HCC Patients. (A) Association of PD-L1/ITGB4 Dual-High Expression with Sorafenib Resistance. (B) PD-L1/ITGB4 co-expression was significantly higher in sorafenib-resistant HCC patients compared to sorafenib-sensitive HCC patients. **p < 0.01 (C) Treatment outcomes were evaluated in 25 HCC patients, stratified by dual-high versus low-expression groups using Kaplan-Meier analysis. (D) Analysis using the Kaplan-Meier Plotter database demonstrated significantly reduced overall survival in PD-L1high/ITGB4high HCC patients (Log-rank p = 0.01). (E) Representative IHC Co-localization of PD-L1 and ITGB4 in Resistant and sensitive HCC (Bar = 200 μm).

Similar articles

References

    1. Donne R, Lujambio A. The liver cancer immune microenvironment: therapeutic implications for hepatocellular carcinoma. Hepatology. 2023;77(5):1773–1796. doi: 10.1002/hep.32740 - DOI - PMC - PubMed
    1. Llovet JM, Kelley RK, Villanueva A, et al. Hepatocellular carcinoma. Nat Rev Dis Primers. 2021;7(1):6. doi: 10.1038/s41572-020-00240-3 - DOI - PubMed
    1. Yang JD, Hainaut P, Gores GJ, Amadou A, Plymoth A, Roberts LR. A global view of hepatocellular carcinoma: trends, prevention and management. Nat Rev Gastroenterol Hepatol. 2019;16(10):589–604. doi: 10.1038/s41575-019-0186-y - DOI - PMC - PubMed
    1. Lee C, Kim MJ, Kumar A, Lee HW, Yang Y, Kim Y. Vascular endothelial growth factor signaling in health and disease: from molecular mechanisms to therapeutic perspectives. Signal Transduct Target Ther. 2025;10(1):170. - PMC - PubMed
    1. Iovino M, Colonval M, Wilkin C, et al. Novel XBP1s-independent function of IRE1 RNase in HIF-1α-mediated glycolysis upregulation in human macrophages upon stimulation with LPS or saturated fatty acid. Front Immunol. 2023;14:1204126. doi: 10.3389/fimmu.2023.1204126 - DOI - PMC - PubMed

LinkOut - more resources