. 2025 Nov;12(42):e05656.
doi: 10.1002/advs.202505656. Epub 2025 Aug 19.

EETs Reduction Contributes to Granulosa Cell Senescence and Endometriosis-Associated Infertility via the PI3K/AKT/mTOR Signaling Pathway

Affiliations

EETs Reduction Contributes to Granulosa Cell Senescence and Endometriosis-Associated Infertility via the PI3K/AKT/mTOR Signaling Pathway

Xiang Lin et al. Adv Sci (Weinh). 2025 Nov.

Abstract

We aimed to examine abnormal oxidative lipid levels and their related mechanisms in EM-associated infertility. Through liquid chromatography tandem mass spectrometry analysis, decreased levels of epoxyeicosatrienoic acids (EETs), which have antioxidant and anti-senescence effects are observed, in EM patient follicular fluid samples. EET levels are positively correlated with in vitro fertilization outcomes. Lower 14, 15-EET concentrations led to a decreased GC antioxidant capacity, reduced ATP production, reactive oxygen species (ROS) accumulation in oocytes, and abnormal cumulus-oocyte complex (COC) expansion, ultimately resulting in decreased fertility. Elevated soluble epoxide hydrolase (EPHX2) expression in EM-GCs is the main reason for EET reduction in EM follicular fluid. Inhibiting EPHX2 in vivo or in vitro can reverse these observed abnormalities by upregulating EETs. 14, 15-EET treatment alleviated GC senescence and improved fertility by inhibiting excessive PI3K/AKT/mTOR signaling pathway activation in EM-GCs, with BEZ-235-mediated inhibition of this pathway significantly alleviating ROS-induced cell senescence and abnormal COC expansion. Oxidative stress-induced decreased EZH2/H3K27Me3 histone methylation led to elevated EPHX2 expression patterns in EM-GCs. Decreased 14, 15-EET levels resulted in ROS accumulation, reduced EZH2 enzymatic activity, less EPHX2/H3K27Me3 histone methylation, and increased EPHX2 protein expression levels, which further reduced 14, 15-EET levels in a vicious feedback loop.

Keywords: 14, 15‐EET; EPHX2; EZH2/H3K27Me3; PI3K/AKT/mTOR signaling pathway; ROS; cellular senescence; endometriosis; ovary granulosa cell.


Conflict of interest statement

The authors declare no conflict of interest.

Figures
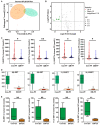
Figure 1
Figure 1
Epoxyeicosatrienoic acid (EET) concentrations were decreased in follicular fluid (FF), peritoneal fluid (PF), and ovary granulosa cells (GCs) of endometriosis (EM)‐associated infertility patients. A) Liquid chromatography tandem mass spectrometry (LC‐MS/MS) analysis was performed on 101 FF samples, as well as orthogonal partial least squares discriminant analysis (OPLS‐DA). The X‐axis represents the predictive principal components, showing the differences between groups. The Y‐axis represents the orthogonal principal components, showing the differences within groups. The percentage indicates the explanatory power of each component in the dataset. Each point in the graph represents a sample, with samples from the same group represented by the same color. The orange points represent 45 FF samples from the control group (Con), while the cyan points represent 56 FF samples from the EM group. B) A volcano plot of the differential metabolites between the 45 Con‐FF and 56 EM‐FF samples. Each point in the volcano plot represents a metabolite, with the X‐axis indicating the Log2 (Fold Change) of a metabolite between the two sample types and the Y‐axis indicating the ‐Log10 (P‐value). Green points represent differentially downregulated metabolites, red points represent differentially upregulated metabolites, and gray points represent metabolites that were detected but not significantly different.C) A violin plot depicting the levels of four EETs (5, 6‐EET, 8, 9‐EET, 11, 12‐EET, and 14, 15‐EET) between the 45 Con‐FF and 56 EM‐FF samples. The middle box represents the interquartile range, with the thin black lines extending from the box representing the 95% confidence interval. The black horizontal line in the middle represents the median and the outer shapes represent EET distribution density. Each point in the graph represents one sample. Unpaired t‐test, * P < 0.05, ** P < 0.01. D) LC‐MS/MS analysis was performed on 10 PF samples. Box plots of 5, 6‐EET, 8, 9‐EET, 11, 12‐EET, and 14, 15‐EET in the four Con‐PF and six EM‐PF samples. Unpaired t‐test, * P < 0.05. E) Targeted LC‐MS/MS analysis was performed on 10 ovary GC samples. Box plots of 5, 6‐EET, 8, 9‐EET, 11, 12‐EET, and 14, 15‐EET in the five Con‐GC and five EM‐GC samples. Unpaired t‐test, ** P < 0.01.
Figure 2
Figure 2
Decreased epoxyeicosatrienoic acid (EET) levels in follicular fluid (FF) samples correlated with reduced numbers of retrieved oocytes, mature oocytes, two pronucleus (2PN) embryos, total embryos, and good quality embryos. From the targeted liquid chromatography tandem mass spectrometry (LC‐MS/MS) quantitative analysis results in the 101 FF samples, we summed the values of the 5, 6‐EET, 8, 9‐EET, 11, 12‐EET, and 14, 15‐EET levels in FF to obtain the EET Score. A correlation analysis was then conducted with clinical data. A) Scatter diagram showing the linear regression and significant Pearson correlation of the oocyte retrieval number with the EET Score in 101 FF samples from the LC‐MS/MS analysis results (n = 101); r = 0.782, P < 0.001. B) Scatter diagram showing the linear regression and significant Pearson correlation of the mature oocyte number with the EET Score in FF samples (n = 101); r = 0.772, P < 0.001. C) Scatter diagram showing the linear regression and significant Pearson correlation of the total embryo number with the EET Score (n = 101); r = 0.750, P < 0.001. D) Scatter diagram showing the linear regression and significant Pearson correlation of the 2PN embryo number with the EET Score (n = 101); r = 0.773, P < 0.001. E) Scatter diagram showing the linear regression and significant Pearson correlation of the good quality embryo number with the EET Score (n = 101); r = 0.636, P < 0.001. F) Summary of the relationships between EET levels and in vitro fertilization (IVF) outcomes.
Figure 3
Figure 3
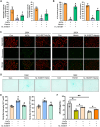
14, 15‐EET administration rescued the reactive oxygen species (ROS)‐induced antioxidant capacity reduction, ATP reduction, and mitochondrial transmembrane potential (MMP) decrease, and alleviated mouse granulosa cell (mGC) senescence. A) Antioxidant capacity assay of mGCs after 14, 15‐EET pre‐treatment for 24 h followed by H2O2 or hemin treatment for 24 h. Paired t‐test, * P < 0.05 (H2O2 or hemin vs Con), #P < 0.05 (14, 15‐EET + H2O2 vs H2O2 alone, or 14, 15‐EET + hemin vs hemin alone). () Intracellular ATP assay of mGCs after 14, 15‐EET pre‐treatment for 24 h followed by H2O2 or hemin treatment for 24 h. Paired t‐test, * P < 0.05 (H2O2 or hemin vs Con), #P < 0.05 (14, 15‐EET + H2O2 vs H2O2 alone, or 14, 15‐EET + hemin vs hemin alone). C) JC‐1‐based immunofluorescence assay of mGCs, with representative images of mGCs after 14, 15‐EET pre‐treatment for 24 h followed by H2O2 or hemin treatment for 24 h. Red represents the JC‐1 aggregate signal and green represents the JC‐1 monomer signal; scale bar 50 µm, original magnification: 200×. D) Senescence‐associated β‐galactosidase (SA‐β‐gal) staining assay of mGCs after 14, 15‐EET pre‐treatment for 24 h followed by H2O2 or hemin treatment for 24 h. Magnification, 100×. E) SA‐β‐gal quantitative assay of mGCs after 14, 15‐EET pre‐treatment for 24 h followed by H2O2 or hemin treatment for 24 h. Paired t‐test, * P < 0.05 (H2O2 or hemin vs Con), #P < 0.05 (14, 15‐EET + H2O2 vs H2O2 alone, or 14, 15‐EET + hemin vs hemin alone). F) soluble Receptor for Advanced Glycosylation End products (sRAGE) enzyme‐linked immunosorbent assay (ELISA) in mGC culture supernatants after 14, 15‐EET pre‐treatment for 24 h followed by H2O2 or hemin treatment for 24 h. Paired t‐test, * P < 0.05, ** P < 0.01.
Figure 4
Figure 4
Decreased EZH2/H3K27Me3 histone methylation led to increased EPHX2 expression levels in endometriosis ovary granulosa cells (EM‐GCs). A) Western blot analysis of the indicated proteins from five Con‐GC and eight EM‐GC samples. B) Protein quantification analysis of the indicated proteins from five Con‐GC and eight EM‐GC samples. Unpaired t‐test, ** P < 0.01, *** P < 0.001. C) qRT‐PCR results of Ezh2 and Ephx2 mRNA expression levels in primary mouse GCs (mGCs) transduced with lentiviral vectors expressing a short hairpin RNA (shRNA) targeting EZH2 (Sh‐EZH2) or negative control (Sh‐NC) for 24 h. Paired t‐test, ** P < 0.01. D) Western blot analysis of EZH2, H3K27Me3, and EPHX2 protein levels in mGCs after treatment with Sh‐EZH2 or Sh‐NC for 48 h. E) Mice with GC‐specific knockout of Ezh2 (KO mice) were generated by crossing Cyp19a1‐Cre mice with Ezh2 flox/flox mice, as described previously.[ 9 ] ChIP‐PCR data showing the fold change of the immunoprecipitated Ephx2 mRNA in freshly collected mGCs extracted from wild‐type (WT) and KO mice at HCG‐4 h (n = 20 for WT, n = 21 for KO). ChIP‐qPCR results showing Ephx2 mRNA enrichment after IP with an anti‐H3K27Me3 antibody or control IgG using two different primers (primer 1 and primer 2). ChIP‐PCR data are shown as the mean ± standard deviation (SD) of three independent experiments. Paired t‐test, ** P < 0.01, *** P < 0.001.
Figure 5
Figure 5
Inhibiting EPHX2 via lentiviral knockdown or TPPU treatment partially attenuated reactive oxygen species (ROS)‐induced cell senescence in vitro. Our previous work demonstrated that ROS can suppress histone methylation by inducing the nuclear to cytoplasmic distribution of EZH2 and inhibiting H3K27Me3 modifications in granulosa cells (GCs).[ 2 , 9 ] Treatment with 100 µm H2O2 or 10 µm hemin was used to induce an excessive oxidative stress microenvironment, which was maintained until the end of each experiment. A) qRT‐PCR results of Ezh2 and Ephx2 mRNA expression levels in mouse GCs (mGCs) after H2O2 or hemin pre‐treatment for 12 h followed by LV‐EZH2 or LV‐NC treatment for 24 h. Paired t‐test, * P < 0.05, ** P < 0.01, *** P < 0.001. B) Western blot analysis of the indicated proteins from mGCs after H2O2 or hemin pre‐treatment for 12 h followed by LV‐EZH2 or LV‐NC treatment for 48 h. C) qRT‐PCR results of Ezh2 and Ephx2 mRNA expression levels in mGCs after H2O2 or hemin pre‐treatment for 12 h followed by Sh‐EPHX2 or Sh‐NC treatment for 24 h. Paired t‐test, ** P < 0.01, *** P < 0.001. D) Western blot analysis of the indicated proteins from mGCs after H2O2 or hemin pre‐treatment for 12 h followed by Sh‐EPHX2 or Sh‐NC treatment for 48 h. E) Western blot analysis of the indicated proteins from mGCs after TPPU or DMSO pre‐treatment for 24 h followed by H2O2 or hemin treatment for 48 h. F) Western blot analysis of the indicated proteins in mGCs after transduction with Sh‐EPHX2 or Sh‐NC for 48 h. No excessive oxidative stress was induced in this experiment. G) 14, 15‐EET enzyme‐linked immunosorbent assay (ELISA) results in mGC culture supernatants after H2O2 or hemin pre‐treatment for 12 h followed by Sh‐EPHX2 or Sh‐NC treatment for 48 h. Paired t‐test, ** P < 0.01. H) Representative SA‐β‐gal staining assay image for mGCs after H2O2 pre‐treatment for 12 h followed by Sh‐EPHX2 or Sh‐NC treatment for 24 h. Magnification, 100×. (I) SA‐β‐gal quantitative assay of mGCs after H2O2 or hemin pre‐treatment for 12 h followed by Sh‐EPHX2 or Sh‐NC treatment for 24 h. Paired t‐test, ** P < 0.01.
Figure 6
Figure 6
EPHX2 overexpression aggravated mouse granulosa cell (mGC) senescence via suppressing 14, 15‐EET levels, while the EPHX2 enzyme inhibitor TPPU rescued reactive oxygen species (ROS)‐induced cell senescence in vitro. A) Western blot analysis of the indicated proteins in mGCs after transduction with LV‐NC‐1 or LV‐EZH2 for 24 h followed by LV‐NC‐2 or LV‐EPHX2 treatment for 48 h. LV‐EZH2 is the lentiviral vector overexpressing EZH2; LV‐NC‐1 is the corresponding negative control. LV‐EPHX2 is the lentiviral vector overexpressing EPHX2; LV‐NC‐2 is the corresponding negative control. B) Antioxidant capacity assay of mGCs after LV‐EZH2 pre‐treatment for 24 h followed by LV‐EPHX2 treatment for 24 h. Paired t‐test, *** P < 0.001. C) SA‐β‐gal staining assay of mGCs after LV‐EZH2 pre‐treatment for 24 h followed by LV‐EPHX2 treatment for 24 h. Magnification, 100×. D) Excessive oxidative stress was induced via 100 µm H2O2 or 10 µm hemin treatment in mGCs, which was maintained until the end of each experiment. 14, 15‐EET enzyme‐linked immunosorbent assay (ELISA) in mGC culture supernatants after LV‐EZH2 pre‐treatment for 24 h followed by LV‐EPHX2 treatment for 48 h. Paired t‐test, ** P < 0.01. E) SA‐β‐gal quantitative assay of mGCs after LV‐EZH2 pre‐treatment for 24 h followed by LV‐EPHX2 treatment for 24 h under oxidative stress. Paired t‐test, ** P < 0.01. F) Western blot analysis of the indicated proteins from mGCs after TPPU or DMSO pre‐treatment for 24 h followed by H2O2 or hemin treatment for 48 h. G) 14, 15‐EET ELISA in mGC culture supernatants after TPPU or DMSO pre‐treatment for 24 h followed by H2O2 or hemin treatment for 48 h. Paired t‐test, ** P < 0.01. H) SA‐β‐gal quantitative assay of mGCs after TPPU pre‐treatment for 24 h followed by H2O2 or hemin treatment for 24 h. Paired t‐test, * P < 0.05 (H2O2 or hemin vs Con), #P < 0.05 (TPPU + H2O2 vs H2O2 alone, or TPPU + hemin vs hemin alone).
Figure 7
Figure 7
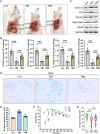
TPPU gavage rescued ovarian granulosa cell (GC) senescence in an endometriosis (EM) mouse model by upregulating EET levels. A) Representative visible lesions within the peritoneal cavity of EM mice and TEM mice (EM mouse that treated with TPPU gavage). No significant change was found in the ectopic cyst volume between the TEM and EM groups. For TEM mice, 3 mg kg−1 TPPU intragastric administration began on the 14th day after endometrium transplantation surgery and was continued until sample collection. B) Targeted liquid chromatography tandem mass spectrometry (LC‐MS/MS) analysis was performed on freshly extracted mouse GCs (mGCs) (n = 7 for Con group, n = 9 for EM group, n = 8 for TEM group). Unpaired t‐test, *** P < 0.001. C) Western blot analysis of the indicated proteins in freshly extracted mGCs (n = 3 for Con group, n = 3 for EM group, n = 3 for TEM group). D) SA‐β‐gal staining assay of freshly extracted mGCs (n = 3 for Con group, n = 3 for EM group, n = 3 for TEM group). Magnification, 200×. E) SA‐β‐gal quantitative assay of freshly extracted mGCs (n = 6 for Con group, n = 6 for EM group, n = 6 for TEM group). Unpaired t‐test, * P < 0.05 (EM vs Con), #P < 0.05 (TEM vs EM). F) The development of mouse model fertility within six months of mating (n = 7 for Con group, n = 7 for EM group, n = 7 for TEM group). The horizontal axis shows the time (days) from mating and the vertical axis indicates the average pup number of each delivery (pups/delivery). Unpaired t‐test, * P < 0.05 (EM vs Con), #P < 0.05 (TEM vs EM). G) Violin plot of the average number of pups per delivery within six months (n = 7 for Con group, n = 7 for EM group, n = 7 for TEM group). One dot represents one delivery, with 8 deliveries occurring in the Con group and seven deliveries each occurring in the EM and TEM groups. Unpaired t‐test, * P < 0.05, *** P < 0.001.
Figure 8
Figure 8
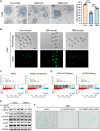
TPPU gavage improved the cumulus‐oocyte complex (COC) expansion rate of endometriosis (EM) model mice and alleviated the reactive oxygen species (ROS) levels of their oocytes. A) In vitro COC expansion assay results. The defective COC expansion in EM mice was partially rescued by TPPU treatment. Images shown in the left panel were acquired 12 h after COC culture in vitro. Magnification, 100×. The right panel shows the statistical analysis of the average COC expansion rates from four Con mice, four EM mice, and four TEM mice. Unpaired t‐test, *** P < 0.001. B) ROS fluorescence staining (green) in MII oocytes from the Con, EM, and TEM group. Each group included oocytes from three different mice for analysis. Scale bar 100 µm, Magnification, 100×. C) RNA‐Sequencing results of mouse granulosa cells (mGCs) (n = 5 for Con group, n = 5 for EM group), with Gene Set Enrichment Analysis (GSEA) revealing an enrichment of functional genes from the “Aging” and “Cellular senescence” gene sets in the EM group compared with the Con group (with NES = 1.88, 1.73, respectively). NES, normalized enrichment score; false discovery rate (FDR) of all sets were less than 25%, and all P‐values were less than 0.01. D) GSEA revealed overactivation of functional genes from the “PI3K‐Akt signaling pathway” and “mTOR signaling pathway” gene sets in the EM group compared with the Con group (with NES = 2.07, 1.80, respectively). E) Western blot analysis of the indicated proteins after ROS induction, 14, 15‐EET pre‐treatment, and 14, 15‐EET pre‐treatment followed by AKT reactivation by 20 µm SC79. (F) SA‐β‐gal staining assay of mGCs after 14, 15‐EET pre‐treatment for 24 h followed by 20 µm SC79‐mediated AKT reactivation for another 24 h. Magnification, 100×.
Figure 9
Figure 9
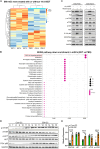
14, 15‐EET rescued reactive oxygen species (ROS)‐induced mouse granulosa cell (mGC) senescence in vitro via suppressing PI3K‐AKT‐mTOR signaling pathway overactivation. A) mGCs were collected from six endometriosis (EM) model mice and cultured in DMEM/F‐12 with 5% FBS for 24 h. Then, 100 nm 14, 15‐EET was added to the EET group for another 24 h, with an equivalent volume of PBS added to the control group (PBS). To explore the function of 14, 15‐EET in EM ovarian GCs, six groups of mGCs were collected for RNA‐sequencing analysis (n = 3 for PBS group, n = 3 for EET group). A heat map showing the differentially expressed genes, including 113 upregulated and 88 downregulated genes, in the EET group. B) The KEGG analysis results indicated significantly decreased enrichment of the “PI3K‐AKT signaling pathway” in mGCs after 14, 15‐EET treatment. C) Western blot analysis of the indicated proteins from mGCs after 14, 15‐EET pre‐treatment for 24 h followed by H2O2 or hemin treatment for 48 h. mGCs were extracted from immature ICR mice and oxidative stress was induced via 100 µm H2O2 or 10 µm hemin treatment. D) Western blot analysis of the indicated proteins from seven Con‐GC and eight EM‐GC samples. E) Protein quantification analysis of the indicated proteins from seven Con‐GC and eight EM‐GC samples. Unpaired t‐test, *** P < 0.001.
Figure 10
Figure 10
The PI3K‐AKT‐mTOR inhibitor BEZ‐235 rescued the defective cumulus‐oocyte complex (COC) expansion in endometriosis (EM) and alleviated mouse granulosa cell (mGC) senescence in vitro and in vivo. A) Western blot analysis of the indicated proteins in freshly extracted mGCs (n = 3 for Con group, n = 3 for EM group, n = 3 for TEM group, the same samples as described in Figure 7C). B) Western blot analysis of the indicated proteins in mGCs after 20 µm TPPU pre‐treatment for 24 h followed by H2O2 or hemin treatment for 48 h. mGCs were extracted from immature ICR mice. C) Western blot analysis of the indicated proteins in freshly extracted mGCs (n = 3 for Con group, n = 3 for EM group, n = 3 for BEM group; the BEM group received intragastric administration of 20 mg kg−1 BEZ‐235 daily for two weeks). D) SA‐β‐gal staining assay of freshly extracted mGCs (n = 3 for Con group, n = 3 for EM group, n = 3 for BEM group; the BEM group received intragastric administration of 20 mg kg−1 BEZ‐235 daily for two weeks). Magnification, 200×. (E) SA‐β‐gal quantitative assay of freshly extracted mGCs (n = 6 for Con group, n = 6 for EM group, n = 6 for BEM group). Unpaired t‐test, * P < 0.05 (EM vs Con), #P < 0.05 (BEM vs EM). F) In vitro COC expansion assay results. The defective EM‐COC expansion was partially rescued by BEZ‐235 treatment. The images shown in the left panel were acquired 12 h after COC culture in vitro. Magnification, 100×. The right panel shows the statistical analysis of the average COC expansion rates from four Con mice, four EM mice, and four BEM mice. Unpaired t‐test, *** P < 0.001. G) Western blot analysis of the indicated proteins in mGCs after 200 nm BEZ‐235 pre‐treatment for 24 h followed by H2O2 or hemin treatment for 48 h. mGCs were extracted from immature ICR mice.

References

    1. Tanbo T., Fedorcsak P., Acta. Obstet. Gyn. Scan. 2017, 96, 659. - PubMed
    1. Lin X., Dai Y. D., Tong X. M., Xu W. Z., Huang Q. M., Jin X. Y., Li C., Zhou F., Zhou H. J., Lin X. N., et al., Redox Biol. 2020, 30, 101431. - PMC - PubMed
    1. Leone Roberti Maggiore U., Chiappa V., Ceccaroni M., Roviglione G., Savelli L., Ferrero S., Raspagliesi F., Spano Bascio L., Best Pract. Res. Clin. Obstet. Gynaecol. 2024, 92, 102454. - PubMed
    1. de Ziegler D., Borghese B., Chapron C., Lancet 2010, 376, 730. - PubMed
    1. Hayashi S., Nakamura T., Motooka Y., Ito F., Jiang L., Akatsuka S., Iwase A., Kajiyama H., Kikkawa F., Toyokuni S., Redox Biol. 2020, 37, 101726. - PMC - PubMed

MeSH terms

LinkOut - more resources