. 2025 Aug 19:ehaf581.
doi: 10.1093/eurheartj/ehaf581. Online ahead of print.

LIPA, a risk locus for coronary artery disease: decoding the variant-to-function relationship

Affiliations

LIPA, a risk locus for coronary artery disease: decoding the variant-to-function relationship

Fang Li et al. Eur Heart J. .

Abstract

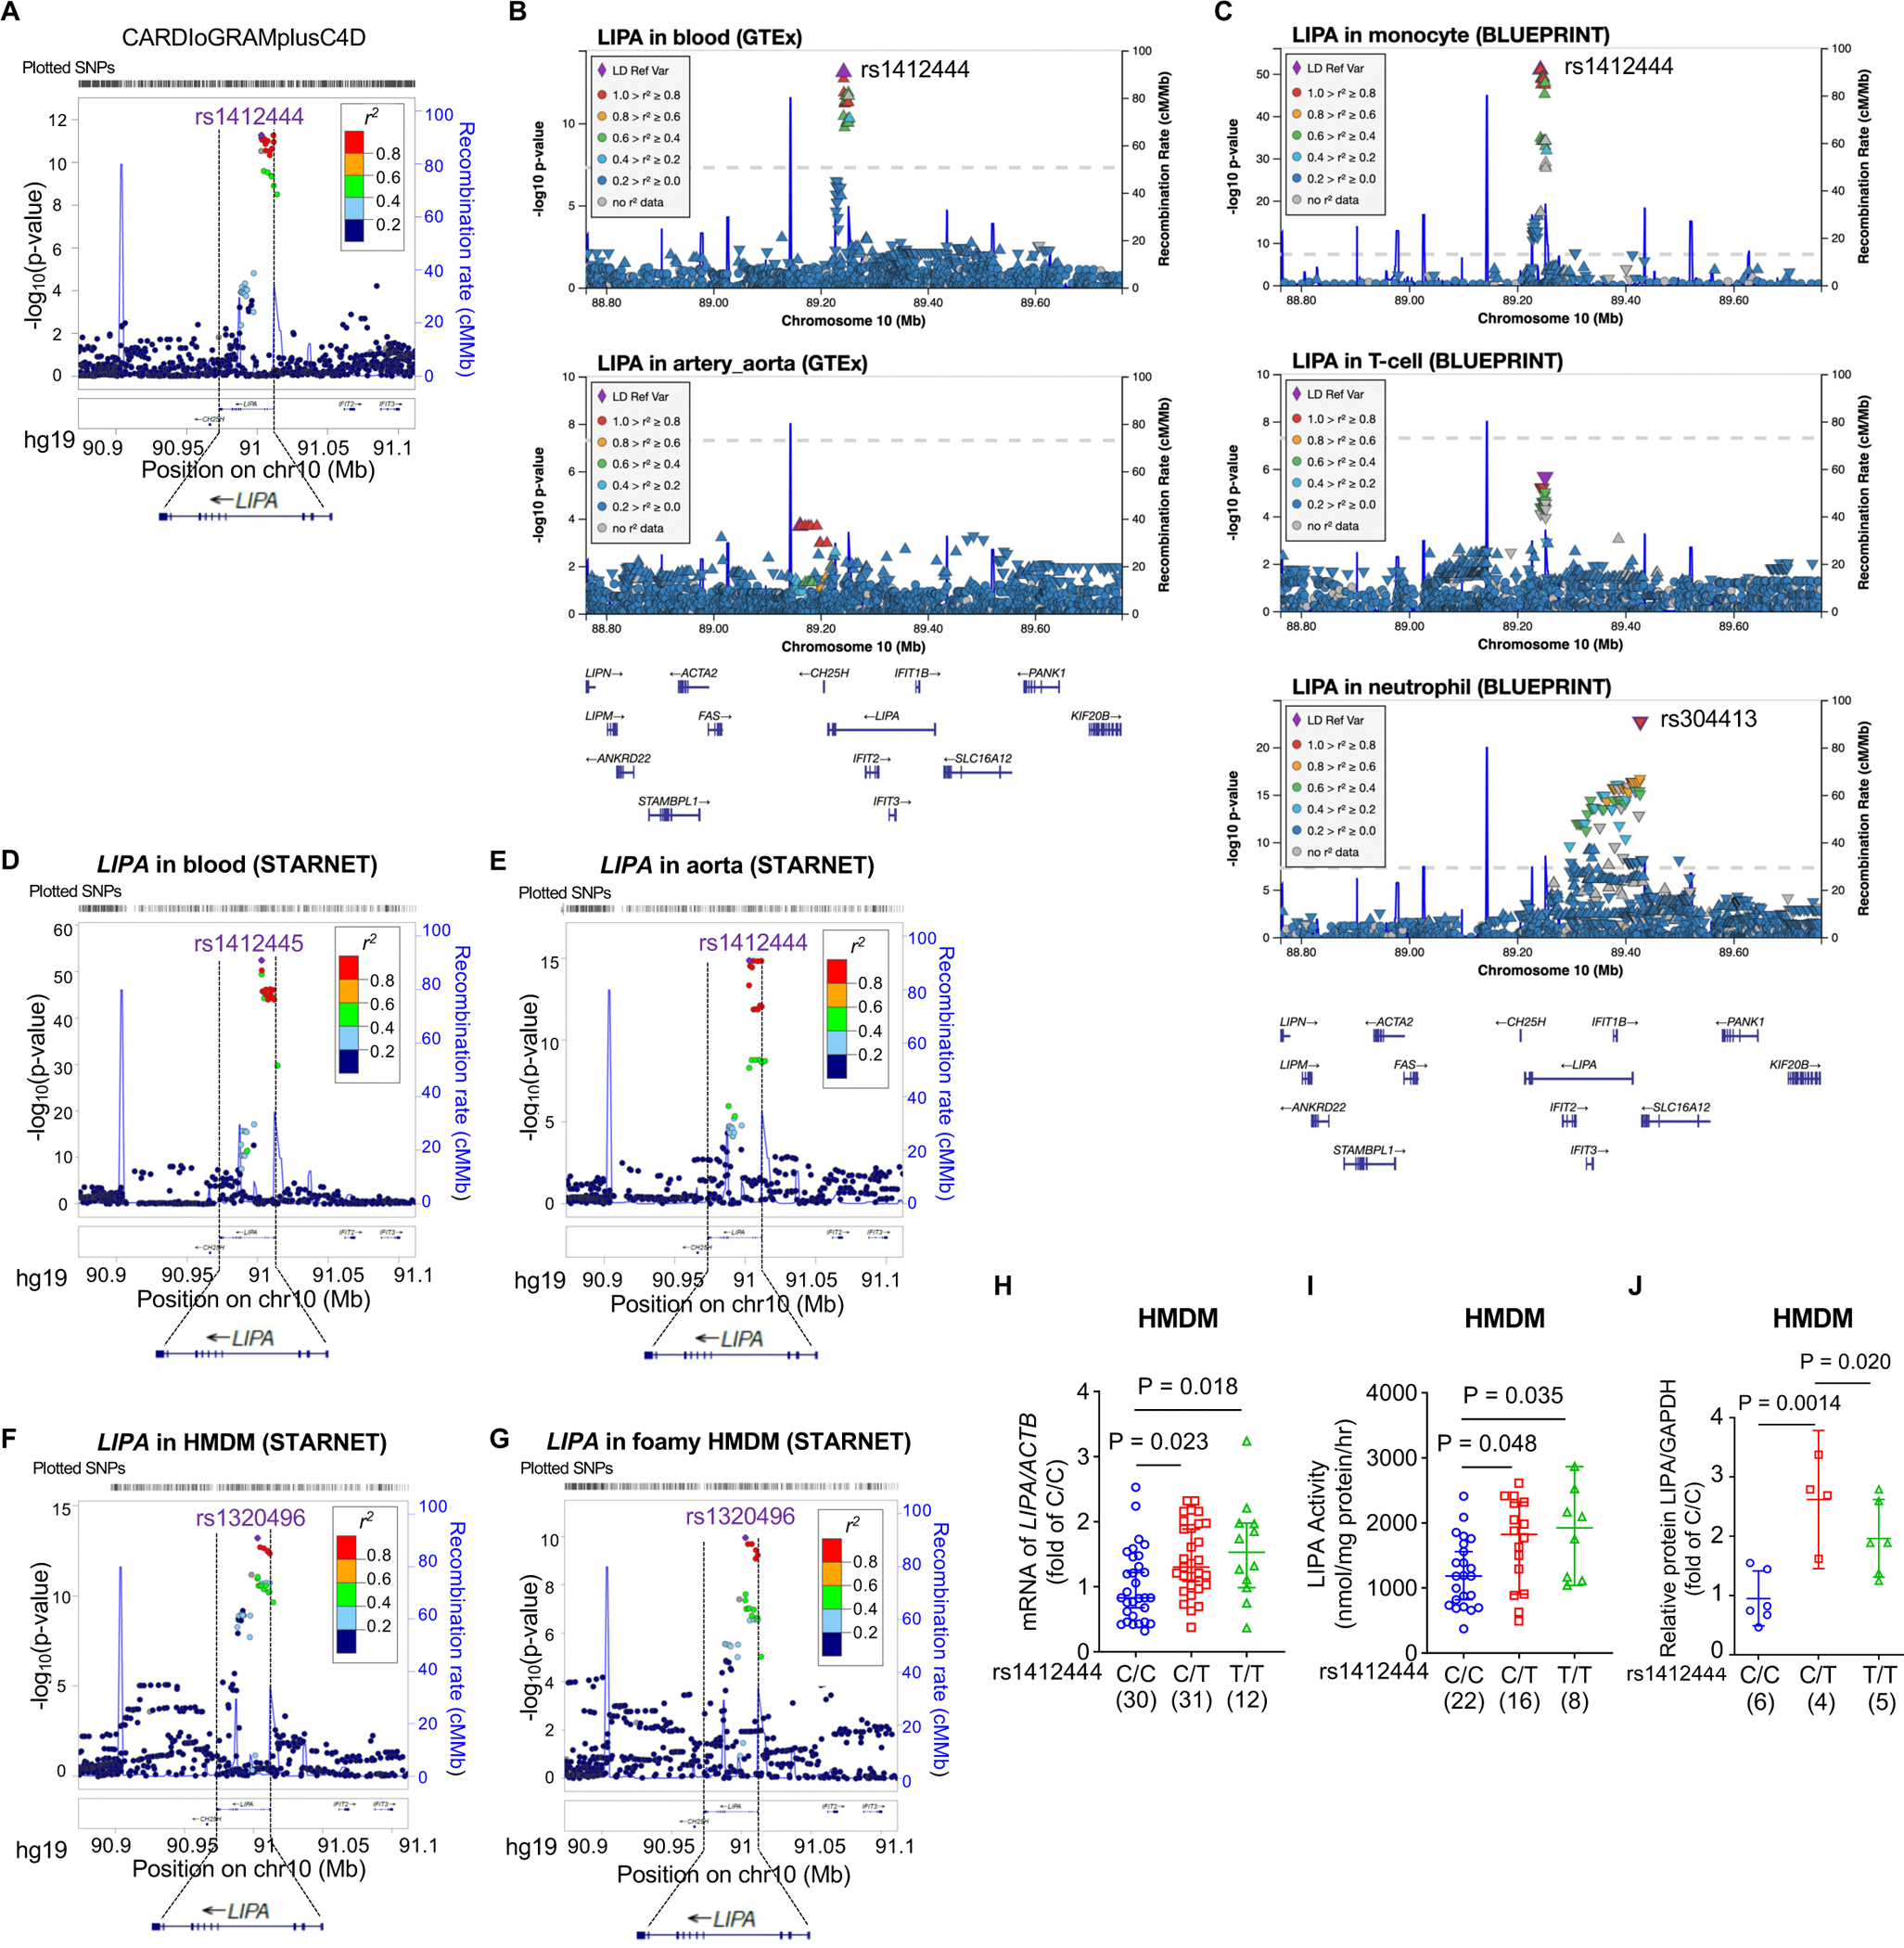
Background and aims: Translating human genomic discoveries into mechanistic insights requires linking genetic variations to candidate genes and their causal functional phenotypes. Genome-wide association studies have consistently identified LIPA (lipase A, lysosomal acid type) as a risk locus for coronary artery disease, with previous analyses prioritising LIPA as a likely causal gene. However, functional studies elucidating causal variants, regulatory mechanisms, target cell types, and their causal impact on atherosclerosis have been lacking. This study aims to address this gap by establishing the variant-to-function relationship at the LIPA locus.

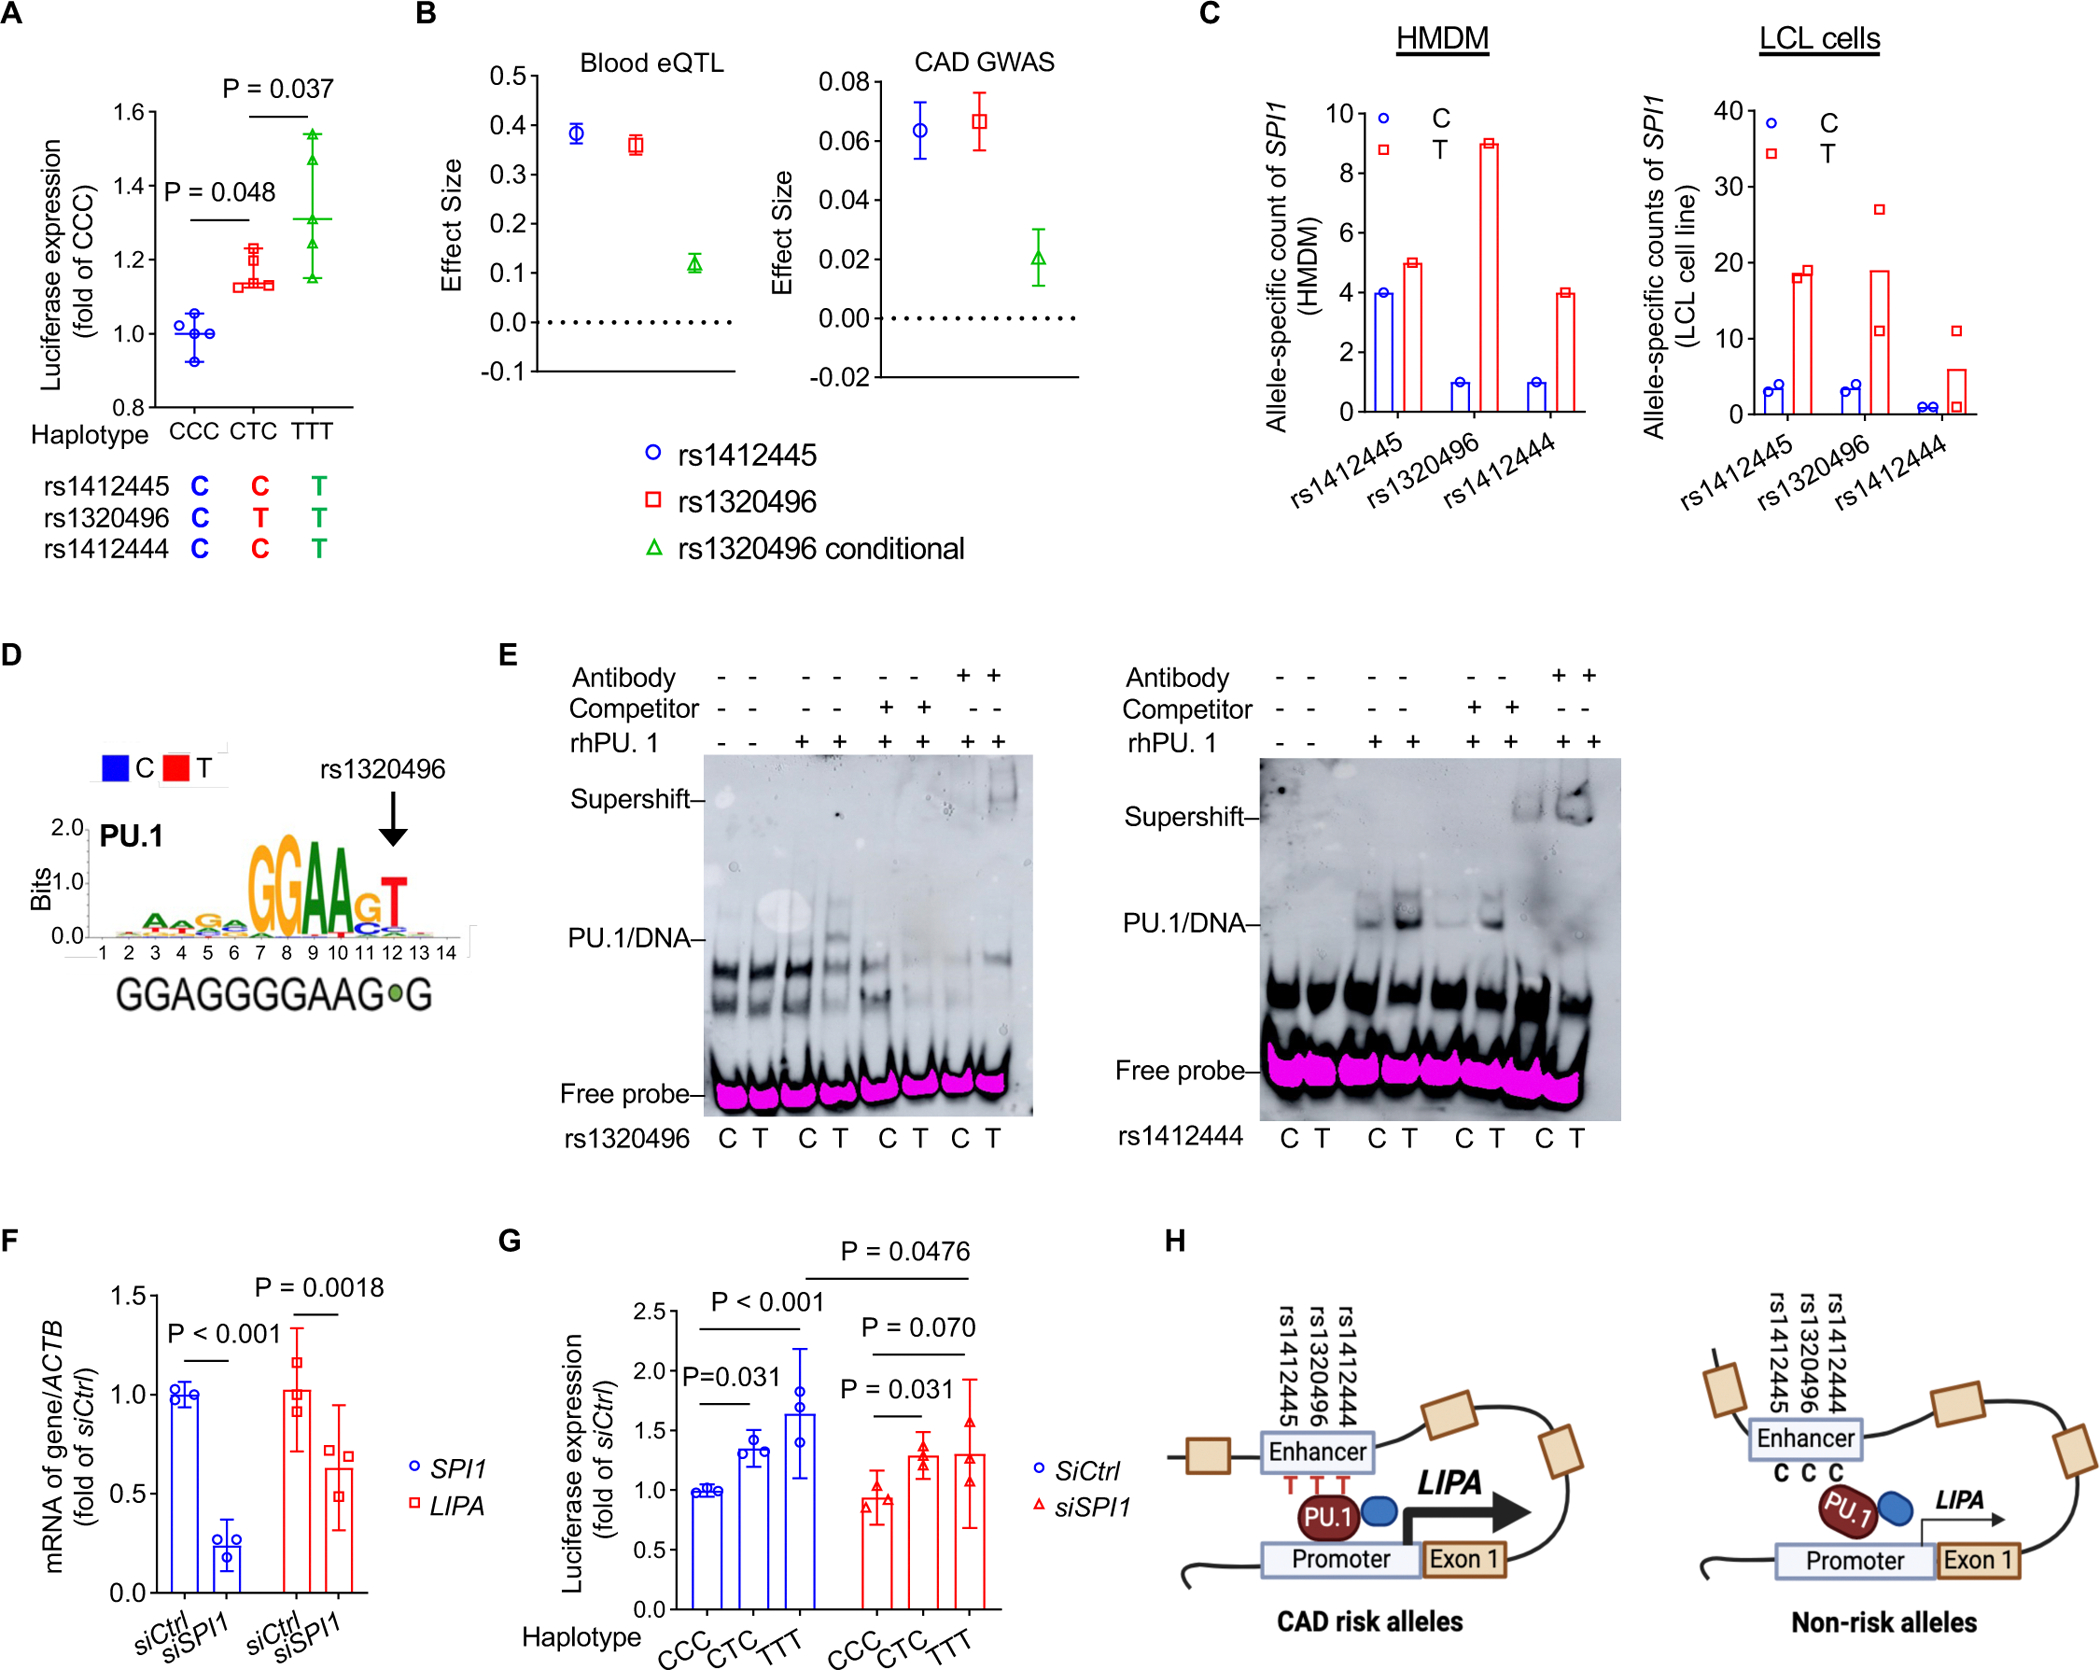
Methods: Post-genome-wide association study pipelines and molecular biology techniques, including expression quantitative trait loci analysis, Tri-HiC, luciferase assay, CRISPRi, allele-specific binding, motif analysis, and electrophoretic mobility shift assay, were used to link functional variants to target genes and define the direction of their regulatory effects in causal cell types. To determine how increased myeloid LIPA impacts atherosclerosis, myeloid-specific Lipa overexpression mice on an Ldlr-/- background were generated.

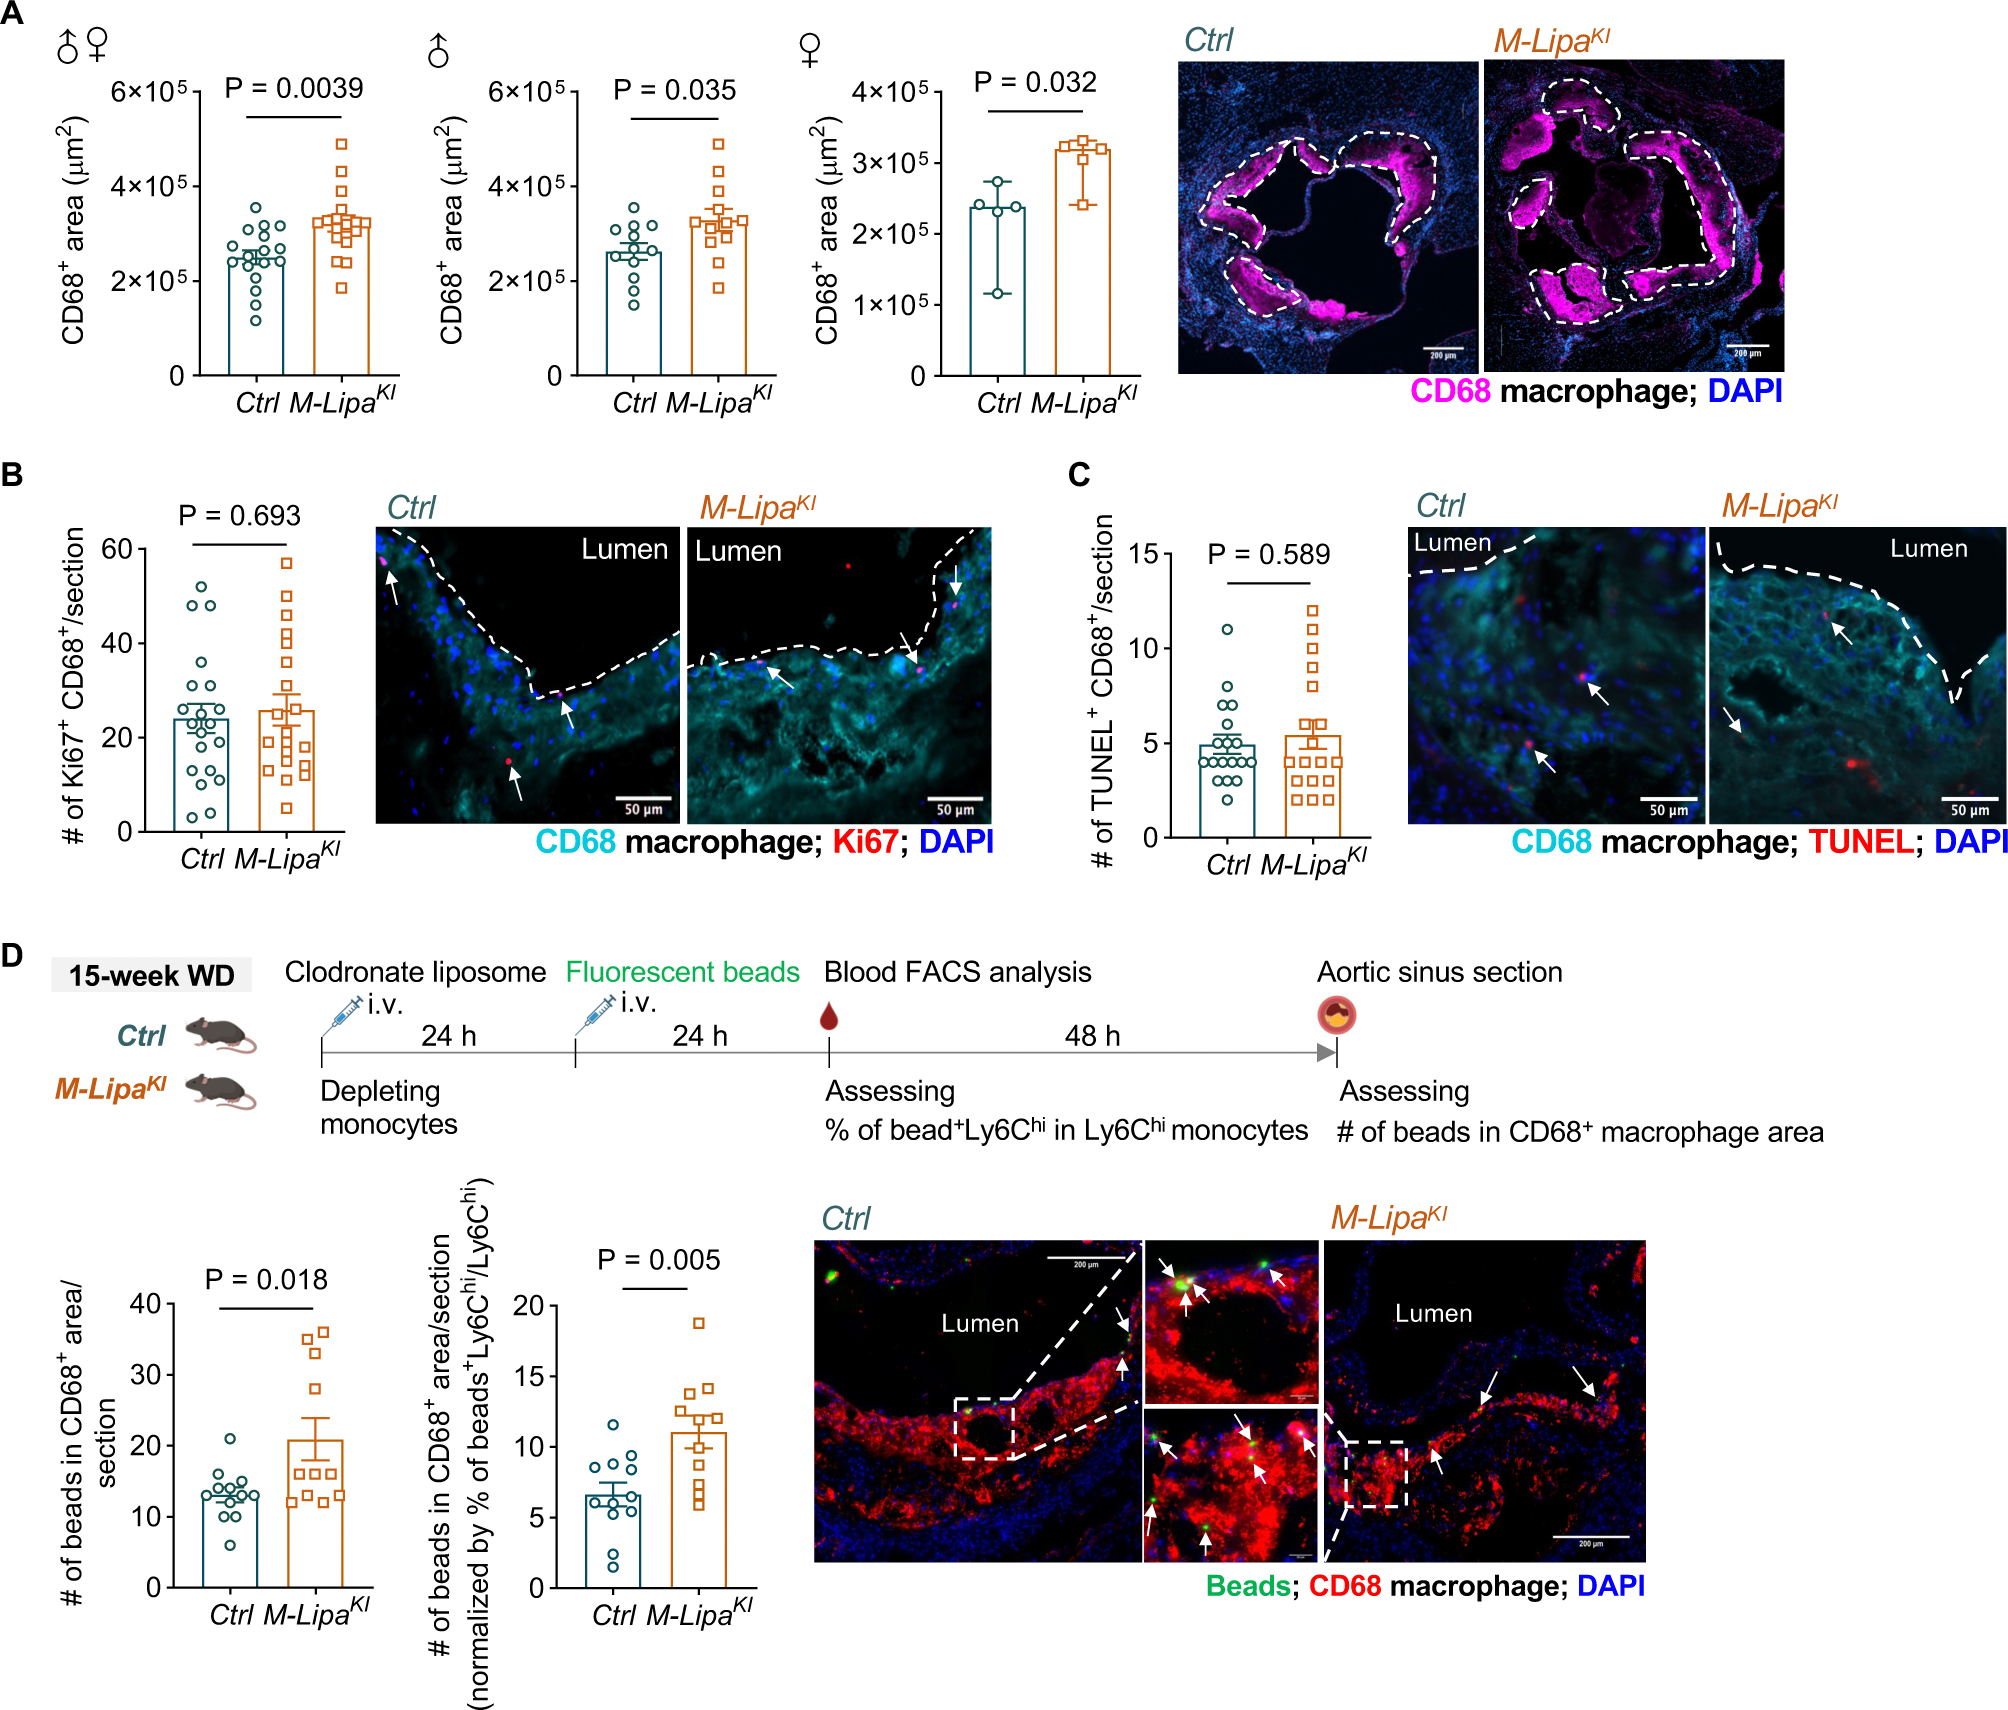
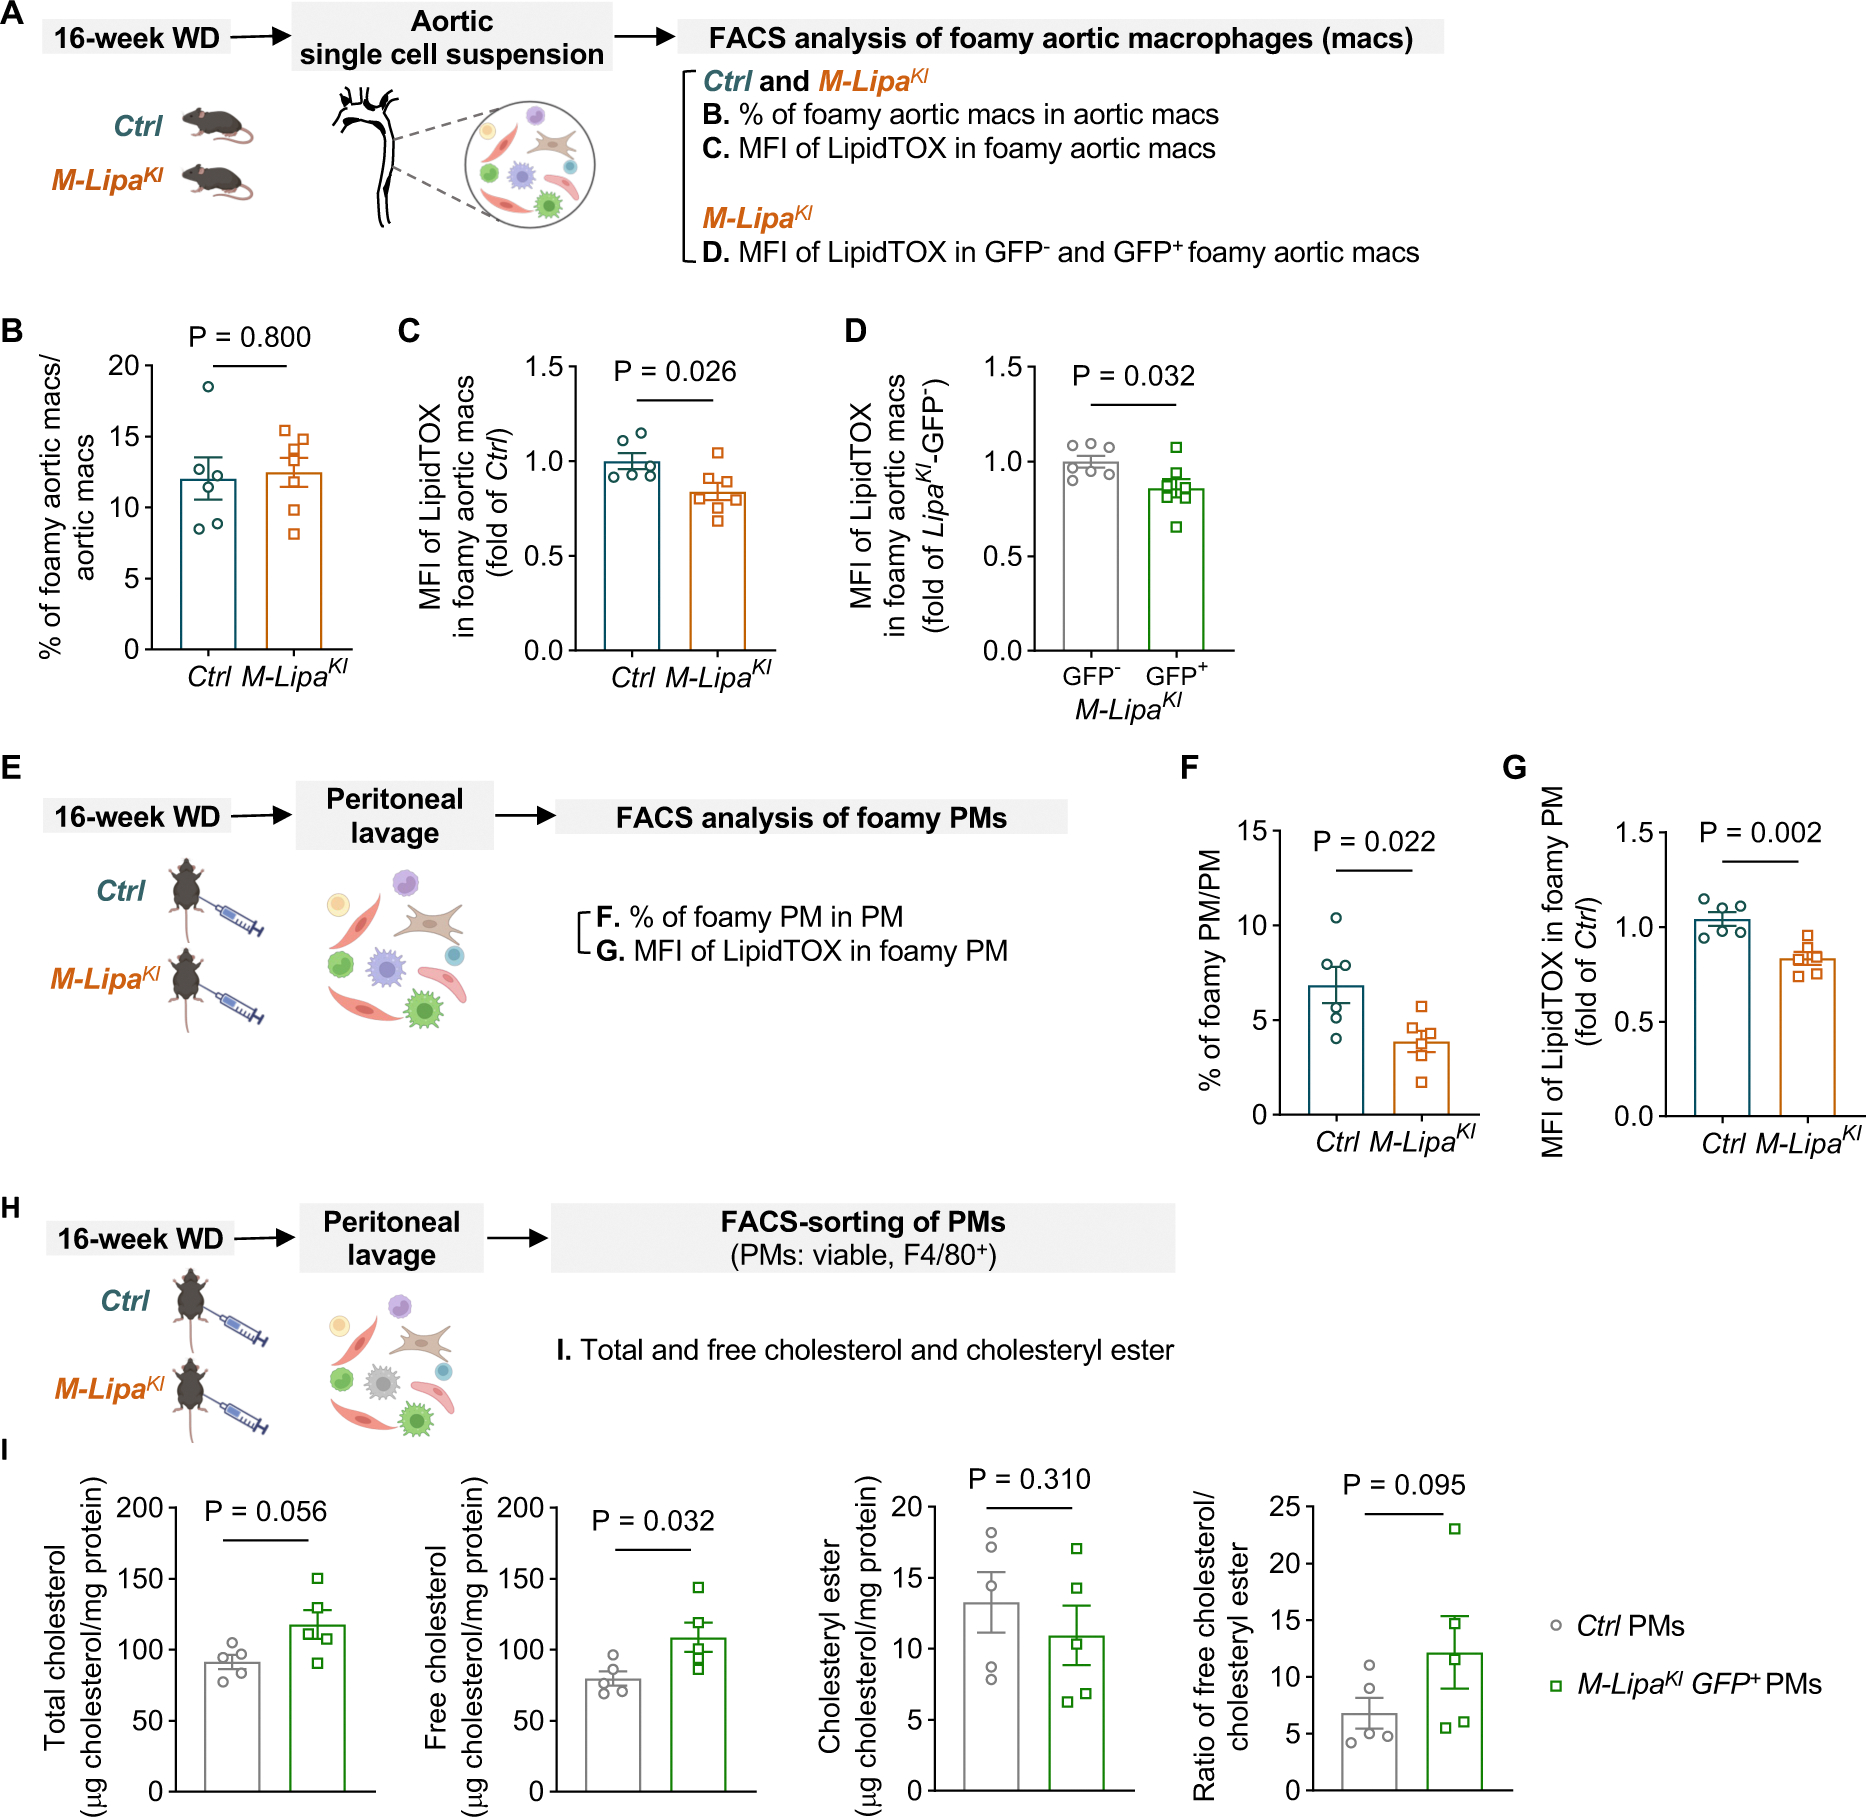
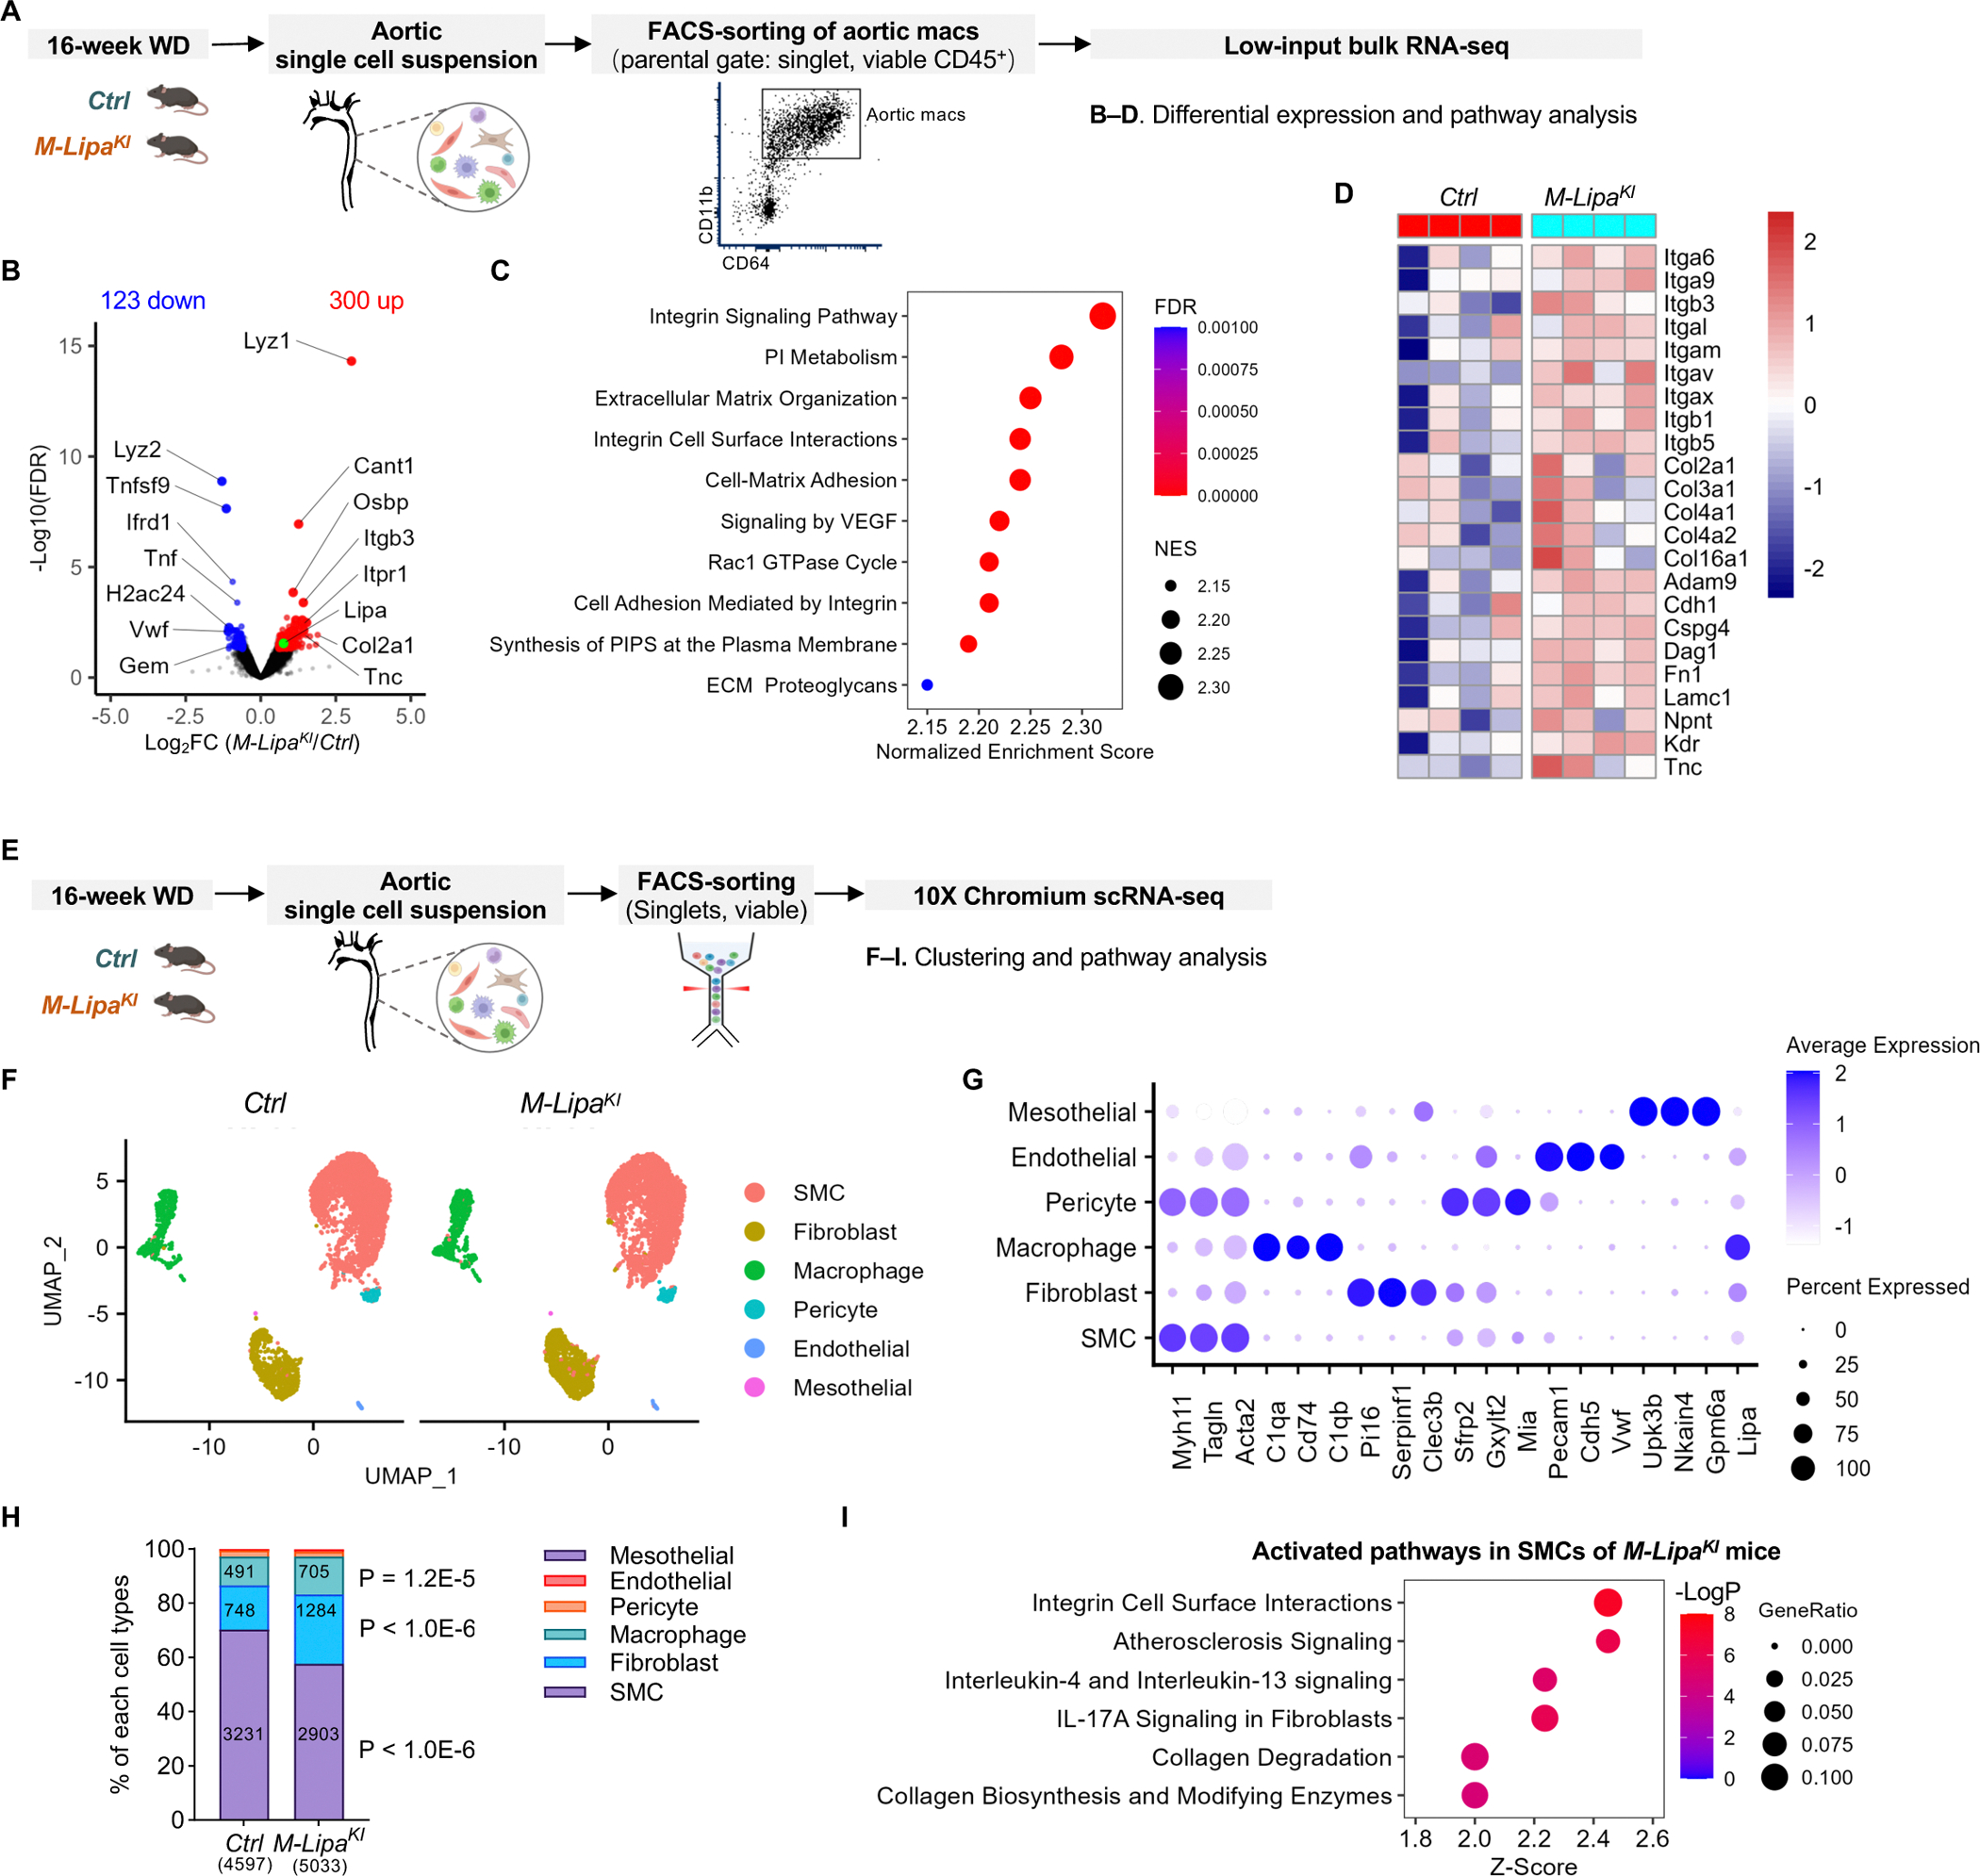
Results: Coronary artery disease-risk alleles in the LIPA locus increase LIPA expression and enzyme activity specifically in monocytes/macrophages by enhancing PU.1 binding to an intronic enhancer region that interacts with the LIPA promoter. Myeloid-specific Lipa overexpression in Ldlr-/- mice fed a western diet resulted in larger atherosclerotic lesions, accompanied by altered macrophage function, characterized by increased accumulation of lesional macrophages derived from circulating monocytes, reduced neutral lipid content, and up-regulation of integrin and extracellular matrix pathway genes.

Conclusions: The work establishes a direct causal link between LIPA-risk alleles and increased monocyte/macrophage LIPA that exacerbates atherosclerosis, bridging human functional genomic evidence to the mechanistic understanding of coronary artery disease.

Keywords: Atherosclerosis; Functional genomics; GWAS; Lysosomal acid lipase; Macrophage.


Conflict of interest statement

Declarations

Disclosure of Interest

T.L. advises and has equity in Variant Bio and advised Goldfinch Bio and GSK. Other authors declare no disclosure of interest for this contribution.

Figures

Figure 1
Figure 1
Genetic variants at the LIPA locus associated with higher risks of coronary artery disease are also linked to higher LIPA mRNA, enzyme activity, and protein in human peripheral blood monocyte–derived macrophages. (A) LocusZoom plot to visualize the CARDIoGRAMplusC4D coronary artery disease genome-wide association study signals at the LIPA locus. The genome-wide association study lead single nucleotide polymorphism rs1412444 and the single nucleotide polymorphisms in linkage disequilibrium are colour coded based on pairwise r2 with rs1412444. (B) LocusZoom plots to visualize LIPA expression quantitative trait loci in blood (upper) and aorta (lower) in the Genotype-Tissue Expression (GTEx) project. (C) LocusZoom plots of LIPA expression quantitative trait loci in the BLUEPRINT data set. Monocytes showed the strongest expression quantitative trait loci associations with coronary artery disease single nucleotide polymorphisms, whereas T cells showed no significant expression quantitative trait loci signals. Neutrophils exhibited expression quantitative trait loci signals but at a distinct genomic region. (B and C) Plots were generated using the FIVEx browser (https://fivex.sph.umich.edu/). The reference single nucleotide polymorphism is marked in purple, with other single nucleotide polymorphisms in the region colour coded by their linkage disequilibrium with the reference single nucleotide polymorphism according to pairwise r2. (DG) LocusZoom plots to visualize LIPA expression quantitative trait loci in atherosclerotic aortic wall (Aorta, D), blood (E), human peripheral blood monocyte–derived macrophage (F), and foamy human peripheral blood monocyte–derived macrophage (human peripheral blood monocyte–derived macrophage loaded with acetylated LDL, G) in the Stockholm–Tartu Atherosclerosis Reverse Network Engineering Task (STARNET) data set, which comprises nine cardiometabolic tissues/cell types from subjects with coronary artery disease. The most significant single nucleotide polymorphism is marked by diamond. Other single nucleotide polymorphisms in the region are colour coded by their linkage disequilibrium with the lead single nucleotide polymorphism according to pairwise r2 or plotted in grey colour when linkage disequilibrium information was not available based on the annotation used for STARNET data analysis. (H–J) The risk allele (T) of the coronary artery disease lead single nucleotide polymorphism rs1412444 is associated with increased LIPA mRNA (H), enzyme activity (I), and protein (J) in human peripheral blood monocyte–derived macrophages. n = the number of subjects. Data are presented as mean ± standard error of the mean in (H) and median ± 95% confidence interval in (I) and (J)
Figure 2
Figure 2
The non-coding genomic region containing rs1412444 is a myeloid-specific enhancer, interacting with the LIPA promoter and regulating LIPA expression. (A) Genome Browser view of annotation tracks for the LIPA locus showing significant coronary artery disease genome-wide association study single nucleotide polymorphisms, including the lead single nucleotide polymorphism (rs1412444) and single nucleotide polymorphisms in linkage disequilibrium as listed in Supplementary data online, Table S2, LIPA transcripts, and the regulatory landscape in human monocyte and human peripheral blood monocyte–derived macrophage. The potential enhancer regions showing H3K4me1 and H3K27ac modifications and hosting coronary artery disease genome-wide association study single nucleotide polymorphisms, including the rs1412444 region and the rs2246833 region, are highlighted and prioritized for subsequent functional validation. (B) The rs1412444 region, but not the rs2246833 region, shows enhancer activity by luciferase assay in THP-1 monocytes (left). Neither region shows enhancer activities in HEK 293 cells (right). (n = 3 independent experiments with 3 technical replicates; data are presented as median ± 95% confidence interval.) (C) High-resolution Tri-HiC depicts chromatin interaction between the rs1412444 region and the LIPA promoter in human CD14+ monocytes, but not CD3+ T cells. (D) CRISPRi targeting the rs1412444 enhancer region reduces LIPA expression. sgRNAs targeting the rs1412444 region were designed and transduced to dCas9-KRAB-expressing THP-1 cells for CRISPRi-mediated silencing, and mRNA expression of LIPA was determined by reverse transcription quantitative polymerase chain reaction. The sgRNA1 is 68 bp upstream of rs1412445 and is the highest scored sgRNA within the region by CRISPick. The sgRNA2 spans rs1320496. The sgRNA3 spans rs1412445. The rs1412444 single nucleotide polymorphism region lacks a PAM sequence for sgRNA design. The sgRNA targeting the transcription start site of LIPA (LIPA-TSS) serves as the positive control. (n = 6 replicates; data are presented as mean ± standard error of the mean.)
Figure 3
Figure 3
rs1320496 and rs1412444 represent the functional single nucleotide polymorphisms at the LIPA locus, with risk alleles enhancing PU.1 binding and regulating LIPA expression. (A) Site-directed mutagenesis and luciferase assay confirmed that the risk haplotypes TTT (rs1412445-T, rs1320496-T, and rs1412444-T) and CTC (rs1412445-C, rs1320496-T, and rs1412444-C) lead to increased enhancer activities compared with the non-risk haplotype CCC (rs1412445-C, rs1320496-C, and rs1412444-C). (n =5 independent experiments with 3 technical replicates; data are presented as median ± 95% confidence interval.) (B) Conditional analysis was performed to assess the independent contribution of single nucleotide polymorphisms (rs1412445, rs1320496, and rs1412444) within the rs1412444-containing enhancer to expression quantitative trait loci and genome-wide association study signals. The perfect linkage disequilibrium between rs1412444 and rs1412445 (r2 = .99) allows for the utilization of rs1412445 as a representative to capture the effects of both variants. The high linkage disequilibrium (r2 = .45) between rs1320496 and the other two variants prohibited full disentanglement. Both rs1412445 and rs1320496 show independent association with LIPA expression (left, in blood, P < 10−59) and coronary artery disease risk (right, P < 10−11). After conditioning on rs1412445 (removing the shared linkage disequilibrium effects), rs1320496 remains showing nominally significant effects on both LIPA expression (left, in blood, P = 3 × 10⁻¹⁰) and coronary artery disease risk (right, P = .031; green, rs1320496 conditional), suggesting that both single nucleotide polymorphisms independently contribute to the traits. In the context of expression quantitative trait loci analysis, the effect size is quantified as the log2 allelic fold change in LIPA gene expression, while in genome-wide association study, it represents the log odds change in coronary artery disease risks. (C) Allele-specific binding analysis of PU.1 ChIP-seq data in human peripheral blood monocyte–derived macrophage (GSM785501, n = 1 experiment) and LCL cell line (EBV-transformed lymphoblastoid B-cell lines; ENCODE data set, n = 2 independent experiments). Results suggest that PU.1 binds more favourably to the risk alleles (T). (D) Motif analysis shows that the risk allele (T, red) of rs1320496 creates a PU.1-binding site. (E) Electrophoretic mobility gel shift assay was conducted to determine the effects of different alleles on PU.1 binding for sequences containing single nucleotide polymorphism rs1320496 (left) and rs1412444 (right), using recombinant human PU.1 protein and anti-PU.1 antibody. Data shown are representative images from n = 2 independent experiments. (F) siRNA-mediated knockdown of SPI1 (encoding PU.1) in THP-1 cells reduces mRNA expression of LIPA. (n = 3 independent experiments with 2 technical replicates; data are presented as median ± 95% confidence interval.) (G) Knockdown of SPI1 partly abolished the effects of risk alleles on increasing the enhancer activity of the rs1412444 region. Data were analysed by two-way analysis of variance followed by Tukey’s multiple comparisons test. (n = 3 independent experiments with 3 technical replicates; data are presented as median ± 95% confidence interval.) (H) Schematic figure summarizing the results of functional genomic studies that the risk alleles of the functional variants at LIPA-risk locus increase the expression of LIPA by enhancing PU.1 binding in monocytes/macrophages and via enhancer-promoter interaction
Figure 4
Figure 4
Myeloid overexpression of Lipa exacerbates atherosclerosis in Ldlr−/− mice. (A) The plasmid construction and breeding strategy of the mouse model. Mice for conditional overexpression of Lipa (NM_001111100) were generated by Rosa26 knock-in (KI) of CAG-loxP-STOP-loxP-Lipa-IRES-eGFP. To achieve myeloid-specific overexpression, LipaKI/KI mice were bred with LysMCre+/− mice (heterozygous for the Cre allele) to delete the loxP-STOP-loxP cassette, thereby enabling overexpression of Lipa in myeloid cells in LysMCre+/−, LipaKI/WT mice. Littermates with the genotype LysMCre−/−, LipaKI/WT without overexpression serve as controls. To assess the impact of myeloid-specific overexpression of Lipa on atherosclerosis, these mice were bred onto an Ldlr−/− background. To induce atherosclerosis, Ctrl (LysMCre−/−, LipaKI/WT, Ldlr−/−) and M-LipaKI (LysMCre+/−, LipaKI/WT, Ldlr−/−) mice were fed a western diet for 16 weeks. The atherosclerotic lesion size and features of plaque stability in the aortic sinus were quantified. (B) Myeloid overexpression of Lipa modestly but significantly increased atherosclerotic lesion size in mice of both sexes (left: combined, n = 23 mice), as well as in male mice (middle: n = 11) and female mice (right: n = 12) when analysed separately. Data are presented as median ± 95% confidence interval. Scale bar = 200 μm. (C) Atherosclerotic lesion size is positively correlated with LIPA enzyme activity measured in peritoneal macrophages [two-tailed Pearson’s correlation analysis, P = .014, r = .4499, with a 95% confidence interval (.1000–.7008)]. (D) No differences in the necrotic core area between the two genotypes in both sexes (left: combined, n = 23 mice), as well as in male mice (middle: n = 11) and female mice (right: n = 12) when analysed separately. (E and F) Picrosirius red staining shows comparable collagen area (E, left), percentage of the collage area (E, right), and fibrous cap thickness (F) between two genotypes (n = 8 female and 2 male mice). (G) Immunofluorescence staining data suggested comparable COL1A1+ area (left) and percentage (right) in the lesion (n = 8 female and 2 male mice). Data are presented as mean ± standard error of the mean. Scale bar = 200 μm for (D), (E), and (G)
Figure 5
Figure 5
Myeloid overexpression of Lipa increases macrophage content in the atherosclerotic lesions, partly due to enhanced monocyte recruitment rather than changes in macrophage proliferation or death within plaques. (A) Immunofluorescence staining data suggest that myeloid overexpression of Lipa significantly increased the CD68+ macrophage area in the lesion in mice of both sexes (left: combined, n = 17 mice), as well as in male mice (middle: n = 12) and female mice (right: n = 5). Data are presented as median ± 95% confidence interval. The white dashed contour indicates the lesion area. Scale bar = 200 μm. (B and C) Immunofluorescence staining and quantification for the proliferative macrophages [B, Ki67 (red), CD68+ (cyan), and DAPI (blue)] and apoptotic macrophages [C, TUNEL (red), CD68+ (cyan), and DAPI (blue)]. (B, n = 13 male mice and 7 female mice; C, n = 10 male mice and 8 female mice). Data are presented as mean ± standard error of the mean. Scale bars = 50 μm. (D) Plaque macrophages derived from circulating monocytes were assessed by bead assay. Briefly, Ly6Chi monocytes in the blood were pulse labelled with fluorescent beads by transiently depleting circulating monocytes with clodronate liposome injection. Bead labelling efficiency was assessed by fluorescence-activated cell sorting (FACS) as the percentage of bead+Ly6Chi monocytes in Ly6Chi monocytes 24 h after beads injection. The number of beads in the CD68+ area of atherosclerotic lesion was quantified in mice 3 days post injection. Results are presented as the number of beads in the CD68+ area per section (left), the number of beads in the CD68+ area per section normalized by the percentage of bead+ monocytes in Ly6Chi monocytes (middle), and representative immunofluorescence staining showing beads+ (green) CD68+ macrophages (red) in the lesion (right). For Ctrl, n = 4 male mice and 8 female mice; for M-LipaKI, n = 3 male mice and 8 female mice; the average of two sections per mouse was reported. Data are presented as mean ± standard error of the mean. Scale bars = 200 μm
Figure 6
Figure 6
Myeloid overexpression of Lipa leads to reduced neutral lipid but increased free cholesterol accumulation in macrophages. (A) Schematics of a FACS-based method to characterize aortic macrophages (CD45+CD11b+CD64+) that are neutral lipid enriched and foamy (SSChiLipidTOXhi) in aortas dissected from Ctrl and M-LipaKI mice fed a western diet for 16 weeks. (B) Percentage of foamy aortic macrophages in total aortic macrophages in Ctrl and M-LipaKI mice. (C) Mean fluorescent intensity of LipidTOX in foamy aortic macrophages in Ctrl and M-LipaKI mice. (D) Mean fluorescent intensity of LipidTOX in GFP and GFP+ foamy aortic macrophages in M-LipaKI mice. (BD) n = 6 male mice for Ctrl; n = 7 male mice for M-LipaKI. Data are presented as mean ± standard error of the mean. (E) Schematics of study design to characterize foamy (SSChiLipidTOXhi) peritoneal macrophages (CD45+F4/80+) in Ctrl and M-LipaKI mice fed a western diet for 16 weeks. (F) Percentage of foamy peritoneal macrophages in peritoneal macrophages of Ctrl and M-LipaKI mice. (G) Mean fluorescent intensity of LipidTOX in foamy peritoneal macrophages in Ctrl and M-LipaKI mice. (F–G) n = 6 male mice. Data are presented as mean ± standard error of the mean. (H) F4/80+ peritoneal macrophages from Ctrl mice and F4/80+GFP+ peritoneal macrophages from M-LipaKI mice that fed a western diet for 16 weeks were sorted for quantification of cellular cholesterol levels in (I). (I) Quantification of total cholesterol (left), free cholesterol (second left), cholesteryl ester (second right), and ratio of free cholesterol/cholesteryl ester (right). (n = 5 female mice, with analysis based on the averages of two technical replicates. Data are presented as median ± 95% confidence interval.)
Figure 7
Figure 7
Bulk and single-cell RNA-seq analyses reveal the effects of myeloid overexpression of Lipa on aortic macrophages transcriptomic signature and plaque cell heterogeneity. (A) Viable macrophages (CD45+CD11b+CD64+) were sorted from aortas of Ctrl and M-LipaKI mice fed a western diet for 16 weeks and subjected to low-input RNA-seq. n = 4 biological replicates per genotype, with each replicate comprising pooled samples from 2–3 male mice, resulting a total of 10 male mice per genotype. (B) Volcano plot to visualize the top differentially expressed genes (aortic macrophages isolated from M-LipaKI mice vs those from Ctrl mice, all fed a western diet for 16 weeks). (C) The top enriched pathways in the up-regulated genes in aortic macrophages of M-LipaKI mice as determined by gene set enrichment analysis. (D) Heat map visualization of top differentially expressed genes and the leading-edge subsets of the associated integrin signalling and cell-matrix-mediated adhesion pathways. (E) Viable cells isolated from aortas of Ctrl and M-LipaKI mice fed a western diet for 16 weeks were subjected to scRNA-seq. Cells were obtained from a pooled sample of n = 3 male mice. (F) Uniform manifold approximation and projection (UMAP) visualization of six cell types identified from the analyses. (G) Dot plot visualization of top marker genes of each cell type and Lipa in different cell types. (H) Stacked bar plot shows the proportion and numbers of each cell type in Ctrl (left) and M-LipaKI (right) aortic cells. M-LipaKI mice show increased macrophages and fibroblasts, while decreased smooth muscle cells. Data were analysed by χ2 test with Bonferroni correction. (I) Top activated canonical pathways by ingenuity pathway analysis in smooth muscle cells

References

    1. McPherson R, Tybjaerg-Hansen A. Genetics of coronary artery disease. Circ Res 2016;118:564–78. 10.1161/CIRCRESAHA.115.306566 - DOI - PubMed
    1. Chen Z, Schunkert H. Genetics of coronary artery disease in the post-GWAS era. J Intern Med 2021;290:980–92. 10.1111/joim.13362 - DOI - PubMed
    1. Koyama S, Ito K, Terao C, Akiyama M, Horikoshi M, Momozawa Y, et al. Population-specific and trans-ancestry genome-wide analyses identify distinct and shared genetic risk loci for coronary artery disease. Nat Genet 2020;52:1169–77. 10.1038/s41588-020-0705-3 - DOI - PubMed
    1. Tcheandjieu C, Zhu X, Hilliard AT, Clarke SL, Napolioni V, Ma S, et al. Large-scale genome-wide association study of coronary artery disease in genetically diverse populations. Nat Med 2022;28:1679–92. 10.1038/s41591-022-01891-3 - DOI - PMC - PubMed
    1. Aragam KG, Jiang T, Goel A, Kanoni S, Wolford BN, Atri DS, et al. Discovery and systematic characterization of risk variants and genes for coronary artery disease in over a million participants. Nat Genet 2022;54:1803–15. 10.1038/s41588-022-01233-6 - DOI - PMC - PubMed