. 2025 Aug;55(8):e70039.
doi: 10.1002/eji.70039.

TLR9-Driven S-Palmitoylation in Dendritic Cells Reveals Immune and Metabolic Protein Targets

Affiliations

TLR9-Driven S-Palmitoylation in Dendritic Cells Reveals Immune and Metabolic Protein Targets

Juan N Quiroz et al. Eur J Immunol. 2025 Aug.

Abstract

Dendritic cells (DCs) rely on Toll-like receptor 9 (TLR9) to detect unmethylated CpG motifs in microbial DNA, triggering essential immune responses. While the downstream signaling pathways of TLR9 activation are well characterized, their impact on S-palmitoylation is unknown. S-palmitoylation, involving the reversible attachment of palmitic acid to cysteine residues, plays a crucial role in regulating protein function and is catalyzed by the ZDHHC family of palmitoyl-acyltransferases (PATs). In this study, we investigated the S-palmitoylated proteome of bone marrow-derived GM-CSF DCs (GM-DCs) at resting and following TLR9 activation with CpGB. Using the click-chemistry-compatible analog 17-octadecynoic acid (17-ODYA) and mass spectrometry (MS)-based proteomics, we characterized dynamic remodeling of S-palmitoylation in response to TLR9 activation. This included enrichment of targets involved in immune and metabolic pathways. Transcriptomic analysis of mice and human DCs revealed TLR9-driven modulation of PAT-encoding genes. Subsequently, we explored the contribution of Zdhhc9 expression to the regulation of S-palmitoylation in DCs. Using gene knockout approaches, we identified candidate protein targets potentially linked to ZDHHC9 activity. Interestingly, modulation of Zdhhc9 expression alone did not influence DC maturation, suggesting that other PATs might compensate for its activity. Together, our findings reveal a novel layer of regulation in TLR9 signaling mediated by S-palmitoylation.

Keywords: S‐palmitoylation; TLR9 signaling; dendritic cells; innate immunity.


Conflict of interest statement

The authors declare no conflicts of interest.

Figures
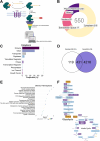
FIGURE 1
FIGURE 1
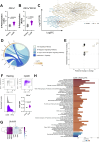
Palmitoyl‐proteome of homeostatic GM‐DCs. Resting bulk GM‐CSF cultures were generated from the bone marrow of C57BL/6 mice. Cells were then incubated with 17‐ODYA or vehicle (DMSO) for 4 h, followed by protein extraction and processing for click chemistry‐based enrichment of S‐palmitoylated proteins and MS identification. (A) Schematic overview of the MS–based workflow used to identify S‐palmitoylated proteins in GM‐DCs, incorporating metabolic labeling with 17‐ODYA and click chemistry–based enrichment strategies. (B) Donut chart showing the number of lipid‐modified proteins grouped by subcellular localization, as annotated by IPA. (C) Proportion of cytoplasmic proteins separated by their functional annotation. (D) Venn diagram comparing the S‐palmitoylated proteins identified in this study with curated entries from the SwissPalm database. (E) Pathway enrichment analysis of the identified S‐palmitoylated proteins (17‐ODYA/DMSO), displaying the top 20 overrepresented pathways. Each category displays the number of associated protein‐coding genes, and their statistical significance represented as −log (p‐value). (F) Diagram of glycolysis and the Krebs cycle reactions highlighting enzymes identified as S‐palmitoylated targets in this study (indicated in purple). Three independent samples (n = 3) were evaluated in a single experiment, including three technical replicates. The dataset generated after raw data processing (see Methods) was subjected to downstream analysis based on proteins meeting the following criteria: |log2FC| > 1 and FDR < 0.01.
FIGURE 2
FIGURE 2
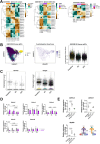
TLR9 activation prompts S‐palmitoylated proteome remodeling. Bulk GM‐CSF‐derived cultures were stimulated with 1 µM CpGB for 4 h or left unstimulated (resting) in the presence of 17‐ODYA, and subject to S‐palmitoylated proteome analysis using click‐MS. In parallel, resting and CpGB–activated cultures were processed for whole proteome profiling via MS. Relative S‐palmitoylation levels in (A) total CD11c⁺ cells and (B) DC‐like populations from CpGB‐stimulated GM‐DC cultures, compared with resting. (C) Volcano plot showing S‐palmitoylated proteins in CpGB‐stimulated GM‐DCs compared with resting controls. Proteins that met the statistical threshold are labeled based on their coding genes. (D) Chord diagram illustrating enriched biological pathways at the whole‐proteome level in GM‐DCs following TLR9 activation, compared with the resting condition (CpGB/resting). Protein‐coding genes arranged by log2FC are linked with their signaling pathways. (E) Scatter plot showing the relationship between whole‐proteome protein abundance changes and S‐palmitoylation enrichment in CpGB‐stimulated GM‐DCs. Each point represents a protein, with the x‐axis indicating log2FC in total protein abundance (CpGB/resting) and the y‐axis indicating log2FC change in S‐palmitoylation (17‐ODYA CpGB/resting). Proteins displaying a simultaneous increase in protein abundance and S‐palmitoylation are labeled. Dash line indicated threshold of |log2FC|>2. (F, G) Evaluation of activation markers and cytokine secretion in resting and TLR9‐stimulated GM‐Ds. CD86 expression was assessed in CD11c⁺ cells by FACS. Cytokine levels were measured and displayed as a heatmap using scaled ΔOD450‐570 values. (H) Pathway enrichment analysis performed on S‐palmitoylated proteins that were differentially abundant between CpGB–stimulated and resting GM‐DC cultures. For the S‐palmitoylated proteome analysis, three independent biological replicates (n = 3) were evaluated in a single run, each analyzed in technical triplicate. Regarding the whole proteome, all samples (n = 4) were processed in technical duplicates. The dataset generated after raw data processing (see Methods) was subjected to downstream analysis based on proteins meeting the following criteria: |log2FC| > 1 and FDR < 0.01. Experiments involving DC maturation included 3–4 biological replicates, assessed in three independent runs. Data are presented as mean ± SD. Unpaired parametric t‐tests were used to compare resting and CpGB–stimulated DCs. Statistically significant differences were defined as p‐value < 0.05 and are indicated accordingly.
FIGURE 3
FIGURE 3
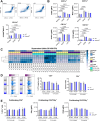
The expression of PAT‐encoding genes is differentially regulated during DC responses. Exploratory analysis of Zdhhc gene expression in mouse and human DC datasets, along with mRNA expression dynamics in resting and TLR‐stimulated GM‐DC cultures. (A) Heatmaps displaying DESeq2‐normalized and scaled transcript counts from two independent datasets: splenic (GSE188992 and GSE106715) and bone marrow–derived DCs (GSE153392). (B) UMAP plots generated from a single‐cell RNA‐seq dataset of human peripheral blood pDCs (GSE189120) stimulated in vitro with the influenza virus for 6 or 24 h. S‐palmitoylation gene score was calculated as detailed in Methods. (C) Violin plots showing the expression of Zdhhc9 and Golga7 at single‐cell resolution from human pDCs. (D) RT‐qPCR analysis of Zdhhc2, Zdhhc3, Zdhhc6, Zdhhc9, and Zdhhc20 mRNA expression in resting and 1 µM CpGB‐stimulated GM‐DCs at 4, 6, and 18 h. Expression levels are shown relative to resting control and standardized to the housekeeping gene. (E) Gene expression levels of Zdhhc2, Zdhhc9, and Myd88 in GM‐DC cultures upon 4 h stimulation with 100 ng/mL LPS or 50 µg/mL Poly(I:C). Representative data from three independent experiments, including biological replicates (n = 3–4). Data are presented as mean ± SD. One‐way or two‐way ANOVA was used to assess the effects of cell activation or stimulation duration, as appropriate. Benjamini–Hochberg post hoc analysis was applied to determine differences between groups, and q‐values below 0.05 were considered statistically significant and are reported accordingly.
FIGURE 4
FIGURE 4
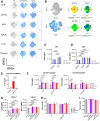
Zdhhc9‐deficiency compromises the S‐palmitoylation of several targets during TLR9 activation. Bulk GM‐CSF‐derived cultures isolated from Zdhhc9 KO or WT mice were stimulated with 1 µM CpGB for 4 h or left unstimulated (resting) in the presence of 17‐ODYA or DMSO. Proteins were then extracted and subjected to S‐palmitoylated proteome profiling using Click‐MS. In parallel, whole proteome analysis was performed on resting and CpGB–stimulated GM‐DCs and compared between genotypes. (A) Volcano plot depicting the whole proteome between CpGB versus resting GM‐DCs from Zdhhc9 KO mice. Proteins exceeding the log2FC and FDR thresholds are labeled (|log2FC| > 1 and FDR < 0.01). (B) Basal S‐palmitoylation levels of ZDHHC9‐related substrates across WT and Zdhhc9 KO GM‐DCs. (C) Four‐way plot highlighting the S‐palmitoylated proteins found to be differentially abundant in CpGB‐activated GM‐DCs (log2FC > 5) contrasted by genotypes. Proteins are labeled based on their coding genes when significant differences between Zdhhc9 KO and WT were found (CpGB KO/WT). The targets displayed in the center right and lower right panels were identified as substrates affected by Zdhhc9 deficiency. (D) Biological process related to affected protein targets in Zdhhc9 KO GM‐DCs. For the S‐palmitoylated proteome analysis, three independent biological replicates (WT: n = 3; Zdhhc9 KO: n = 3) were evaluated in a single run, each analyzed in technical triplicates. Regarding whole proteome, all samples (WT: n = 4; Zdhhc9 KO: n = 3) were processed in technical duplicates. The dataset generated after raw data processing (see Methods) was subjected to downstream analysis based on proteins meeting the following criteria: |log2FC| > 1 and FDR < 0.01.
FIGURE 5
FIGURE 5
Zdhhc9 deficiency does not impact the functional properties of DCs. DC cultures generated from Zdhhc9 KO or WT mice were stimulated with 1 µM CpGB or 100 ng/mL LPS for 4 h, or left unstimulated (resting). Markers of DC maturation and T cell priming capacity were evaluated and compared between genotypes. (A) TLR‐driven maturation of GM‐DCs evaluated as frequency (%) of CD86hiMHC‐II+ cells gate in CD11c+. Representative dot plots for each condition are displayed. (B) Bar plots depicting gMFI for co‐stimulatory (CD86 and CD40) and activation markers (MHC‐II and ICAM‐1) within resting CD11c+ GM‐DCs. (C) Heatmap displaying scaled ΔOD450‐570 values for IL‐12p70, IL‐10, IL‐6, and TNFα, from culture supernatant. Cytokine levels were measured in resting and 4 h CpGB–stimulated GM‐DC, FLT3L‐DC, and CD103⁺ DC cultures, and compared between genotypes. (D) Proliferation of OTI‐II CD4+ T cells following a 4‐day co‐culture with Flt3L‐DCs previously loaded with varying concentrations of OVA‐FL or OVA peptide in the presence of 1 µM CpGB. Proliferation was assessed by CTV staining on CD4+ T cells, as shown in the histograms. The % of CTV‐negative cells and division index within CD4+ were calculated in FlowJo. (E) The % of IFN‐γ+ cells and protein expression levels for IFN‐γ and CD69 evaluated in proliferating CD4+ T cells (CTV negative). Results include biological replicates (WT: n = 3; Zdhhc9 KO: n = 3) and are representative of three independent experiments. Data are presented as mean ± SD. Statistical analysis was performed using two‐way ANOVA followed by multiple comparisons with FDR correction (significance threshold: q‐value < 0.05). Only statistically significant differences are shown and reported as q‐values in the figure.
FIGURE 6
FIGURE 6
General inhibition of PATs with 2‐BP or specific depletion of Zdhhc9 does not affect DC differentiation or their responsiveness to TLR stimulation. Phenotypic and functional characterization of tissue DC subsets derived from Zdhhc9 KO or WT mice, and evaluation of in vitro DC maturation following global S‐palmitoylation inhibition with 2‐BP. (A) t‐SNE plots were generated from FACS data to visualize the genotype‐dependent phenotypic differences of cDCs and pDCs derived from the SPLN and pLNs, as well as CD11c⁺ cells isolated from the liver and Thy. The compensate parameters considered for dimensionality reduction were selected as follows: cDCs (CD11c, CD11b, XCR1, CD103 and, CD8a), pDCs (CD11c, CD11b, CD9, Sca‐1, Ly6D, PDCA‐1, CCR9), liver CD11c+ (CD11c, CD11b, SIGLECH, PDCA‐1, MHC‐II, CD103), and Thy‐derived CD11c+ (CD11c, B220, CD8a, PDCA‐1, CD103, and SIRP‐1a). More details about data processing are provided in Methods. (B) tSNE plot with expression levels for CD11c, XCR1, CD103 and CD8a within cDC subsets. (C, D) CD86 expression on cDC (CD11c+B220MHC‐IIhi) and pDC (CD11c+B220+PDCA‐1+) derived from ex vivo splenocyte cultures stimulated with TLR agonists (1 µM CpGB, 100 ng/ml LPS, or 3 µM R848). (E) BMMs were preincubated with 100 µM 2‐BP for 2 h and later stimulated with 100 ng/mL LPS for 4 h. The secretion of IL‐1β was induced with 1 mM ATP for 45 min and measured in the culture supernatant by ELISA. Undetectable cytokine levels are indicated as n.d. (not detected). (F) CD103+DC cultures generated from WT and Zdhhc9 KO mice were pretreated with 100 µM 2‐BP for 2 h before stimulation with 1 µM CpGB or 100 ng/mL LPS for 6 h. The expression of CD86 and MHC‐II was inspected by FACS within CD103hiCLEC9A+ cells. (G) GM‐DC cultures exposed to 100 µM 2‐BP or vehicle for 2 h and later activated for 4 h with 1 µM CpGB or 100 ng/mL LPS. The expression of activation markers (CD86 and MHC‐II) was evaluated within CD11c+ cells by FACS. (H, I) Cell viability evaluated as % of LIVE DEAD AQUA negative cells by FACS. Data are supported by two independent experiments, including biological replicates (WT: n = 3–4; Zdhhc9 KO: n = 3). Data are presented as mean ± SD. One‐way or two‐way ANOVA with multiple testing correction was applied as appropriate. Significant q‐values are reported considering a threshold of FDR < 0.05.

References

    1. Kumagai Y., Takeuchi O., and Akira S., “TLR9 as a Key Receptor for the Recognition of DNA,” Advanced Drug Delivery Reviews 60, no. 7 (2008): 795–804, 10.1016/j.addr.2007.12.004. - DOI - PubMed
    1. Chen K., Huang J., Gong W., Iribarren P., Dunlop N. M., and Wang J. M., “Toll‐Like Receptors in Inflammation, Infection and Cancer,” International Immunopharmacology 7, no. 10 (2007): 1271–1285, 10.1016/j.intimp.2007.05.016. - DOI - PubMed
    1. Lind N. A., Rael V. E., Pestal K., Liu B., and Barton G. M., “Regulation of the Nucleic Acid‐Sensing Toll‐Like Receptors,” Nature Reviews Immunology 22, no. 4 (2021): 224–235, 10.1038/s41577-021-00577-0. - DOI - PMC - PubMed
    1. Musumeci A., Lutz K., Winheim E., and Krug A. B., “What Makes a pDC: Recent Advances in Understanding Plasmacytoid DC Development and Heterogeneity,” Frontiers in Immunology 10 (2019), 10.3389/fimmu.2019.01222. - DOI - PMC - PubMed
    1. Hoshino K., Sasaki I., Sugiyama T., et al., “Cutting Edge: Critical Role of IκB Kinase α in TLR7/9‐Induced Type I IFN Production by Conventional Dendritic Cells,” The Journal Of Immunology 184, no. 7 (2010): 3341–3345, 10.4049/jimmunol.0901648. - DOI - PubMed

LinkOut - more resources