

Relationship Between Diurnal Variations of Episcleral Venous Pressure and Intraocular Pressure
- PMID: 40828522
- PMCID: PMC12369919
- DOI: 10.1167/iovs.66.11.44
Relationship Between Diurnal Variations of Episcleral Venous Pressure and Intraocular Pressure
Abstract
Purpose: To investigate the diurnal variations of episcleral venous pressure (EVP) and its relationships with IOP, blood pressure, and heart rate in healthy and systemic hypertension subjects.
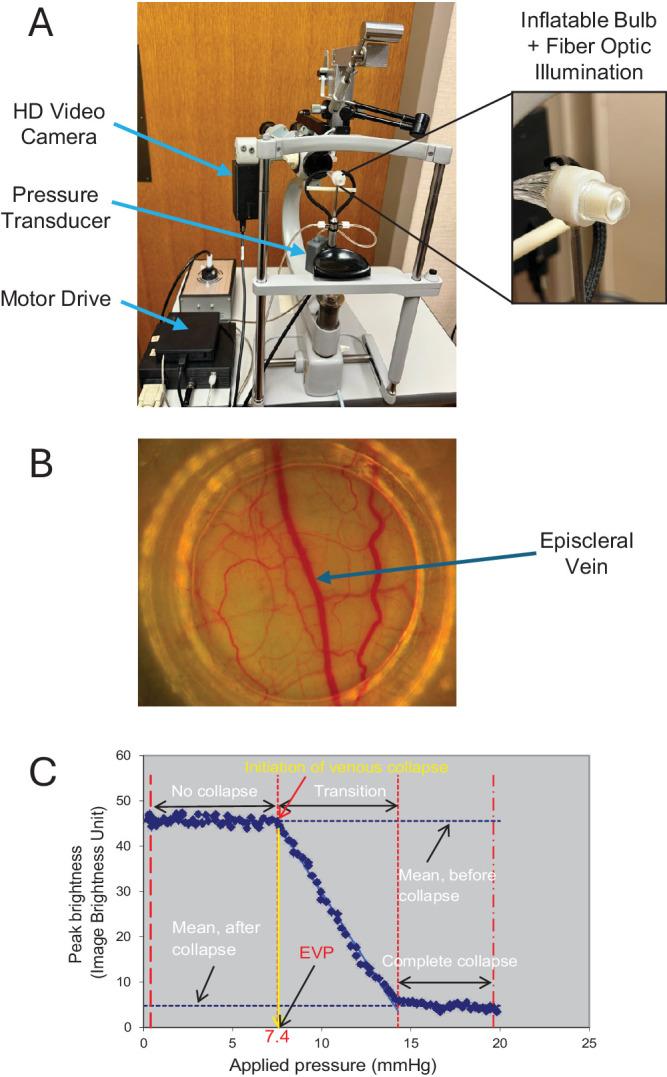
Methods: Twenty healthy adults and eight patients taking systemic antihypertensive medications were enrolled. IOP and EVP of both eyes, systolic and diastolic blood pressure (SBP and DBP), and heart rate (HR), were measured at five time points, every two hours from 8 AM to 4 PM. IOP was measured by pneumatonometry, and EVP was assessed using a computer-controlled episcleral venomanometer with video recording and image processing. Changes in measurements at each time point were compared with baseline (8 AM) by using generalized estimating equation models. Correlations between EVP and other variables were determined using linear regression analysis.
Results: EVP and IOP were highest in the early morning (8 AM) and lowest in the late afternoon (4 PM), with statistically significant changes (P < 0.05) across all time points compared to baseline in normotensive subjects. Changes in EVP and IOP were correlated at all time points. In treated systemic hypertensive subjects, similar trends were observed, with significant IOP and EVP correlations at multiple time points. No clear pattern of correlation was noted between EVP, SBP, DBP, and HR in all subjects.
Conclusions: IOP and EVP follow a diurnal rhythm with the highest values in the early morning, which gradually decrease throughout the day. The relationship between IOP and EVP suggests that reduction of EVP can be an important target for clinical regulation and stability of IOP.
Conflict of interest statement
Disclosure:
Figures


Similar articles
-
Perioperative medications for preventing temporarily increased intraocular pressure after laser trabeculoplasty.Cochrane Database Syst Rev. 2017 Feb 23;2(2):CD010746. doi: 10.1002/14651858.CD010746.pub2. Cochrane Database Syst Rev. 2017. PMID: 28231380 Free PMC article.
-
Fornix-based versus limbal-based conjunctival trabeculectomy flaps for glaucoma.Cochrane Database Syst Rev. 2015 Nov 25;11(11):CD009380. doi: 10.1002/14651858.CD009380.pub2. Cochrane Database Syst Rev. 2015. Update in: Cochrane Database Syst Rev. 2021 Aug 26;8:CD009380. doi: 10.1002/14651858.CD009380.pub3. PMID: 26599668 Free PMC article. Updated.
-
A Study of 24-h Efficacy and Safety of Sepetaprost vs. Latanoprost in Patients with Primary Open-Angle Glaucoma or Ocular Hypertension.Adv Ther. 2025 Aug;42(8):3810-3825. doi: 10.1007/s12325-025-03227-2. Epub 2025 Jun 10. Adv Ther. 2025. PMID: 40493333 Free PMC article. Clinical Trial.
-
Prescription of Controlled Substances: Benefits and Risks.2025 Jul 6. In: StatPearls [Internet]. Treasure Island (FL): StatPearls Publishing; 2025 Jan–. 2025 Jul 6. In: StatPearls [Internet]. Treasure Island (FL): StatPearls Publishing; 2025 Jan–. PMID: 30726003 Free Books & Documents.
-
Multifaceted behavioral interventions to improve topical glaucoma therapy adherence in adults.Cochrane Database Syst Rev. 2025 Jun 11;6(6):CD015788. doi: 10.1002/14651858.CD015788.pub2. Cochrane Database Syst Rev. 2025. PMID: 40497459 Review.
References
-
- Weinreb RN, Khaw PT. Primary open-angle glaucoma. Lancet. 2004; 363: 1711–1720. - PubMed
-
- Galin MA, Mc IJ, Magruder GB. Influence of position on intraocular pressure. Am J Ophthalmol. 1963; 55: 720–723. - PubMed
-
- Lam AK, Douthwaite WA. Does the change of anterior chamber depth or/and episcleral venous pressure cause intraocular pressure change in postural variation? Optom Vis Sci. 1997; 74: 664–667. - PubMed
-
- Anderson DR, Grant WM. The influence of position on intraocular pressure. Invest Ophthalmol. 1973; 12: 204–212. - PubMed
MeSH terms
Substances
LinkOut - more resources
Full Text Sources
Medical
