. 2025 Aug 19;135(20):e191781.
doi: 10.1172/JCI191781. eCollection 2025 Oct 15.

Loss of tumor cell MHC class II drives MAPK inhibitor insensitivity of BRAF-mutant anaplastic thyroid cancers

Affiliations

Loss of tumor cell MHC class II drives MAPK inhibitor insensitivity of BRAF-mutant anaplastic thyroid cancers

Vera Tiedje et al. J Clin Invest. .

Abstract

Cancer cells present neoantigens dominantly through MHC class I (MHCI) to drive tumor rejection through cytotoxic CD8+ T cells. There is growing recognition that a subset of tumors express MHC class II (MHCII), causing recognition of antigens by TCRs of CD4+ T cells that contribute to the antitumor response. We found that mouse BrafV600E-driven anaplastic thyroid cancers (ATCs) responded markedly to the RAF plus MEK inhibitors dabrafenib and trametinib (dab/tram) and that this was associated with upregulation of MhcII in cancer cells and increased CD4+ T cell infiltration. A subset of recurrent tumors lost MhcII expression due to silencing of Ciita, the master transcriptional regulator of MhcII, despite preserved IFN-γ signal transduction, which could be rescued by EZH2 inhibition. Orthotopically implanted Ciita-/- and H2-Ab1-/- ATC cells into immune-competent mice became unresponsive to the MAPK inhibitors. Moreover, depletion of CD4+, but not CD8+, T cells also abrogated the response to dab/tram. These findings implicate MHCII-driven CD4+ T cell activation as a key determinant of the response of Braf-mutant ATCs to MAPK inhibition.

Keywords: Antigen; Cancer; Endocrinology; Immunology; Thyroid disease.


Conflict of interest statement

Conflict of interest: The authors have declared that no conflict of interest exists.

Figures

Figure 1
Figure 1. Composition of the tumor immune microenvironment in human and murine thyroid cancers.
(A) Representative images of multiplex immunofluorescence staining for CD3, CD8, CD68, CD163, and CD15 of TMAs of 41 PTCs, 72 PDTCs, and 16 ATCs. Original magnification: Low power, 200µm; high power, 50 µm. (B) Quantification of TMA for G-MDSC (CD15+), M1-like TAM (CD68+/CD163), M2-like TAM (CD68+/CD163+), and T cells (CD3+/CD8 and CD3+/CD8+). (CE) Characterization of immune TME of murine Braf-CAV600E PTCs (n = 6) and Braf-CAV600E/p53–/– ATCs (n = 9) by multispectral flow cytometry: (C) CD45+ cells. (D) Myeloid subpopulations including macrophages (CD11b+Ly6GLy6CF480+), monocytes (CD11b+Ly6GLy6C+), dendritic cells (CD11c+F480MhcII+), eosinophils (CD11b+Ly6CLy6G+Siglec F+), G-MDSC (CD11b+Ly6G+Ly6CArg1+), neutrophils (CD11b+Ly6G+Ly6CArg1), and M-MDSC (CD11b+Ly6GLy6C+Arg1+). (E) Lymphoid cells including CD4+ T cells (CD3+CD4+FoxP3), Tregs (CD3+ CD4+ FoxP3+), CD8+ T cells (CD3+ CD8+), B cells (B220+) and NK cells (B220- NK1.1+). (F) Macrophage subtypes. B, C, and F: Multiple Mann-Whitney tests; D and E: 2-sided ANOVA with Šidák’s multiple-comparison test, with single pooled variance. Data are presented as mean ± SEM. TMA, tissue microarray; PDTC, poorly differentiated thyroid cancer; G-MDSC: granulocytic MDSCs; TAM, tumor-associated macrophages; M-MDSC, monocytic myeloid-derived suppressor cells.
Figure 2
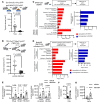
Figure 2. Induction of antigen presentation pathways in BRAFV600E ATC in response to MAPK inhibition.
Thyroid volume measurements (A) by MRI of dox-inducible BRAF/p53 GEMM on (n = 27) and off (n = 27) dox for 3–4 weeks and (B) by ultrasound in mice orthotopically injected with TBP3743 cells and treated 1 week after engraftment with 30 mg/kg dabrafenib and 3 mg/kg trametinib (n = 15) or vehicle (n = 15) for 2 weeks. Ingenuity pathway analysis of sorted thyrocytes of BRAF/p53 ATCs on and off dox (C) and orthotopic Braf/p53 ATCs treated with vehicle or dab/tram for 4 days (D). (EG) RT-PCR of the indicated MhcII complex mRNAs, Ciita, and Cd74 in sorted thyrocytes from Braf/p53 orthotopic ATCs treated with vehicle or dab/tram in vivo for 4 days. A, B, and EG: Multiple Mann-Whitney tests. Data are presented as mean ± SEM. GEMM, genetically engineered mouse model.
Figure 3
Figure 3. MhcII expression is suppressed in recurrent ATCs.
(A) Oncoprint of ATC specimens from 28 patients from the Memorial Sloan Kettering clinical cohort sequenced by MSK-IMPACT and subjected to HLA-DR IHC. (B) Percentage of ATC cells expressing HLA-DR in specimens from patients prior to MAPK inhibitor therapy (MAPKi naive, n = 17), at the time of structural response (MAPKi PR, n = 5), or during disease progression (MAPKi PD, n = 10) under therapy with dab/tram (n = 22), vemurafenib (n = 1), dabrafenib (n = 1), or PLX8394 (n = 1). (C) Representative IHC images of HLA-DR IHC. (D) Representative MRIs of a primary ATCs (+dox), the response 4 weeks after dox withdrawal (-dox), and a recurrence at 10 weeks (–dox). (E) MhcII flow cytometry of cell lines generated from primary ATCs (B92 and B16509) and recurrent tumors (B36244, B36934, B34286, B34838, and B37933) treated for 96 hours with vehicle (Veh), IFN-γ (20 ng/mL), trametinib (10 nM), or IFN-γ + trametinib in vitro. Plasma membrane MhcII levels were not induced by IFN-γ + trametinib in the recurrent ATC cell lines B36244 and B36934. B: Multiple Mann Whitney Tests. Mean with SEM. Bounds of the boxes represent interquartile ranges (IQR), interior lines represent the median, whiskers extend to minimum and maximum values, and outlying dots represent values 1.5 times the IQR. MAPKi, MAPK inhibitor; PR, partial response; PD, progressive disease.
Figure 4
Figure 4. Ciita expression is lost in recurrent ATC cells.
(AD) RT-PCR of 2 primary and 2 “MhcII-low” recurrent cell lines for the indicated MhcII complex genes (C and D), Ciita (A), and Cd74 (B) in response to IFN-γ, trametinib, or IFN-γ + trametinib for 96 hours. Kruskal-Wallis test. Data are presented as mean ± SEM.
Figure 5
Figure 5. Loss of tumor cell MhcII expression is associated with epigenetic silencing of the Ciita locus.
(A) RNA-Seq of B92 and B36934 cells, highlighting MhcI-, MhcII-, and IFN-γ–related gene expression pathways in response to a 96-hour treatment with vehicle, IFN-γ, trametinib, or IFN-γ + trametinib. (B) Unsupervised k-means clustering of ATAC-Seq peak gains (red) and losses (blue) in B92 and B36934 cells in the indicated treatment conditions. (C) Integrative Genomics Viewer (IGV) plot showing ATAC-Seq peak losses in the recurrent cell line B36934 in comparison to the primary cell line B92 at Stat1 transcription factor binding sites related to the Ciita locus. (D) Percentage of live cells expressing MhcII as determined by FACS in B92 and B36934 cells treated with IFN-γ, trametinib, or IFN-γ + trametinib, with or without addition of the EZH2 inhibitor tazemetostat.
Figure 6
Figure 6. Response of BRAFV600E-driven ATCs to dab/tram is lost in Ciita–/– and H2-ab1–/– ATCs and is CD4+ T cell dependent.
(A) Representative CD4 and CD8 immunofluorescence of Braf/p53 ATCs treated with vehicle or dab/tram for 10 days. (B) Quantification of CD4+ and CD8+ T cells in ATC slides as determined by immunofluorescence. Each dot represents an individual tissue specimen; n = 15 for each treatment condition. (C) Tumor volume changes of Ciitawt (n = 16) and 2 clones (n = 13 for #2F7_11 and n = 12 for #5) of Ciita–/– TBP3743 cells in response to dab/tram for 2 weeks. (D) Response of H2-ab1wt (n = 10) and 2 clones of H2-ab1–/– (n = 10 for #24 and n = 11 for #1) to dab/tram treatment for 2 weeks. (E) Tumor volume change of orthotopic ATCs in response to treatment with dab/tram (n = 9) or in combination with α-CD4 (n = 6) or α-CD8 (n = 5) depletion antibody. B: Multiple Mann-Whitney tests. CE: Kruskal-Wallis test. Data are presented as mean ± SEM. Whiskers indicate minimum to maximum and bounds of the boxes represent interquartile ranges.
Figure 7
Figure 7. Mechanisms of response and recurrence to MAPK pathway inhibition in BRAFV600E/ p53–/– ATC.
Upon MAPK inhibition, there is an induction of IFN-γ transcriptional output in ATC cells, leading to MhcII expression and T cell–mediated tumor cell death. Recurrences can occur through MAPK pathway reactivation and/or decreased immune surveillance due to Ciita silencing and loss of MhcII expression.

Update of

References

    1. Zaretsky JM, et al. Mutations associated with acquired resistance to PD-1 blockade in melanoma. N Engl J Med. 2016;375(9):819–829. doi: 10.1056/NEJMoa1604958. - DOI - PMC - PubMed
    1. Yang K, et al. Antigen presentation in cancer – mechanisms and clinical implications for immunotherapy. Nat Rev Clin Oncol. 2023;20(9):604–623. doi: 10.1038/s41571-023-00789-4. - DOI - PubMed
    1. Liu D, et al. Integrative molecular and clinical modeling of clinical outcomes to PD1 blockade in patients with metastatic melanoma. Nat Med. 2019;25(12):1916–1927. doi: 10.1038/s41591-019-0654-5. - DOI - PMC - PubMed
    1. Park IA, et al. Expression of the MHC class II in triple-negative breast cancer is associated with tumor-infiltrating lymphocytes and interferon signaling. PLoS One. 2017;12(8):e0182786. doi: 10.1371/journal.pone.0182786. - DOI - PMC - PubMed
    1. Johnson DB, et al. Melanoma-specific MHC-II expression represents a tumour-autonomous phenotype and predicts response to anti-PD-1/PD-L1 therapy. Nat Commun. 2016;7:10582. doi: 10.1038/ncomms10582. - DOI - PMC - PubMed

MeSH terms